Scottish economic insights: October 2024
Provides further analysis and insights on the economic themes presented in the monthly Scottish economic bulletin.
Part of
Longer Term Challenges around Productivity, Investment and Competitiveness
The recent succession of shocks to the economy arising from the pandemic and high inflation has resulted in significant volatility in short term indicators. However this section considers the impact on longer term trends around productivity, business investment and competitiveness.
Productivity
In 2023, productivity (output per hour worked) fell 1.1% compared to 2022, after growing by 4.6% in the previous year. The fall in productivity over the year reflects 0.1% growth in gross value added (GVA) which was offset by a 1.3% increase in total hours worked.
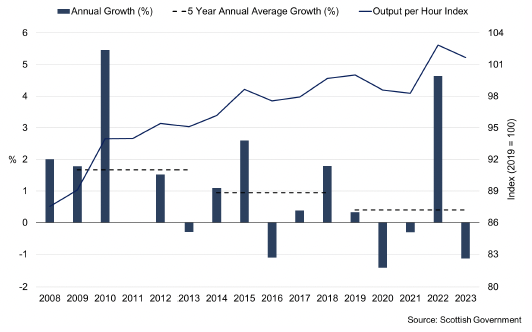
More broadly, while output per worker in 2023 remains above the pre-pandemic level in 2019 (+1.7%), the average annual rate of productivity growth over the past 5 years (0.4%, between 2018 and 2023) has moderated from previous 5-year periods of 0.9% (2013 – 2018) and 1.7% (2008 – 2013).
Business Investment
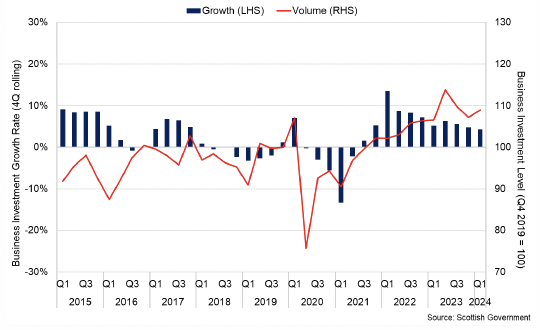
Business investment is a key driver of productivity and longer run trend growth. The volume of business investment fell sharply during the pandemic before rebounding over 2022 and 2023. The pace of growth moderated in 2023 with business investment growing 4.3% on a 4Q on 4Q basis in Q1 2024.
Latest business surveys for 2024 show that indicators of new capital investment have improved from 2023 however remain relatively weak overall. The SCC Quarterly Economic Indicator for Q2 2024 showed that investment trends are seeing growth across sectors and are expected to improve further going in the second half of 2024 while the Scottish Business Monitor reported that levels of new capital investment remained negative in Q2 2024 (-10.5) though had improved from 2023.[19],[20]
BICS data indicate that there has been a slight increase in the share of businesses expecting to increase capital expenditure in 2024, compared to the second half of 2023 while the share of businesses expecting to decrease capital expenditure has fallen slightly.[21]
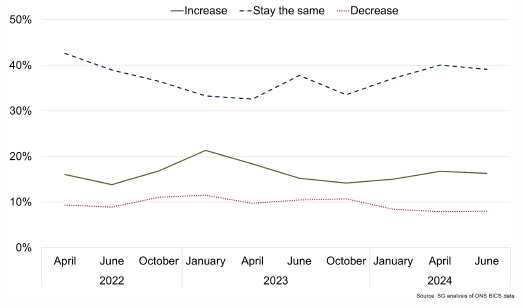
However, most respondents continue to report that they expect capital expenditure to remain the same (39%) indicating that investment expectations have improved only slightly at the start of the year.
Business investment, both domestic and inward investment, is a key driver of productivity growth. The following box provides more insight on Scotland’s international competitiveness.
Insight on Scotland’s International Competitiveness
This section considers Scotland’s competitiveness internationally and within the UK, with a particular focus on Scotland’s attractiveness for inward investment and tax. It is a condensed version of a recently published analytical report available at:
Overview of Scotland's International Competitiveness, October 2024.
Competitiveness is a broad term and generally refers to a wide range of economic, social, and institutional factors driving the performance of the economy: this overall “package” is key. Assessing and measuring competitiveness is a continuous process as change tends to be incremental and impacted by different factors (for example, planning, regulation, tax, skills, digital, trade openness etc.) at different points in time. Change can also happen quickly following major structural changes such as the recent financial crisis or changes to trade/market access (e.g. covid, EU exit) or external shocks such as the recent energy price shock.
In assessing competitiveness, most studies consider a basket of measures with relative ranking compared internationally.[22] For Scotland we have compared performance directly with the OECD but also considered the UK context.
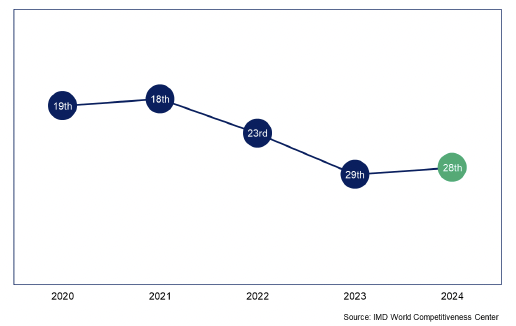
The UK’s competitiveness has declined following EU exit.[23] Scotland’s competitiveness will, in turn, have been adversely affected, but there has been some progress relative to the UK, albeit from a lower position.
In terms of key measures, Scotland’s competitiveness performance is mixed with strong skills, improving productivity but weaker performance on business creation and investment:
- 1st quartile for tertiary education (UK and OECD)
- 2nd quartile for productivity (OECD)
- 2nd quartile for research and development (R&D; OECD)
- 4th quartile for exports (OECD)
- 3rd quartile for early-stage entrepreneurism (OECD)
- 4th quartile for investment (Gross Fixed Capital Formation; OECD)
Within the UK context, productivity in Scotland is close to the UK average and outperformed all regions of the UK over the 1999-2019 period. Performance in terms of attracting inward investment projects has been consistently strong. Data from 2017 onwards also shows a net migration of workers from the rest of the UK to Scotland, boosting labour supply and income tax receipts. Challenges remain, however, including with respect to the supply of labour, especially for key skills groups and population growth.
Within Scotland, there has been increasing focus on tax differentials between Scotland and UK given the highly integrated nature of both economies. Tax is only one factor with regard to competitiveness, however for Scotland within the UK it can influence intra-UK migration and investment patterns. Scotland’s position within the UK where there is free movement of capital and labour means that, whilst incremental changes to tax – in isolation - may not influence in-migration or inward investment trends, increasing divergence in tax may lead to further behavioural change.
At the international level there is no clear relationship between tax and competitiveness.[24] Moreover, many key factors of competitiveness such as infrastructure and skills investment rely on tax revenues, and there is evidence that redistribution of income through taxation and transfers boosts growth.[25]
Business Conditions
Despite the overall improvement in the economy in 2024, business conditions remain challenging in the face of domestic and international headwinds which continue to impact demand and business investment.
Domestically, these include business concerns around the economy as well as concerns around skills shortages and lack of labour supply, and the resulting possible upward pressure on prices charged by businesses.
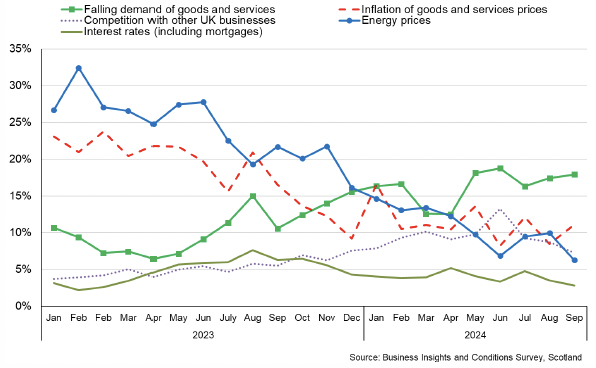
At the start of 2023, BICS data showed that businesses were widely reporting concerns about energy prices and inflation. Latest data for September however shows that only 6.3% and 11.1% of businesses are concerned about these issues respectively, in contrast to an increasing share of businesses responding that falling demand for goods and services is a main concern to them (17.9%).
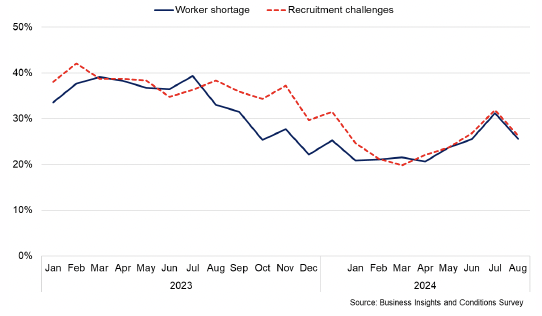
BICS data from July also showed that 26% of businesses report having a shortage of workers, with a similar share struggling to recruit. This is notably lower than in 2023 indicating that the labour market tightness has eased slightly and is consistent with online vacancy data for August which indicates that vacancies are down 31% from the elevated rates of 2023 and are broadly in line with their pre-pandemic level.
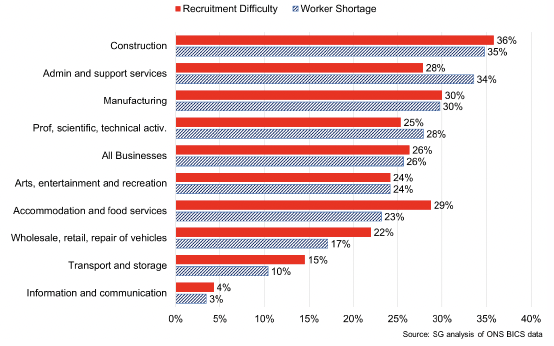
However, the recruitment challenge is not evenly distributed across the sectors of the economy. The construction, manufacturing and accommodation and food services sectors are more likely to experience recruitment difficulties than businesses overall, whereas sectors such as Information and Communication are less frequently reporting these issues.
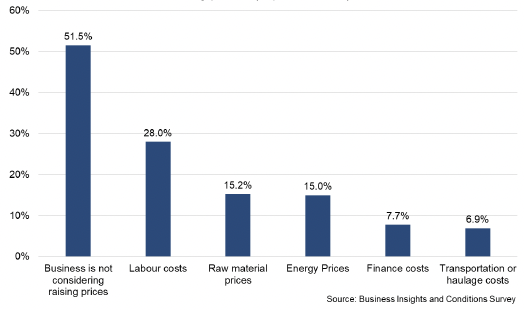
This labour supply constraint is likely contributing to increased labour costs facing businesses. Over half of businesses report that they are not considering raising prices, however labour costs (28%) is the most commonly cited factor for why a business is considering price increases, followed by raw material prices (15.2%) and energy prices (15%).
Business conditions across cost pressure, demand and labour supply are key factors, amongst many others, that influence business investment decisions. The following box provides more insight on the impact of income tax on labour supply and cross border migration.
Insight on the Impact of Income Tax on Labour Supply and Cross Border Migration
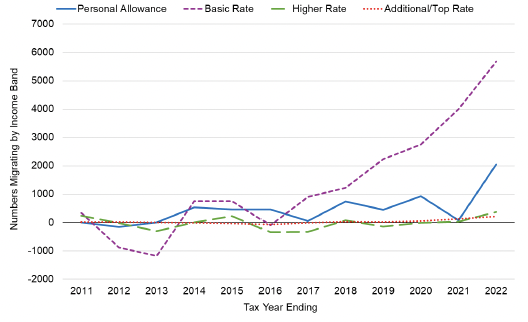
On 24 April, HMRC published two new pieces of research in collaboration with the Scottish Government, focusing on taxpayer mobility across the UK. The first one makes use of a new longitudinal dataset covering the incomes and location of UK taxpayers over a twelve-year period (2010-11 to 2021-22).[26] It shows historic trends of taxpayer migration between Scotland, Wales and the rest of the UK broken down by income level and age. More recent policy changes are not covered by the research as outturn data was only available until 2021-22 at the time.
The study finds a steady increase in net in-migration of taxpayers in the five years from when Scottish Income Tax was launched in 2017-18. On average during that period, almost 4,200 more taxpayers moved to Scotland than left each year, compared to 1,900 over the entire 12 year period. However, similar increases in net migration, especially during the Covid-19 pandemic, were observed in Wales. This suggests migration was largely driven by other factors.
Net migration has been positive across all tax bands since 2018-19, with the exception of the Higher rate. Net migration of Top rate taxpayers has been positive and increasing since 2018-19, and sharply since 2019-20, although absolute numbers are small given the size of this cohort. As a result net income flows have been positive and increasing from 2019-20 onwards.
While there was no noticeable decline in overall net migration in 2018-19, the first year of the five-band system, this analysis cannot tell us what would have happened if Income Tax had not diverged from the rest of the UK.
The second study attempts to answer this question by estimating changes in labour market participation and intra-UK cross-border migration following the 2018-19 tax reform.[27]
This study finds no evidence of changes to labour market participation, such as people taking early retirement or leaving paid work. This mirrors results in the academic literature which suggest that small changes to Income Tax are more likely to impact people’s decisions on how much to work, or whether to seek a pay rise, rather than whether to leave the labour market.
The study does, however, find evidence of a small fall in net migration to Scotland for individuals earning above the Higher Rate Threshold in 2018-19. This effect increases with income and is particularly pronounced for top rate taxpayers earning more than £500,000. However, it appeared to be short-lived and the study could not find evidence of persistence into 2019-20.
As an illustration, HMRC estimate that the policy might have resulted in 1,030 fewer Scottish taxpayers and, as a result, around £60 million of tax revenues, equivalent to 0.5% of the total Scottish tax base, might have been paid to the UK rather than the Scottish Government.
| Higher Rate | Top Rate (£150k to £500k) | Top Rate (£500k+) | Total | |
|---|---|---|---|---|
| Lost Tax (£m) | 11.7 | 11.1 | 37.8 | 60.6 |
| Net loss in Population | 840 | 130 | 60 | 1,030 |
However, there remains significant uncertainty around the scale of the response and estimates of potential receipts lost due to migration vary from £22 million to £99 million. The study also does not fully control for other factors affecting migration, such as Early Learning and Childcare expansion in Scotland.
In conclusion, both studies have to be considered together to fully understand the implications of the 2018-19 policy change. Looking at historic trends, the research suggests that net migration of taxpayers to Scotland has been positive and increasing since Income Tax policy has diverged from the rest of the UK. However, net migration of taxpayers would most likely have been higher in the absence of these policy changes, in line with findings in the international literature. HMRC’s research makes an important contribution to the evidence base. However, there will always be an element of uncertainty about the impact that past policy changes have had on taxpayers. Despite these new findings, the overall evidence suggests that the 2018-19 policy still raised additional revenue for investment in public services.
Contact
Email: economic.statistics@gov.scot
There is a problem
Thanks for your feedback