Scottish Greenhouse Gas Emissions 2012
This publication provides estimates of greenhouse gas emissions in Scotland for the years 1990 to 2012.
Scottish Greenhouse Gas Emissions 2012
This publication provides estimates of greenhouse gas emissions in Scotland for the years 1990 to 2012. Except where stated, the emissions figures shown in this release include an estimate of emissions from international aviation and shipping.
The release also provides information on the performance against emission reduction targets, taking account of trading in carbon units. These targets are prescribed in the Climate Change (Scotland) Act 2009.
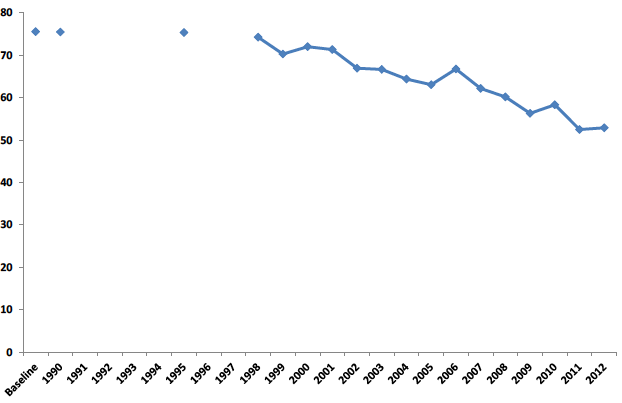
Scottish Greenhouse Gas Emissions, 1990 to 2012. Values in Mt CO2e

- In 2012, Scottish emissions of the basket of six greenhouse gases are estimated to be 52.9 million tonnes carbon dioxide equivalent (MtCO2e).
- This is 0.8 per cent higher than the 2011 figure of 52.5 MtCO2e, a 0.4 MtCO2e increase.
- Between 1990 and 2012, there was a 29.9 per cent reduction in estimated emissions. Section A states what the greenhouse gases are and how they are categorised. Section B contains results in more detail. The main contributors to this reduction have been a fall in energy supply emissions (such as in the production of electricity) and from business and industrial emissions.
- When emissions are adjusted to take account of trading in the EU Emissions Trading System (EU ETS), emissions increased by 0.5 per cent between 2011 and 2012 (from 55.4 MtCO2e to 55.7 MtCO2e). Section C provides information on what the EU ETS is and what it means for Scotland's Greenhouse Gas Emissions statistics.
- Compared with the Baseline[1], emissions in 2012 (after taking account of trading in the EU ETS) were 26.4 per cent lower. Section A contains more information on how the Baseline is defined and Section C contains results in more detail.
The annual target for 2012, as published in the Climate Change (Annual Targets) (Scotland) Order 2010, is 53.226 MtCO2e. The target is assessed using the adjusted emissions.
Note that as part of this release all of the figures have been revised since the previous publication in June 2013, to incorporate methodological improvements and new data. Comparing the 2012 figures with the 2011 figures published a year ago will therefore give a different year-on-year percentage change; one which is incorrect and should not be used. Details of these revisions can be found later in this statistical release in Section D.
Contact
Email: Martin Macfie
There is a problem
Thanks for your feedback