Scottish greenhouse gas emissions: 1990-2015
This publication provides estimates of greenhouse gas emissions in Scotland for the years 1990 to 2015.
Scottish Greenhouse Gas Emissions 2015
There are two measures of greenhouse gases presented in this release:
Source Emissions
A measure of the actual emissions or removals in Scotland. Includes international aviation and shipping. Used for UK and international comparisons.
| 48.1 MtCO 2e in 2015 | |||
|---|---|---|---|
| ↓ | 37.6% from 1990 | ↓ | 3% from 2014 |
Adjusted Emissions: For Reporting Against Targets
Emissions adjusted to account for Scotland's participation in EU-wide emissions trading and are used to measure progress against targets.
| 45.504 MtCO 2e in 2015 | |||
|---|---|---|---|
| ↓ | 41.0% from Baseline Period | ↑ | 1.8% from 2014 |
The Climate Change (Scotland) Act 2009 provides for a fixed annual target for 2015 of 45.928 MtCO 2e, which has been met. The Act also contains a 2050 target for at least an 80 per cent reduction from baseline levels and an interim 2020 target for at least a 42 per cent reduction. By 2015 a reduction of 41.0 per cent had been achieved.
MtCO 2e refers to million tonnes of carbon dioxide equivalent. This is a consistent measure of assessing the contribution of greenhouse gases to global warming.
The Baseline Period uses 1990 for carbon dioxide, methane and nitrous oxide and 1995 for hydrofluorocarbons, perfluorocarbons, sulphur hexafluoride and nitrogen trifluoride
Figures have been revised since last year's release to incorporate methodological improvements and new data
Section A of this release states what the greenhouse gases are, how they are categorised and when to use source or adjusted emissions. Section B contains results in more detail. Section C provides an explanation of how and why there are differences between the source and adjusted emissions. Section D contains information on revisions to the greenhouse gas statistics.
Key Trend - Source Emissions
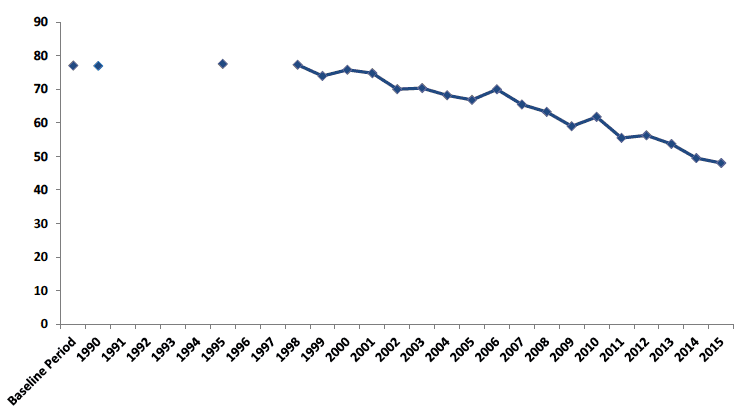
Scottish Greenhouse Gas Emissions, 1990 to 2015. Values in MtCO 2e

In 2015, Scottish emissions of the basket of seven greenhouse gases are estimated to be 48.1 million tonnes carbon dioxide equivalent ( MtCO 2e). This is 3.0 per cent lower than the 2014 figure of 49.5 MtCO 2e, a 1.5 MtCO 2e decrease.
The main contributor to this reduction between 2014 and 2015 is:
- Fall in Energy Supply emissions (such as power stations) (1.7 MtCO 2e; 12.0 per cent reduction)
Between 1990 and 2015, there was a 37.6 per cent reduction in estimated emissions, a 28.9 MtCO 2e decrease.
The 2 main contributors to this reduction are:
- Fall in Energy Supply emissions (such as power stations) (10.5 MtCO 2e; 46.4 per cent reduction)
- Fall in Business and Industrial Process (such as manufacturing) (5.8 MtCO 2e; 40.2 per cent reduction)
- Fall in Waste Management Emissions (such as Landfill) (4.2 MtCO 2e; 74.9 per cent reduction)
Section A states what the greenhouse gases are and how they are categorised. Scotland's net source emissions are comprised of sources of greenhouse gas emissions and sinks, which remove greenhouse gases from the atmosphere. Section B contains results in more detail. In particular, charts B2 , B5 and B6 provide more information about individual sector trends.
Key Trend - EU ETS Adjusted Emissions
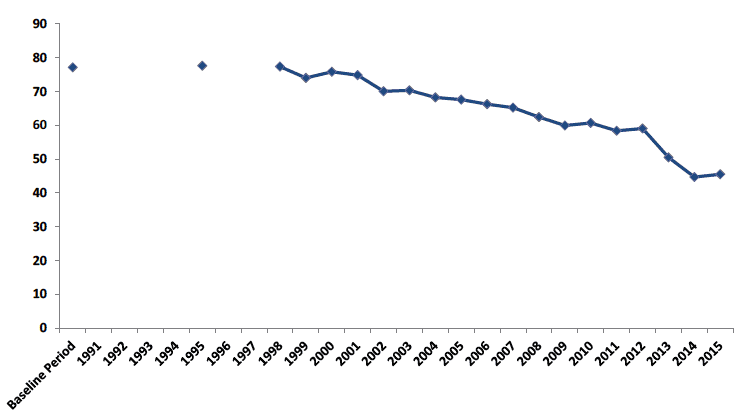
Scottish Greenhouse Gas Emissions, Adjusted for the EU Emissions Trading System, ( EU ETS). 1990 to 2015. Values in MtCO 2e

- When emissions are adjusted to take account of trading in the EU Emissions Trading System ( EU ETS), emissions increased by 1.8 per cent between 2014 and 2015 (from 44.7 MtCO 2e to 45.5 MtCO 2e). This is the basis against which progress towards the targets outlined within the Climate Change (Scotland) Act 2009 are measured.
- The EU ETS is an EU policy aimed at mitigating climate change by limiting greenhouse gas emissions from large point source emitters (primarily electricity generation and energy-intensive industries) and in aviation. Under accounting rules of the Climate Change (Scotland) 2009 Act, the contribution of those sectors to the annual targets is determined by the Scottish share of emissions allowances in the EU ETS, rather than the actual level of emissions. Section C provides information on what the EU ETS is and what it means for Scotland's Greenhouse Gas Emissions statistics.
- Compared with the Baseline Period [1] , emissions in 2015 (after taking account of trading in the EU ETS) were 41 per cent lower. Section A contains more information on how the Baseline Period is defined and Section C contains results in more detail.
Revisions to Greenhouse Gas Emissions Statistics
Note that as part of this release all of the figures have been revised since the previous publication in June 2016, to incorporate methodological improvements and new data. Comparing the 2015 figures with the 2014 figures published a year ago will therefore give a different year-on-year percentage change; one which is incorrect and should not be used. Details of these revisions can be found later in this statistical release in Section D.
Contact
There is a problem
Thanks for your feedback