Scottish Housing Market Review Q2 2024
Quarterly bulletin collating a range of previously published statistics on the latest trends in the Scottish housing market.
11. Lending to House Builders, Insolvencies and Construction Prices
11.1. Lending to House Builders
The value of loans outstanding to UK firms involved in the construction of domestic dwellings rose by £1.9bn from February to March 2020, an increase of nearly one-third (31%), as shown in Chart 11.1, which likely reflected a need to fund short-term liabilities owing to covid restrictions on construction activities and home moves.
From May 2020 to September 2021 the value of loans steadily decreased, falling below pre-covid levels; however, it then returned towards pre-pandemic levels, at least in nominal terms, and was above pre-pandemic levels in 2023. The value of outstanding loans in 2023 was 1.6% higher than the same period in 2022 and 0.5% higher than in 2019. But with the sharp increase in general inflation as well as in construction output prices (compare Chart 11.3), this represents a significant real-terms reduction in lending.
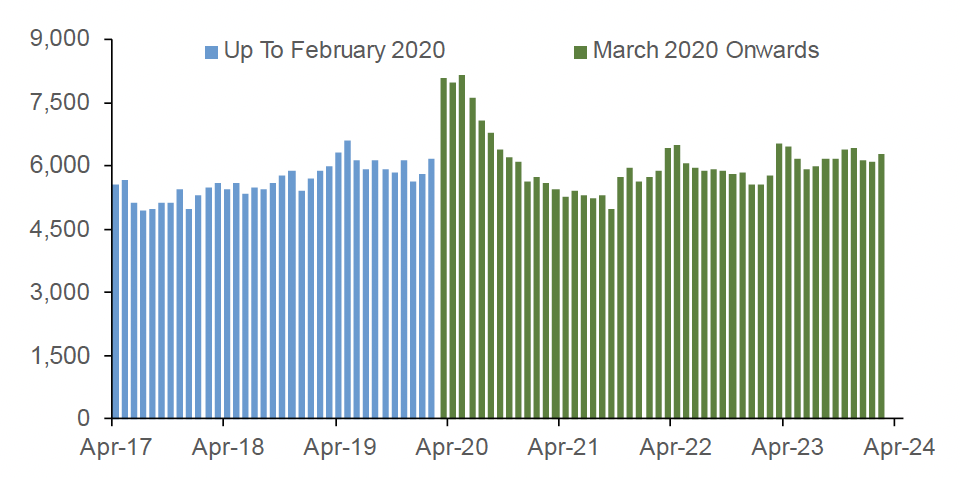
Source: Bank of England
11.2. Insolvencies
Chart 11.2 shows that, during the pandemic, insolvencies of construction companies registered in Scotland fell from 48 in Q1 2020 to 15 in Q1 2021, with a similar proportional fall evident for England and Wales, likely due to the business support in place. Subsequently, with this support unwinding, new-build construction-output prices increasing (as shown in Chart 11.3) and cost-of living pressures potentially impacting demand, there was an increase in insolvencies for construction companies registered in Scotland. However, latest fiscal year data suggest that the number of insolvencies of companies registered in Scotland has levelled off around pre-pandemic levels: there were 202 insolvencies in 2023/24, little changed from 2019/20 (205). Furthermore, the 52 insolvencies of construction companies registered in Scotland in Q1 2024 was the same as a year earlier.
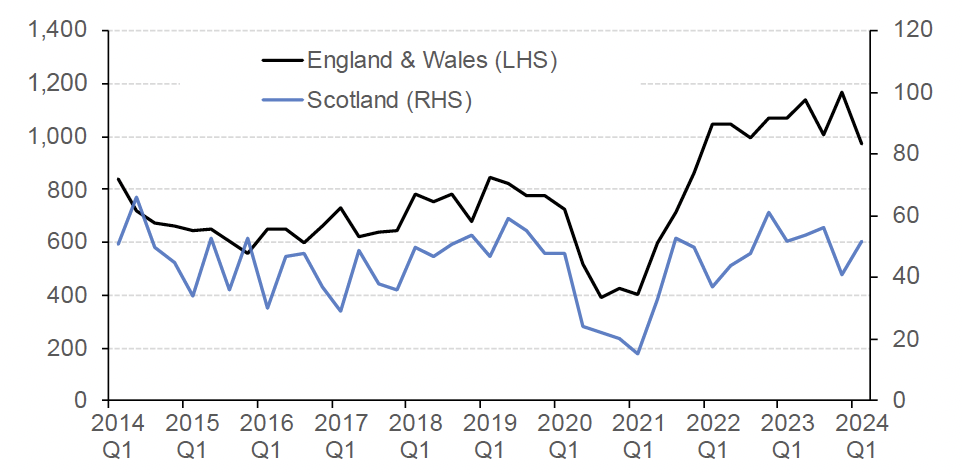
Source: The Insolvency Service
11.3. Output and Input Prices for New Housing
ONS construction-output price data shows that the index for new housing, which covers a range of costs (including earnings) associated with building new public and private housing, increased by an annual 2.0% in March 2024, falling from a peak of 12.2% in June 2022 (Chart 11.3).
Data from the UK Government (also illustrated in Chart 11.3) shows that the annual growth rate in the cost of construction materials used in new house building, which had reached as high as 24.0% in June 2022, and thus contributed significantly to output-price inflation for new housing, has fallen sharply to -0.2% in March 2024. Flexible pipes and fittings, metal doors and windows, and gravel, sands, clays and kaolin were the materials showing more than 10% annual growth in the year to April 2024 (19.3%, 17.7% and 11.3% respectively). Fabricated structural steel and steel concrete rebar saw the biggest annual drops (-22.7% and -18.0% respectively). Gravel, sand, clays and kaolin, including the Aggregate Levy, was down by 12.8%.
ONS average weekly earnings data show that annual growth in total pay in the construction sector has slowed consistently from its peak of 14.3% in the three months to June 2021, to stand at 2.1% in the three months to April 2024. (Source: ONS).
The downward trend in materials and labour prices is reflected in the annual growth rate in the output price index for new housing, which has fallen from 12.2% in June 2022 to 2.0% in March 2024.
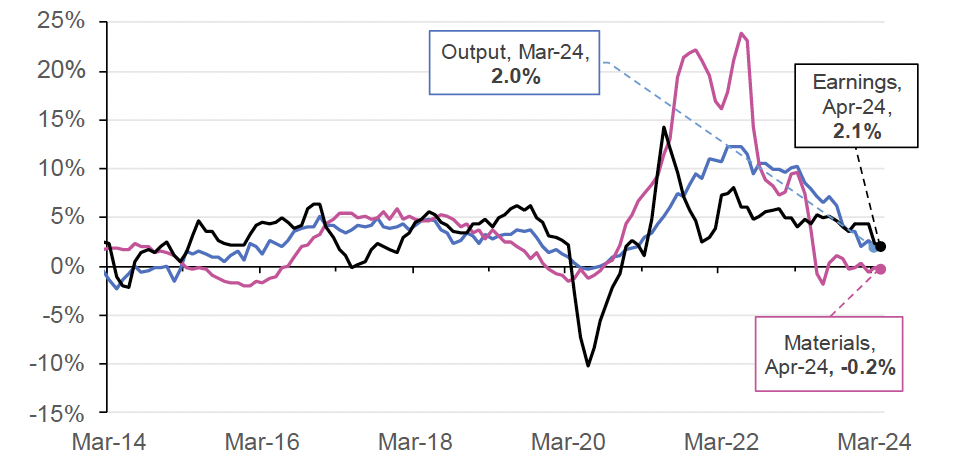
Source: ONS and UK Government
Contact
Email: Jake.Forsyth@gov.scot
There is a problem
Thanks for your feedback