Scottish Housing Market Review Q2 2024
Quarterly bulletin collating a range of previously published statistics on the latest trends in the Scottish housing market.
1. Sales
1.1. Scottish Sales Performance: National
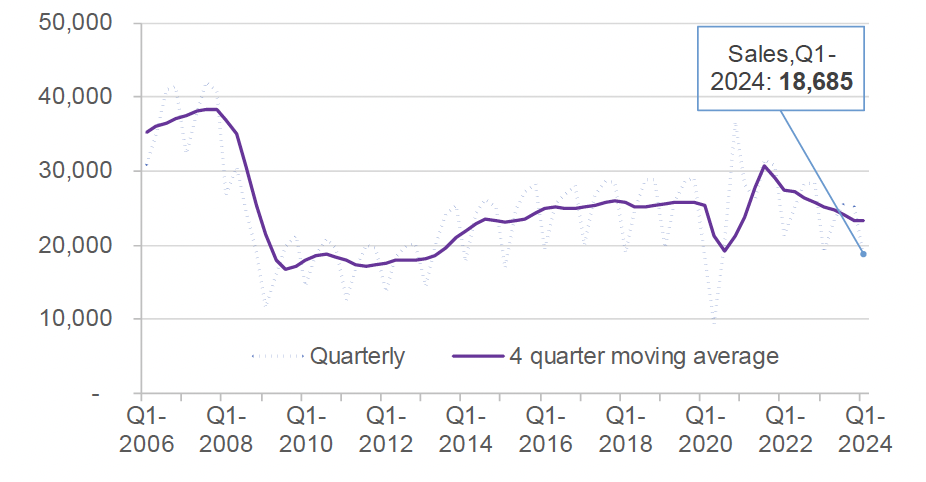
Source: Registers of Scotland
After a period of considerable volatility due to the impact of the Covid-19 pandemic, as well as measures such as the temporary reduction in Land and Buildings Transaction Tax, the volume of transactions has been trending down due to the impact of the cost-of-living crisis, in particular the increase in interest rates (see Section 6). Registers of Scotland statistics show that there were 18,685 residential property sales registered across Scotland in Q1 2024 – relative to Q1 2023 this was a decrease of 1.8% (342); compared to the pre-pandemic position in Q1 2019 this was a decrease of 4.6% (891). The annual change in transactions was negative for the tenth consecutive quarter in Q1 2024.
Chart 1.2, which uses Revenue Scotland data to plot the percentage difference between monthly residential LBTT returns over the period 2020 to 2024 relative to the corresponding month in 2019 (with 2019 chosen as the baseline to reflect pre-Covid market conditions), provides a more fine-grained picture of recent trends. While it can be seen that for much of 2022, transactions closely tracked their levels in 2019, the number of transactions since December 2022 has generally been lower than before the pandemic. While this remains the case for the most recent 5-month period ending May 2024, with transactions down by 5.6% relative to the 5 month-period ending May 2019 (prior to the pandemic), transactions were up by 4.2% relative to the five-months to May 2023. This suggests that the downward trend in transactions may be coming to an end, although more data is required to confirm this.
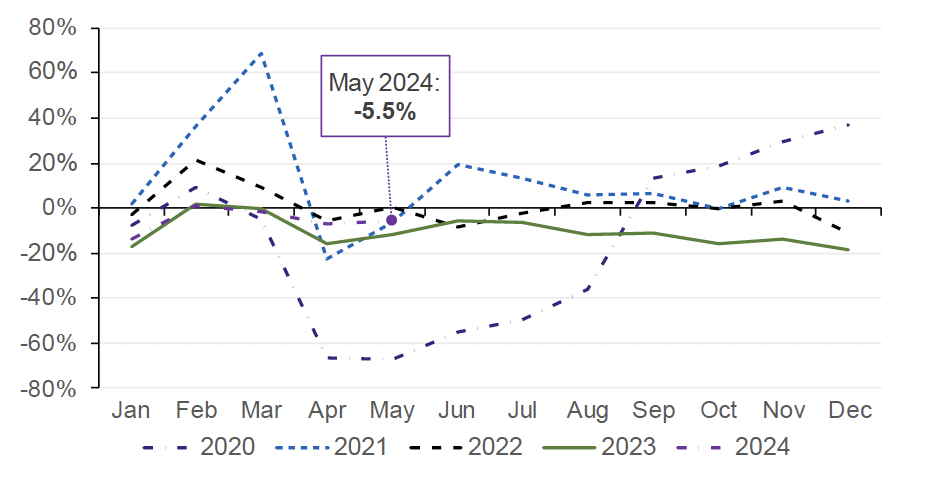
Source: Revenue Scotland
1.2. Scottish Sales Performance: Local Authorities
Table 1.1 sets out the level and annual change in quarterly transactions by local authority. The volume of transactions at local authority level can fluctuate significantly – particularly in smaller local authorities such as the island local authorities – and to remove some of this volatility, the change in transactions in the last 4 quarters compared to the preceding 4 quarters is also presented.
Focussing on the longer-term trend due to the volatility of quarterly data, Table 1.1 shows that housing market activity has declined in 27 out of the 32 local authorities in the four quarters to Q1 2024 compared to the previous four quarters. The local authority that experienced the highest growth was North Ayrshire (0.8%, 20 transactions), while Aberdeenshire had the steepest fall of 16.8% (750 transactions).
Local Authority |
Sales - Q1 2024 |
Q1 2024 on Q1 2023 |
4 quarters to Q1 2024 on previous 4 quarters |
|---|---|---|---|
Aberdeen City |
755 |
-1.6% |
-9.7% |
Aberdeenshire |
662 |
-7.8% |
-16.8% |
Angus |
304 |
-14.4% |
-14.9% |
Argyll and Bute |
347 |
-0.3% |
-9.1% |
City of Edinburgh |
2,084 |
5.0% |
-7.8% |
Clackmannanshire |
153 |
-15.9% |
-7.9% |
Dumfries and Galloway |
433 |
0.5% |
-5.6% |
Dundee City |
522 |
4.6% |
-13.0% |
East Ayrshire |
440 |
2.3% |
-6.8% |
East Dunbartonshire |
331 |
-0.6% |
-5.6% |
East Lothian |
364 |
-20.7% |
-7.8% |
East Renfrewshire |
339 |
6.9% |
-3.4% |
Falkirk |
523 |
3.2% |
-4.3% |
Fife |
1,268 |
-6.0% |
-5.8% |
Glasgow City |
2,224 |
-2.3% |
-10.5% |
Highland |
762 |
3.1% |
-8.8% |
Inverclyde |
251 |
1.6% |
-4.3% |
Midlothian |
333 |
-13.3% |
-12.9% |
Moray |
284 |
-17.7% |
-9.8% |
Na h-Eileanan Siar |
48 |
-7.7% |
0.0% |
North Ayrshire |
531 |
9.7% |
0.8% |
North Lanarkshire |
1,117 |
5.6% |
-5.6% |
Orkney Islands |
75 |
8.7% |
10.2% |
Perth and Kinross |
509 |
-6.9% |
-8.8% |
Renfrewshire |
771 |
-1.9% |
-7.0% |
Scottish Borders |
395 |
14.5% |
-8.0% |
Shetland Islands |
61 |
24.5% |
-8.3% |
South Ayrshire |
440 |
4.0% |
3.9% |
South Lanarkshire |
1,206 |
-5.7% |
-7.8% |
Stirling |
270 |
-23.7% |
-11.3% |
West Dunbartonshire |
274 |
3.8% |
0.9% |
West Lothian |
609 |
-5.7% |
-7.8% |
Scotland |
18,685 |
-1.8% |
-7.9% |
Source: Registers of Scotland
Contact
Email: Jake.Forsyth@gov.scot
There is a problem
Thanks for your feedback