Scottish Housing Market Review Q2 2024
Quarterly bulletin collating a range of previously published statistics on the latest trends in the Scottish housing market.
2. House Prices
2.1. Scottish House Price Performance: National
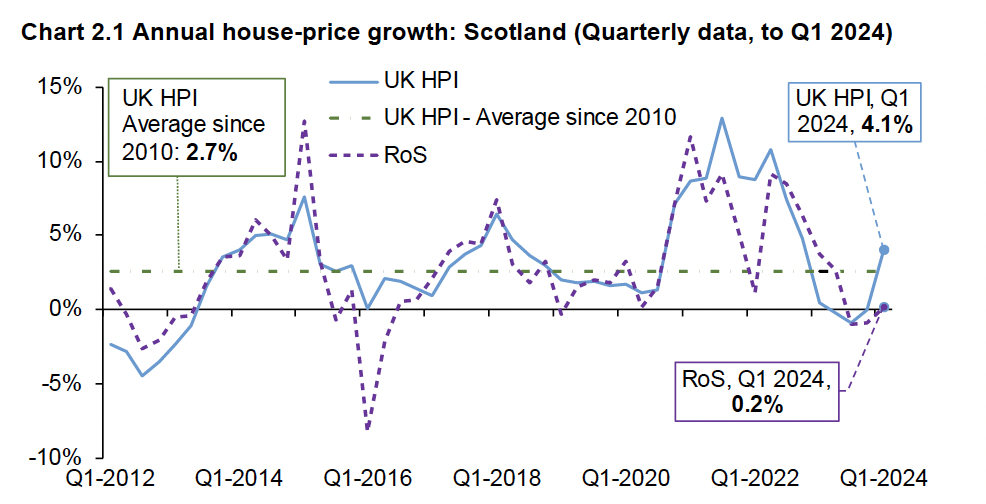
Source: Registers of Scotland, UK HPI (Scotland)
Average house prices in Scotland, as measured by the UK House Price Index (HPI), increased annually by 4.1% in Q1 2024. This is higher than the growth rate for the previous four quarters and is higher than the UK HPI average growth rate recorded since 2010 (2.6%). The average property price (mix-adjusted, geometric mean) in Scotland stood at £187K in Q1 2024. More recent data suggests that house-price inflation continued to increase in April 2024 with an annual growth rate of 4.5%.
Registers of Scotland data shows that the average (arithmetic mean) house price in Scotland rose by 0.2% to £210K in the year to Q1 2024. Registers of Scotland data is not mix-adjusted, so it will be affected by the composition of properties sold.
UK HPI data shows that annual house price growth in Q1 2024 was highest for semi-detached properties (4.8%), while flats increased the least (3.4%).
2.2. Scottish House Price Performance by Dwelling/Buyer Type
Chart 2.2 shows the rate of change in the average new and existing build property prices in Scotland. This data is published with a lag relative to the headline HPI. In Q4 2023, the average Scottish new-build property price increased to a greater extent than the existing build price, rising by an annual 7.2% to £264K. The average existing build price decreased over the year, falling by 1.0% to £182K.
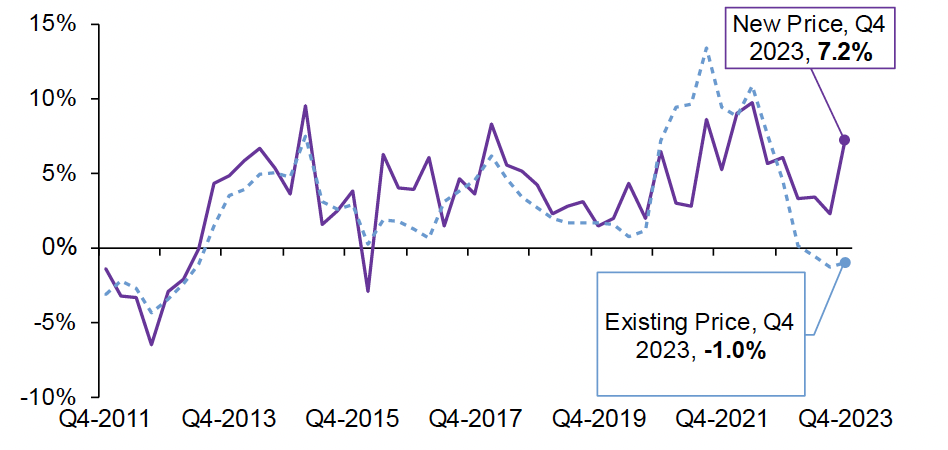
Source: UK HPI (Scotland)
The UK HPI also shows that the average price of a property bought by former owner occupiers in Scotland increased by an annual 4.3% in Q1 2024, to £226K. Meanwhile, the average price of a property purchased by a first-time buyer increased by an annual 3.9% in Q1 2024, to £150K.
2.3. Scottish House Price Performance: Local Authorities
Table 2.1 sets out the level and annual change in quarterly house prices by local authority. The small number of sales in some local authorities, such as the island local authorities, can lead to some volatility in estimated house prices despite the HPI methodology adjusting for the mix of houses sold; therefore, the change in average house prices in the last 4 quarters compared to the preceding 4 quarters is also presented.
Focussing on the longer-term trend due to the volatility of quarterly data, Table 2.1 shows that 18 of the 32 local authorities saw an increase in their average house price in the four quarters to Q1 2024 relative to the previous four quarters. The rate of increase was highest in Na h-Eileanan Siar (6.2%), while the largest decreases were in Shetland Islands (-7.0%), Orkney Islands (-6.8%), and the City of Aberdeen (‑3.9%).
Local Authority |
Sales - Q1 2024 |
Q1 2024 on Q1 2023 |
4 quarters to Q1 2024 on previous 4 quarters |
|---|---|---|---|
Aberdeenshire |
£195,569 |
-0.8% |
-1.5% |
Angus |
£164,443 |
1.5% |
-1.4% |
Argyll and Bute |
£185,303 |
-2.2% |
-2.4% |
City of Aberdeen |
£130,553 |
1.9% |
-3.9% |
City of Dundee |
£141,469 |
4.1% |
-1.0% |
City of Edinburgh |
£320,512 |
4.5% |
1.2% |
City of Glasgow |
£172,558 |
4.8% |
1.3% |
Clackmannanshire |
£164,747 |
3.7% |
0.5% |
Dumfries and Galloway |
£160,926 |
0.1% |
-1.4% |
East Ayrshire |
£127,031 |
2.5% |
-2.0% |
East Dunbartonshire |
£263,995 |
3.6% |
0.6% |
East Lothian |
£299,519 |
5.6% |
4.8% |
East Renfrewshire |
£281,293 |
1.3% |
2.4% |
Falkirk |
£166,174 |
4.0% |
0.6% |
Fife |
£165,166 |
-0.7% |
1.5% |
Highland |
£205,591 |
1.2% |
0.3% |
Inverclyde |
£124,940 |
10.3% |
4.5% |
Midlothian |
£234,613 |
5.2% |
2.4% |
Moray |
£188,388 |
0.6% |
2.1% |
Na h-Eileanan Siar |
£157,304 |
9.2% |
6.2% |
North Ayrshire |
£129,027 |
1.6% |
-1.3% |
North Lanarkshire |
£136,151 |
3.2% |
1.4% |
Orkney Islands |
£197,748 |
-1.5% |
-6.8% |
Perth and Kinross |
£238,116 |
1.5% |
-0.3% |
Renfrewshire |
£154,769 |
5.5% |
0.9% |
Scottish Borders |
£199,601 |
3.0% |
-0.1% |
Shetland Islands |
£208,811 |
-2.9% |
-7.0% |
South Ayrshire |
£171,352 |
3.0% |
-1.0% |
South Lanarkshire |
£162,494 |
2.5% |
0.4% |
Stirling |
£241,267 |
1.6% |
0.8% |
West Dunbartonshire |
£136,157 |
4.1% |
-1.1% |
West Lothian |
£211,574 |
3.9% |
0.2% |
Scotland |
£186,937 |
4.1% |
0.7% |
Source: UK HPI
Contact
Email: Jake.Forsyth@gov.scot
There is a problem
Thanks for your feedback