Scottish Housing Market Review Q2 2024
Quarterly bulletin collating a range of previously published statistics on the latest trends in the Scottish housing market.
5. Mortgage Approvals and LTVs
5.1. New Mortgage Advances
Chart 5.1 plots the number of new mortgages advanced to first-time buyers and home movers in Scotland. There were 6,050 new mortgages advanced to first-time buyers in Scotland in Q1 2024, an annual increase of 9.6%. Meanwhile, there were 5,680 new mortgages advanced to home movers in Scotland in Q1 2024, an annual increase of 2.2%. This is the first quarter since Q3 2021 that there has been an increase in lending to first-time buyers and to home movers on an annual basis.
Despite the increase in Q1 2024, new mortgage advances to first-time buyers over fiscal year 2023-24 as a whole was down by an annual 5.5% to 27,560, whilst for home movers there was a steeper fall of 11.8% to 26,660 (Source: UK Finance).
These trends are likely to reflect the impact of increases in mortgage rates (see Section 6) on activity levels in the housing market, which had previously rebounded strongly after the release of Covid-19 pandemic restrictions.
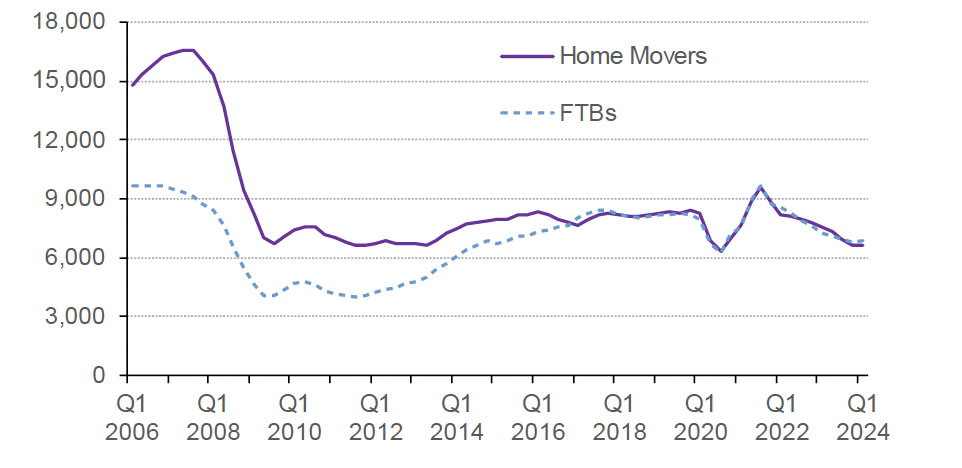
Source: UK Finance
5.2. Mortgage Approvals
Chart 5.2 plots the monthly number of mortgage approvals across the UK for house purchase by individuals. Mortgage approvals for house purchase, which are the firm offers of lenders to advance credit fully secured on dwellings by a first-charge mortgage, are a leading indicator of mortgage sales as they reflect activity early in the buying process.
Mortgage approvals across the UK rebounded strongly in the latter half of 2020 after the easing of Covid-19 restrictions, before stabilising around 2019 (pre-covid) levels in the second half of 2021 and much of 2022 (see Chart 5.2). Subsequently, beginning in the last quarter of 2022 and continuing into 2023, approvals began to fall significantly below pre-covid levels. However, in the latest 4-month period (to April 2024), approvals have risen by 31% relative to the corresponding period a year earlier, although this remains 4.4% below the level recorded in the 4 months to April 2019, immediately before the pandemic started (Source: Bank of England).
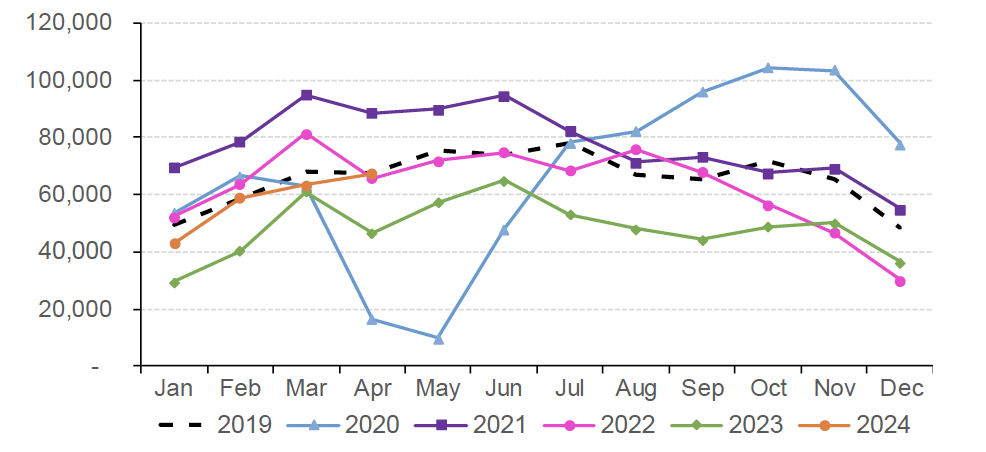
Source: Bank of England
5.3. Loan-to-Value (LTV) Ratios
In Q1 2024, the mean LTV ratio on new mortgages advanced to first-time buyers in Scotland edged up from 80.1% in Q4 2023 to 80.9% in Q1 2024, as did the ratio for home movers, which rose from 67.1% to 68.3%. This is shown in Chart 5.3. (Source: UK Finance). The mean LTV ratio for first-time buyers in Q1 2024 is similar to its level in Q1 2020, immediately prior to the impact of the Covid-19 pandemic (down by only 0.6% points), but the mean LTV ratio for home movers has fallen significantly over this period, by 3.5% points.
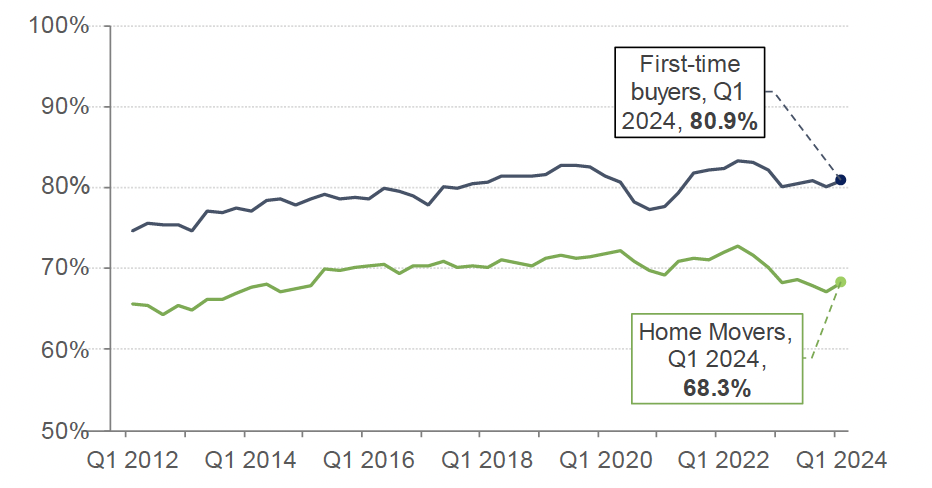
Source: UK Finance
Chart 5.4 shows that while there was a reduction in new regulated residential lending at high LTV ratios across the UK during the onset of the Covid-19 pandemic, there was a strong rebound once covid restrictions were lifted, although more recently the impact of higher mortgage rates has meant that the share of mortgage lending with an LTV over 90% has not returned to its level immediately before the pandemic.
In Q1 2024 there was a quarterly decrease in the share of all advances with an LTV greater than 90% as well as in the share of all loans with both an LTV greater than 90% and a high income multiple (both by 0.3% points). However, on an annual basis, the share of all loans with an LTV greater than 90% increased by 1.2% points and the share of all loans with both an LTV greater than 90% and a high income multiple increased by 0.5% points.
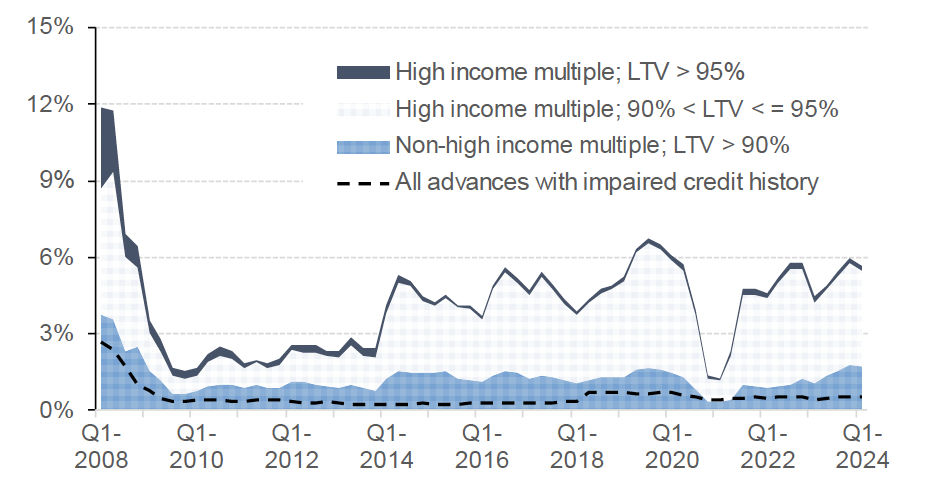
Source: FCA. Higher-risk lending is classified by the FCA as an LTV over 90% or an income multiple greater than or equal to 3.5 for single-income purchasers or 2.75 for joint-income purchasers.
These trends are in part the result of fluctuations in the availability of mortgage products, particularly those with higher LTVs. The market volatility following the UK Government Plan for Growth/mini budget on 23 September 2022 resulted in a sharp fall in the total number of residential mortgage products to 2,258 on 1 October 2022. Since then, and aside from a temporary fall following higher-than-expected inflation figures released in mid-2023, the total number of products has been on an upward trend, reaching 6,658 on 1 July 2024. This represents the highest level recorded since February 2008 (6,760) and is also far higher than a year ago (4,432). Availability of mortgage products across LTV tiers saw minimal movement over the month. (Source: Moneyfacts UK Mortgage Trends Treasury Reports)
Mortgage shelf life is the length of time between the launch of a product and its repricing or withdrawal from the market, and average shelf life is an indicator of volatility in the mortgage market. The average mortgage product shelf life increased from 15 days on 3 June 2024 to 30 days on 1 July 2024, which reflects the minimal changes in interest rates across all LTV tiers in the month. This is also the highest level seen within the last two years and higher than the 12-month average (21 days) (Source: Moneyfacts UK Mortgage Trends Treasury Reports).
The total number of buy-to-let (BTL) mortgage products also fell sharply after the UK Government mini-budget, decreasing by 52% from 2,075 on 1 September 2022 to 988 on 1 October 2022. Since then, in general, there has been an increase in product numbers. The total number of BTL products on 1 July 2024 was 2,964, close to the recent peak of 2,977 in December 2023, although still below the series peak of 3,540 in February 2022 (Source: Moneyfacts UK Mortgage Trends Treasury Reports).
Contact
Email: Jake.Forsyth@gov.scot
There is a problem
Thanks for your feedback