Scottish Housing Market Review Q2 2024
Quarterly bulletin collating a range of previously published statistics on the latest trends in the Scottish housing market.
8. Mortgage Arrears and Possessions
8.1. Arrears
As shown in Chart 8.1, following a peak of 39,556 in Q4 2008 during the financial crisis, there was a long-term declining trend in the number of regulated mortgage accounts entering arrears, which continued during the Covid period to reach a trough of 8,579 in Q3 2021[4] (Source: FCA). Over the last three years the number of regulated mortgage loan accounts entering arrears has risen consistently from 34,860 in 2021/22 to 45,593 in 2022/23, to the latest figure of 59,140 in 2023/24. This is the highest level reached since 2014/15 when 66,157 accounts entered arrears.
Despite the number of mortgage accounts entering arrears in Q1 2024 easing on the previous quarter, it was up by an annual 2,746 (22.7%). Moreover, compared to the quarterly average for 2019-20, immediately prior to the pandemic, the number of accounts entering arrears in Q4 2023 was 16% higher.
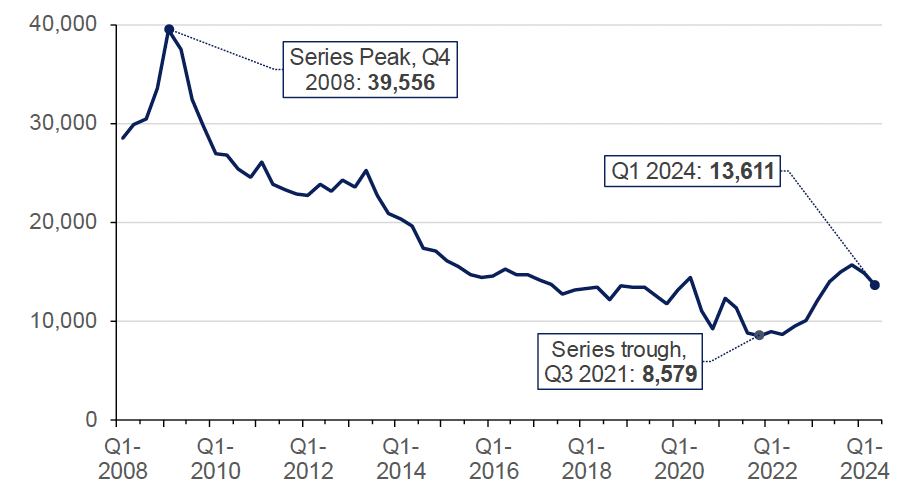
Source: FCA. Includes both securitised and unsecuritised loans.
The share of lenders' outstanding regulated mortgage balances that were in arrears of more than 1.5% of the outstanding loan balance stood at 1.2% at the end of Q1 2024. This share had remained broadly stable during the pandemic but started to increase sharply at the end of 2022 and into 2023. Chart 8.2 plots the share of lenders' outstanding balances that were in arrears by degree of severity. As would be expected, the categories which have recorded the largest increase in share since the recent trough are the lowest arrears categories (1.5% - 2.5% and 2.5% - 5.0%) since it will take time for arrears to accumulate. In Q1 2024, the share of the highest category of arrears (10% or more) is, at 0.27% of total loan balances, currently still approximately in line with its average in the post-covid period (0.22% over the period from Q2 2020 to Q1 2024).
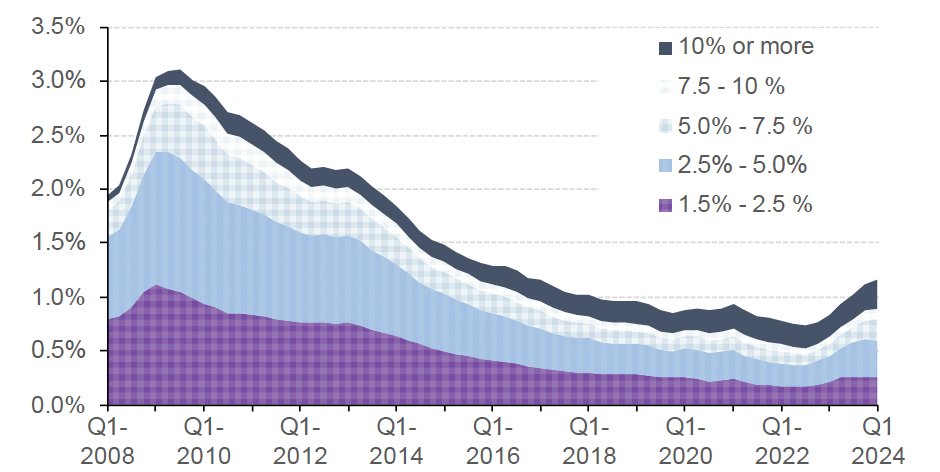
Source: FCA. Includes both securitised and unsecuritised loans; share is calculated as balances on cases which are in arrears expressed as a % of total loan balances.
UK Finance data shows that there was 18,860 BTL mortgages in arrears of 1.5% or more of the outstanding balance across the UK at the end of Q1 2024, compared to 10,650 a year earlier. The number of BTL mortgages in arrears of 1.5% or more as a percentage of the total number of BTL mortgages was 0.95%. FCA data for non-regulated lending (which includes BTL lending but also some other types of lending, and is collected on a somewhat different basis[5]) shows that at the end of Q1 2024 mortgages which were 1.5% or more in arrears represented 1.87% of the total number of mortgages, up from 1.01% a year earlier, and the highest figure since Q3 2014, although it remains well below the peak of 2.68% reached in Q1 2009 during the financial crisis.
8.2. Possessions
FCA data (see Chart 8.3) shows that despite restrictions on possessions having been lifted on 1 April 2021, there were only 856 new regulated mortgage possessions across the UK in Q1 2024. This was an annual increase of 7.7%, and 31% below the quarterly average for 2019-20, the fiscal year preceding the pandemic.
With respect to non-regulated mortgage lending, FCA data show that there was a 82% annual increase in new possessions in Q1 2024, which took the level of possessions to 44% above the average for 2019-20 (Chart 8.3). Similarly, UK Finance data on Buy-to-Let mortgages (a component of non-regulated mortgage lending) shows a 40% annual rise in possessions across the UK to 600 in Q1 2024, although this remains 12% below the average for 2019-20.
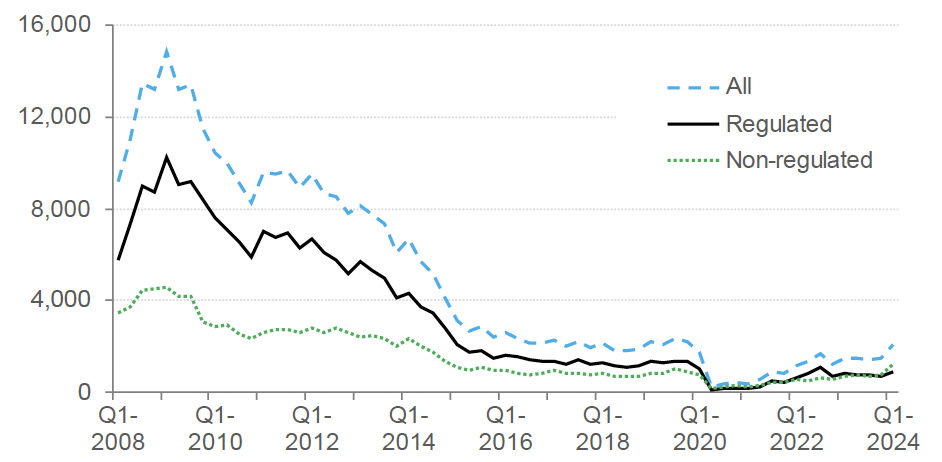
Source: FCA
Contact
Email: Jake.Forsyth@gov.scot
There is a problem
Thanks for your feedback