Scottish Housing Market Review Q3 2024
Quarterly bulletin collating a range of previously published statistics on the latest trends in the Scottish housing market.
10. Housing Supply
For a broader analysis of the latest housing supply data, which includes information on the geographical distribution of new build and affordable housing supply across local authorities, visit the Housing Statistics for Scotland webpage.
10.1. New Build
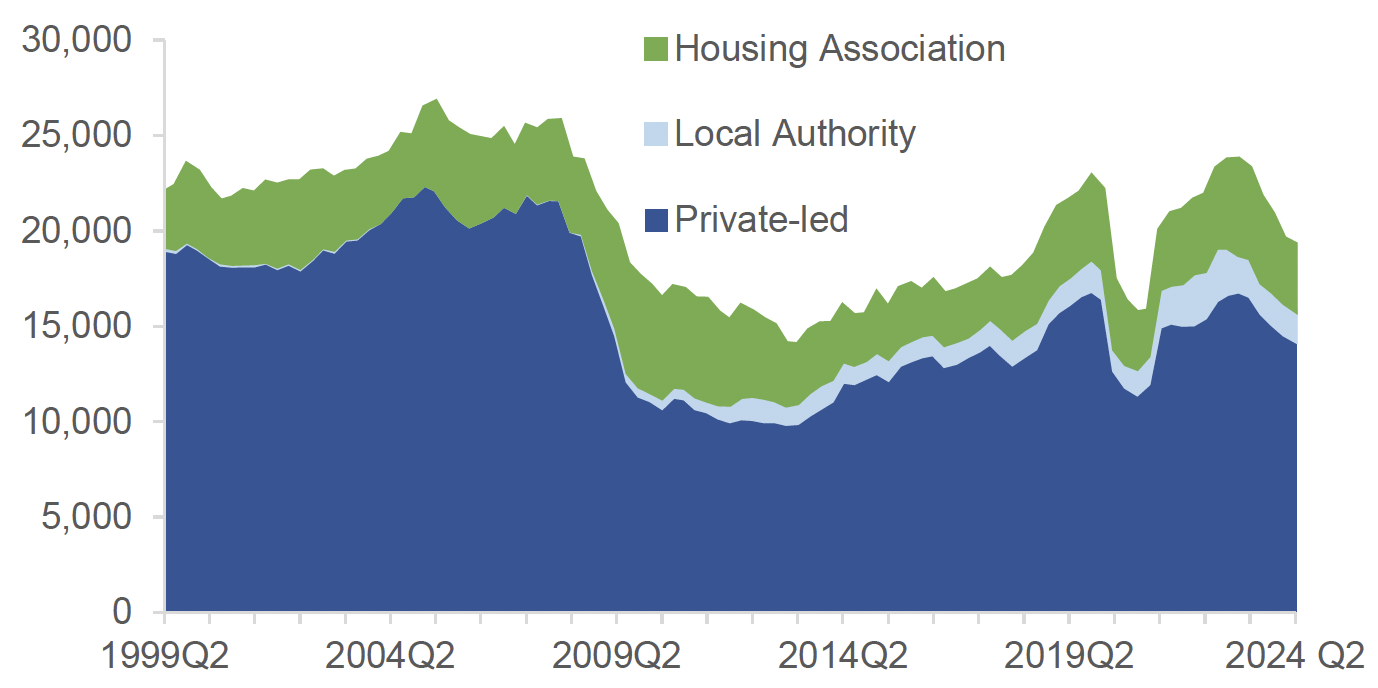
There has been a downward trend in all-sector new-build completions in Scotland since Q2 2023. Recent data shows that all-sector new-build completions for the year to June 2024 totalled 19,293, 4,003 (‑17%) less than the year to June 2023. Over the same period, all-sector new build starts fell by 3,032 (-17%) to 15,296.
The slowdown in housebuilding activity is illustrated in Chart 10.1, which includes a breakdown of new-build completions by sector. In the year to June 2024 the private sector completed 14,240 homes, 2,354 (-14%) less than the year before and over the same period, in the social sector, the number of homes completed was 5,053, an annual decline of 1,649 (-25%).

Source: Scottish Government
10.2. Affordable Housing Supply Programme (AHSP)
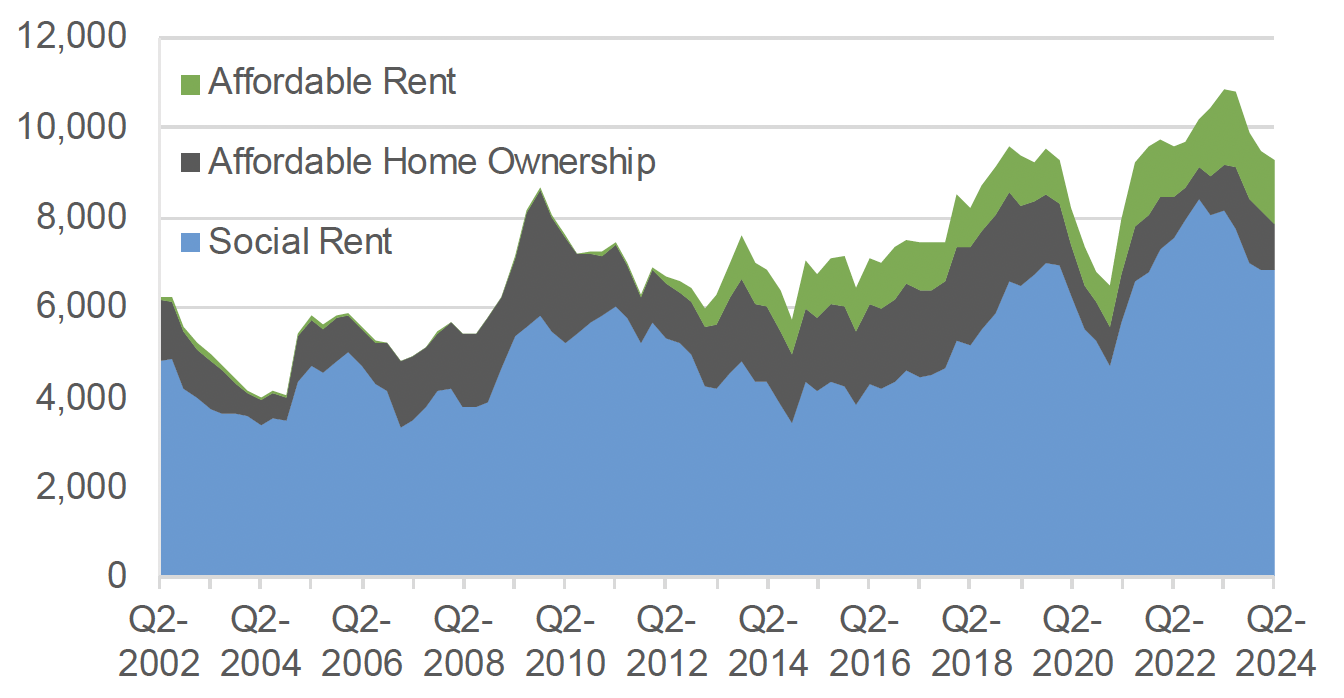
Chart 10.2 similarly shows that, following a substantial increase after covid restrictions were released, the number of affordable homes delivered has been falling in recent quarters: the 9,295 affordable housing completions recorded over the year to June 2024 represents a decline of 14% (1,556 homes) compared to a year earlier. Whilst starts have also decreased over the same period, (by 10% to 6,422 homes), approvals have risen by 15% (900 homes) to 6,966.

Source: Scottish Government
Contact
Email: jake.forsyth@gov.scot
There is a problem
Thanks for your feedback