Scottish Housing Market Review Q3 2024
Quarterly bulletin collating a range of previously published statistics on the latest trends in the Scottish housing market.
11. Lending to House Builders, Insolvencies and Construction Prices
11.1. Lending to House Builders
The annual change in the value of outstanding loans in August 2024 was 5.8% higher than in August 2023 and 10.4% higher than in August 2022. However, due to the high rate of CPI inflation between August 2022 and August 2024 (9.1%), in real-terms there was only a small increase in lending.
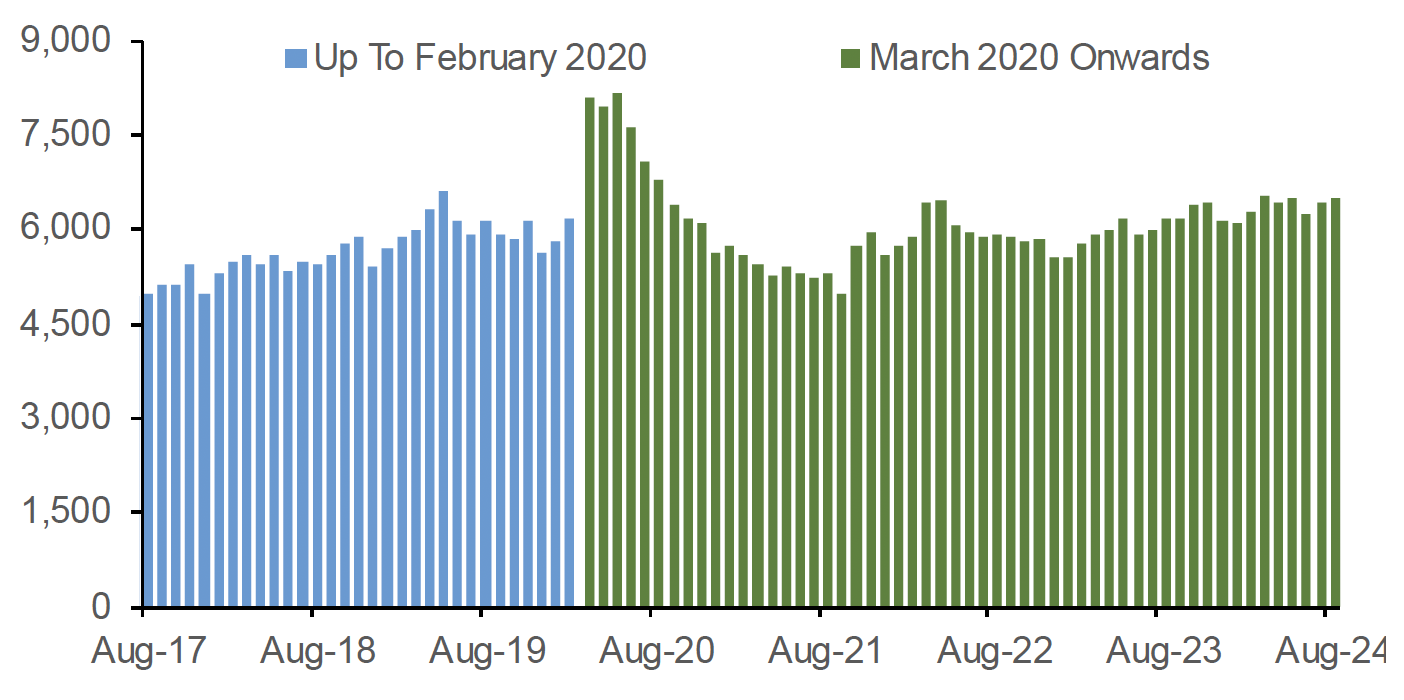
Source: Bank of England
11.2. Insolvencies
There are early signs of a possible downward trend in the number of construction companies entering insolvency that are registered in Scotland. This follows a period where insolvencies increased between Q1 2021 and Q3 2023, likely due in part to increases in new-build construction-output prices (as shown in Chart 11.1). The number of construction companies that went insolvent in the year to Q2 2024 totalled 201, a 6.5% decrease on the 215 recorded in the year to Q2 2023.
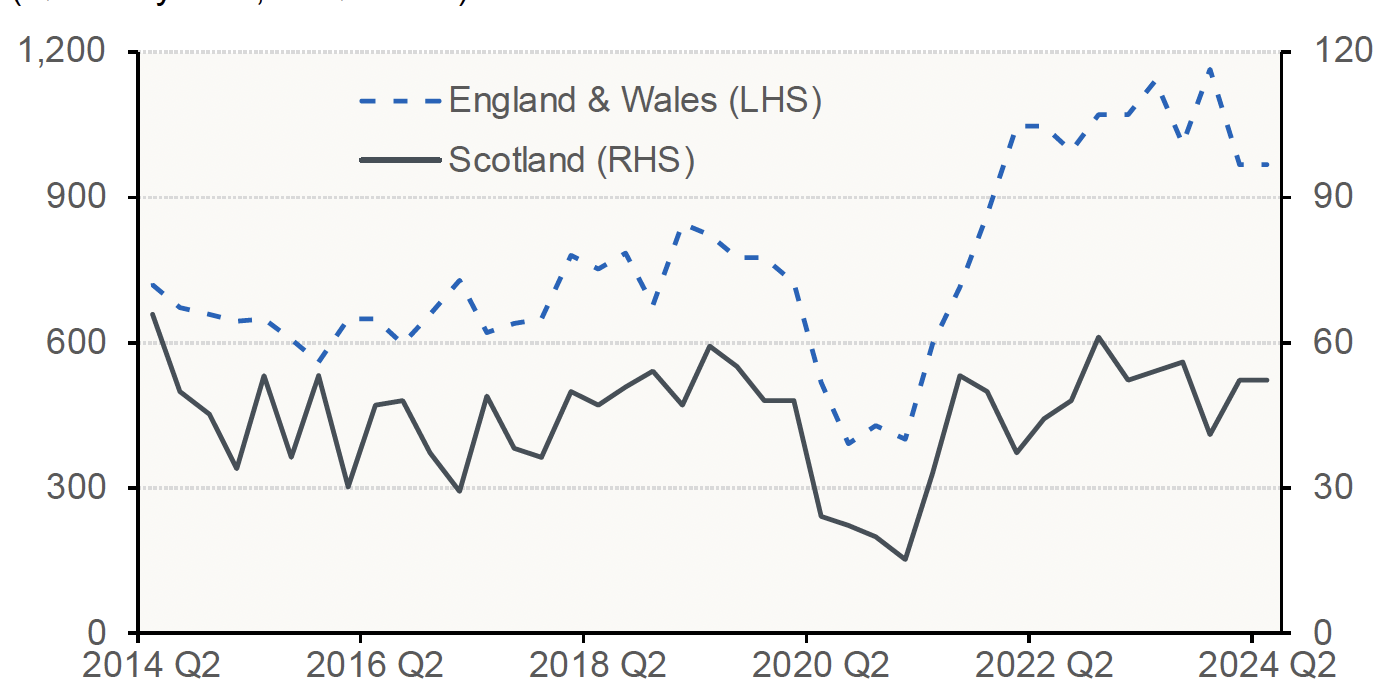
Source: The Insolvency Service
11.3. Output and Input Prices for New Housing
ONS construction-output price data shows that the index for new housing, which covers a range of costs associated with building new public and private housing (including materials, plant & labour, and profit mark-up), increased by an annual 3.4% in July 2024, falling from a peak of 12.2% in June 2022 (Chart 11.1).
Data from the UK Government (also illustrated in Chart 11.1) shows that the annual growth rate in the cost of construction materials used in new house building, which had reached as high as 24.0% in June 2022, and thus contributed significantly to output-price inflation for new housing, has fallen sharply to 0.2% in August 2024.
ONS average weekly earnings data show that annual growth in total pay in the construction sector has slowed consistently from its peak of 14.3% in the three months to June 2021, to stand at 1.8% in the three months to July 2024.
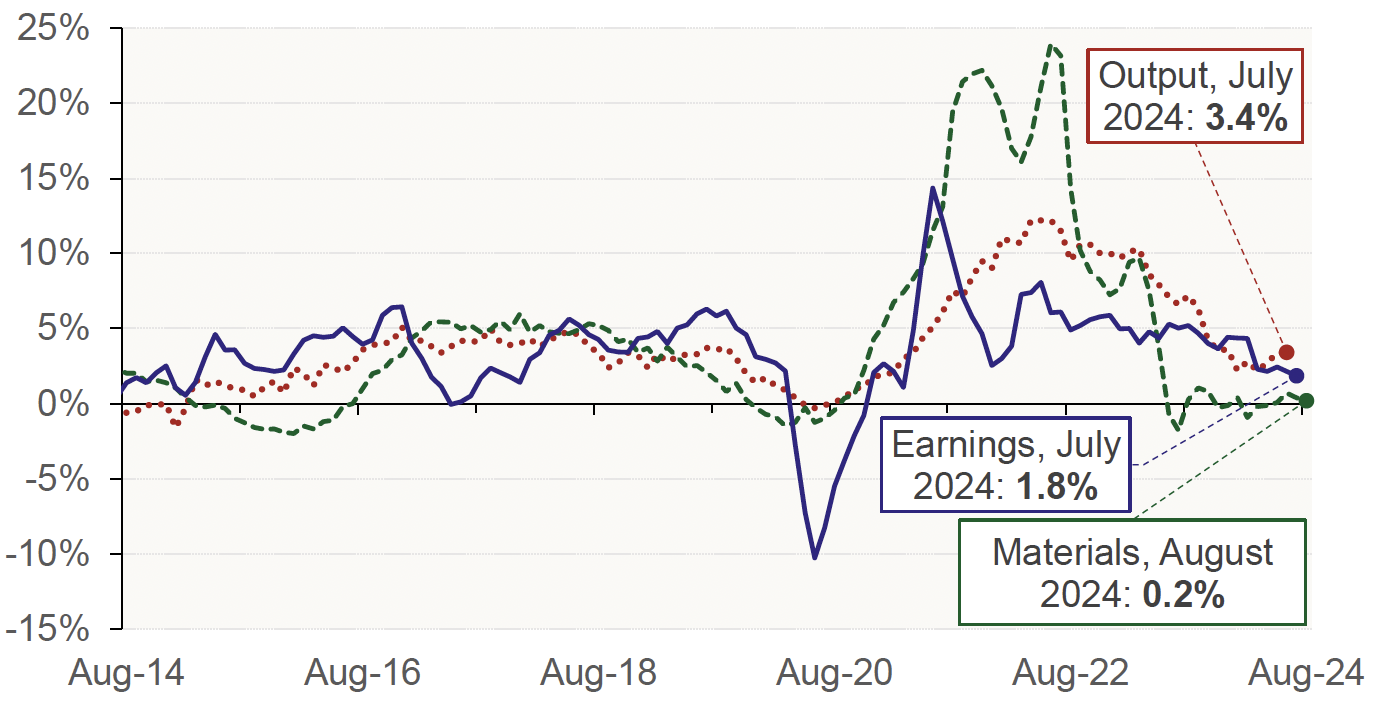
Source: ONS and UK Government
Contact
Email: jake.forsyth@gov.scot
There is a problem
Thanks for your feedback