Scottish Housing Market Review Q3 2024
Quarterly bulletin collating a range of previously published statistics on the latest trends in the Scottish housing market.
1. Sales
1.1. Scottish Sales Performance: National
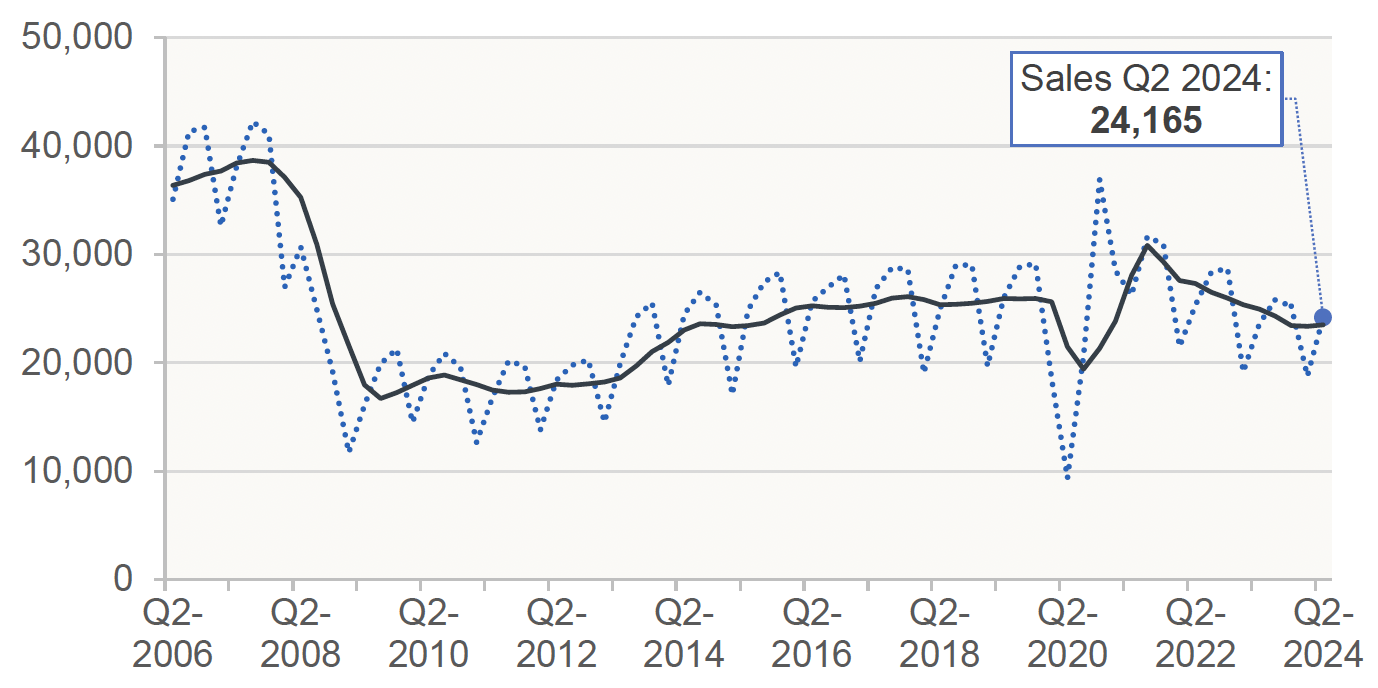
Source: Registers of Scotland
Chart 1.1 shows the volume of transactions for each quarter and the 4-quarter moving average which gives a better indication of the longer-term trend. The volume of transactions had been trending down, likely due to the impact of rising mortgage rates and the cost-of-living crisis, but there is now evidence that the fall in transactions has levelled off. Registers of Scotland statistics show that there were 24,165 residential property sales registered across Scotland in Q2 2024 – relative to Q2 2023 this was an increase of 2.4% (575), which was the first quarter the annual change in transactions has been positive since Q3 2021.
Chart 1.2, which uses Revenue Scotland data to plot the percentage difference between monthly residential LBTT returns over the period 2022 to 2024 relative to the corresponding month in 2019 (with 2019 chosen as the baseline to reflect pre-Covid market conditions), provides a more fine-grained picture of recent trends. While it can be seen that for much of 2022, transactions closely tracked their levels in 2019, the number of transactions since December 2022 has generally been lower than before the pandemic. While this remains the case for the year to date, with transactions in the nine months to September 2024 down by 4.6% relative to the corresponding period in 2019, transactions were, however, up by 4.9% relative to corresponding period in 2023, providing further evidence that market activity is stabilising.
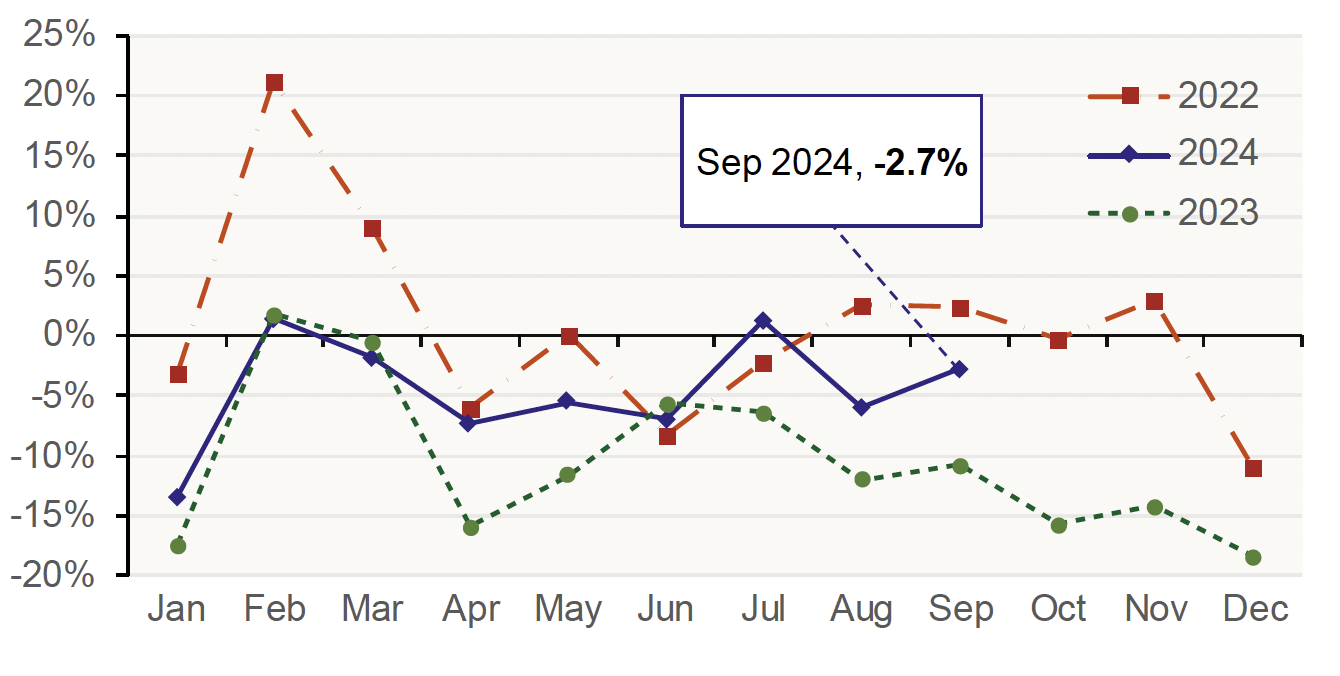
Source: Revenue Scotland
1.2. Scottish Sales Performance: Local Authorities
Table 1.1 sets out the level and annual change in quarterly transactions by local authority. The volume of transactions at local authority level can fluctuate significantly, particularly in smaller local authorities such as the island local authorities. To remove some of this volatility, the change in transactions in the last 4 quarters compared to the preceding 4 quarters is also presented.[1]
Focussing on the longer-term trend due to the volatility of quarterly data, Table 1.1 shows that housing market activity has declined in 30 out of the 32 local authorities in the four quarters to Q2 2024 compared to the previous four quarters. The local authorities that had the highest growth rates were the Orkney Islands (9.4%, 30 additional transactions) and West Dunbartonshire (2.1%, 27 additional transactions), while the Shetland Islands had the steepest fall at 16.8% (45 fewer transactions).
| Local Authority | Sales – Q2 2024 | Q2 2024 on Q2 2023 | 4 quarters to Q2 2024 on previous 4 quarters |
|---|---|---|---|
| Aberdeen City | 1,172 | 5.7% | -4.6% |
| Aberdeenshire | 976 | 5.2% | -9.6% |
| Angus | 477 | 1.1% | -11.4% |
| Argyll and Bute | 374 | -8.1% | -9.6% |
| City of Edinburgh | 2,791 | 9.5% | -3.4% |
| Clackmannanshire | 221 | 3.8% | -5.9% |
| Dumfries and Galloway | 592 | 12.8% | -0.6% |
| Dundee City | 678 | 8.3% | -8.3% |
| East Ayrshire | 531 | -0.4% | -5.3% |
| East Dunbartonshire | 433 | 6.4% | -4.9% |
| East Lothian | 548 | 0.4% | -9.1% |
| East Renfrewshire | 406 | -14.3% | -9.2% |
| Falkirk | 659 | -5.7% | -6.7% |
| Fife | 1,709 | 6.2% | -3.8% |
| Glasgow City | 2,620 | 2.5% | -8.2% |
| Highland | 956 | 0.1% | -7.2% |
| Inverclyde | 290 | 1.0% | -0.4% |
| Midlothian | 444 | 9.1% | -6.7% |
| Moray | 432 | 3.6% | -8.6% |
| Na h-Eileanan Siar | 84 | 6.3% | -2.3% |
| North Ayrshire | 584 | -10.0% | -2.1% |
| North Lanarkshire | 1,271 | -1.0% | -3.6% |
| Orkney Islands | 76 | 7.0% | 9.4% |
| Perth and Kinross | 754 | 4.4% | -8.3% |
| Renfrewshire | 871 | -1.6% | -5.3% |
| Scottish Borders | 448 | 0.4% | -3.6% |
| Shetland Islands | 60 | -15.5% | -16.2% |
| South Ayrshire | 533 | -10.3% | -1.9% |
| South Lanarkshire | 1,626 | 0.9% | -6.4% |
| Stirling | 363 | -9.3% | -13.5% |
| West Dunbartonshire | 334 | 8.4% | 2.1% |
| West Lothian | 851 | 13.6% | -4.7% |
| Scotland | 24,165 | 2.4% | -5.8% |
Source: Registers of Scotland
Contact
Email: jake.forsyth@gov.scot
There is a problem
Thanks for your feedback