Scottish Housing Market Review Q3 2024
Quarterly bulletin collating a range of previously published statistics on the latest trends in the Scottish housing market.
2. House Prices
2.1. Scottish House Price Performance: National
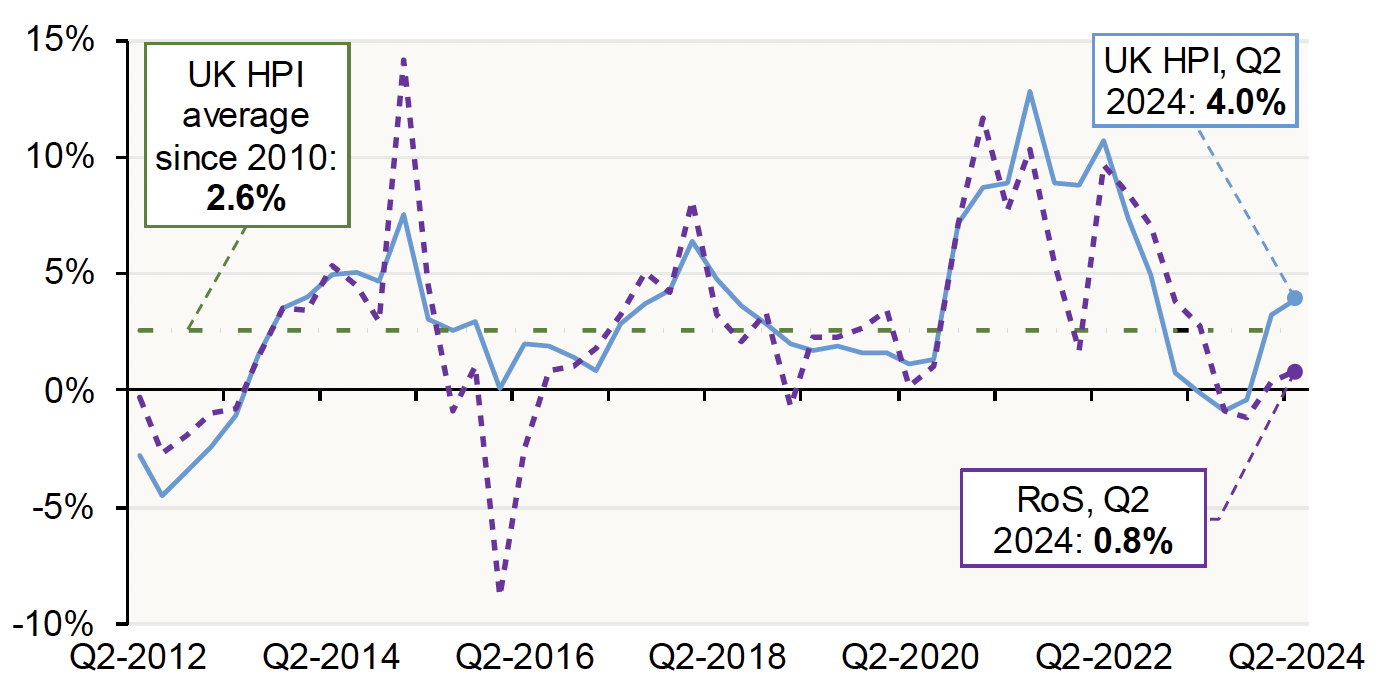
Source: Registers of Scotland, UK HPI. Please note that Registers of Scotland arithmetic mean price calculation is no longer limited to residential property sales between £20,000 and £1,000,000 and now includes all sales. This change in approach will have only a small impact because properties sold for less than £20,000 or more than £1,000,000 account for less than 1.1% of total residential sales
Average house prices in Scotland, as measured by the UK House Price Index (HPI), increased annually by 4.0% in Q2 2024. This is the highest growth rate since Q4 2022 and is also above the average growth recorded since 2010 (2.6%). The average property price (mix-adjusted, geometric mean) in Scotland stood at £192K in Q2 2024.
Registers of Scotland data shows that the average (arithmetic mean) house price in Scotland increased annually by 0.8% to £221K in Q2 2024. Registers of Scotland data is not mix-adjusted, so it will be affected by the composition of properties sold.
UK HPI data shows that annual house price growth in Q2 2024 was highest for semi-detached properties (5.7%), while flats increased the least (2.2%).
2.2. Scottish House Price Performance by Dwelling/Buyer Type
In previous editions of the Scottish Housing Market Review, we have included the UK HPI breakdown of new build and existing property price estimates in Scotland. The ONS has noted that due a fall in the proportion of transactions which are processed by HM Land Registry in time for their inclusion in initial HPI estimates, revisions have been larger than usual, and that this has affected new build price estimates in particular. Given that there have been significant and consistently downward revisions to new build price estimates for Scotland in recent months, we have decided on a temporary basis not to include a breakdown of new build and existing property prices until the data issues are resolved.
The UK HPI shows that the average price of a property bought by former owner occupiers in Scotland increased by an annual 4.5% in Q2 2024, to £231K. Meanwhile, the average price of a property purchased by a first-time buyer increased by an annual 3.7% in Q2 2024, to £154K.
2.3. Scottish House Price Performance: Local Authorities
Table 2.1 sets out the level and annual change in quarterly house prices by local authority. The small number of sales in some local authorities, such as the island local authorities, can lead to some volatility in estimated house prices despite the HPI methodology adjusting for the mix of houses sold; therefore, the change in average house prices in the last 4 quarters compared to the preceding 4 quarters is also presented. [2]
Focussing on the longer-term trend due to the volatility of quarterly data, Table 2.1 shows that 23 of the 32 local authorities saw an increase in their average house price in the four quarters to Q2 2024 relative to the previous four quarters. The rate of change was highest in Na h-Eileanan Siar (5.8%), while the largest decreases where in Orkney Islands (-3.5%), Shetland Islands (-3.1%), and Argyll & Bute (‑2.4%).
| Local Authority | Prices – Q2 2024 | Q2 2024 on Q2 2023 | 4 quarters to Q2 2024 on previous 4 quarters |
|---|---|---|---|
| Aberdeen City | £132,609 | -0.1% | -2.0% |
| Aberdeenshire | £201,996 | 0.8% | -1.5% |
| Angus | £169,426 | 5.5% | 0.4% |
| Argyll & Bute | £185,369 | 2.3% | -2.3% |
| Clackmannanshire | £169,611 | 7.9% | 4.2% |
| Dumfries & Galloway | £161,532 | 0.5% | -1.0% |
| Dundee City | £142,856 | 2.9% | 1.1% |
| East Ayrshire | £127,356 | 4.5% | -0.6% |
| East Dunbartonshire | £259,894 | 1.5% | 1.2% |
| East Lothian | £295,315 | 0.8% | 2.1% |
| East Renfrewshire | £286,088 | -0.7% | 0.0% |
| Edinburgh, City of | £325,435 | 4.9% | 0.9% |
| Falkirk | £165,521 | 5.0% | 2.3% |
| Fife | £171,332 | 1.5% | 0.9% |
| Glasgow City | £177,427 | 6.3% | 3.4% |
| Highland | £205,892 | 1.3% | 0.3% |
| Inverclyde | £125,509 | 5.3% | 4.3% |
| Midlothian | £237,304 | 4.9% | 2.5% |
| Moray | £200,185 | 5.8% | 2.3% |
| Na h-Eileanan Siar | £144,259 | -0.8% | 5.5% |
| North Ayrshire | £130,646 | 4.6% | -0.2% |
| North Lanarkshire | £142,112 | 6.6% | 2.3% |
| Orkney Islands | £215,079 | 6.4% | -3.2% |
| Perth & Kinross | £237,101 | 0.6% | -0.7% |
| Renfrewshire | £160,489 | 5.6% | 2.2% |
| Scottish Borders | £200,176 | 2.3% | -0.5% |
| Shetland Islands | £205,979 | 11.3% | -3.4% |
| South Ayrshire | £169,179 | 4.1% | 0.6% |
| South Lanarkshire | £166,852 | 4.1% | 1.5% |
| Stirling | £252,726 | 8.8% | 2.8% |
| West Dunbartonshire | £138,487 | 10.6% | 3.0% |
| West Lothian | £212,332 | 5.0% | 0.2% |
| Scotland | £191,947 | 4.0% | 1.5% |
Source: UK HPI. See footnote 2 for an explanation of time periods involved.
Contact
Email: jake.forsyth@gov.scot
There is a problem
Thanks for your feedback