Scottish Housing Market Review Q3 2024
Quarterly bulletin collating a range of previously published statistics on the latest trends in the Scottish housing market.
6. Mortgage Interest Rates
After a tightening cycle which took Bank Rate from 0.1% prior to the December 2021 Monetary Policy Committee (MPC) meeting to 5.25% following the August 2023 MPC meeting, its highest level since 2008, the MPC held Bank Rate steady for the following 12 months before cutting it to 5% in August 2024. At the most recent MPC meeting in September the MPC held Bank Rate steady at 5%.
Chart 6.1 and Chart 6.2 show data on the effective (or average) interest rates on outstanding mortgage balances and new mortgage advances. (Source: Bank of England). The recent cut in Bank Rate has begun to feed through to floating rates, with the effective rate on outstanding floating-rate mortgages falling from a peak of 6.90% at the end of October 2023 to 6.71% at end of August 2024, while the effective rate on new floating-rate mortgages has fallen from a peak of 5.98% at the end of May 2024 to 5.83% at the end of August 2024. In contrast, the effective rate on new fixed-rate mortgages, which had fallen from a peak of 5.28% at the end of November 2023 to 4.62% at the end of March 2023, increased slightly to 4.76% at end of August 2024.
The effective rate on outstanding fixed-rate mortgages continues to trend up gradually as mortgage terms reach their end of life, reaching 3.35% at the end of August 2024. This is due to the most common fixes being two and five years, which means that a significant proportion of fixed-rate mortgages have either not reached their end of term since the upward cycle in Bank rate began, or have been refinanced before rates had peaked. Since the vast majority of borrowers are on fixed-rate mortgages (see Chart 6.4), the effective rate on all outstanding mortgages is only somewhat higher, at 3.73% at end of August 2024.
Effective monthly interest rates on mortgage lending to households: UK (Data as at month-end, to August 2024)
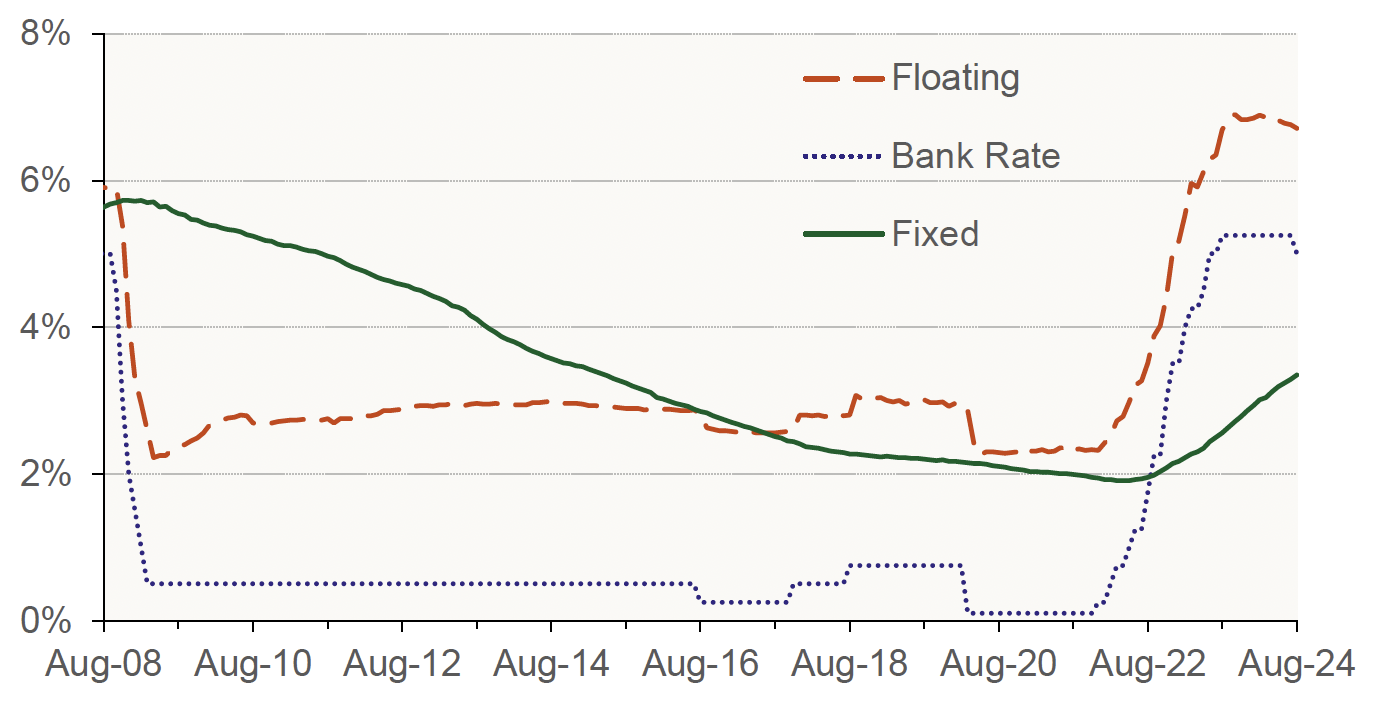
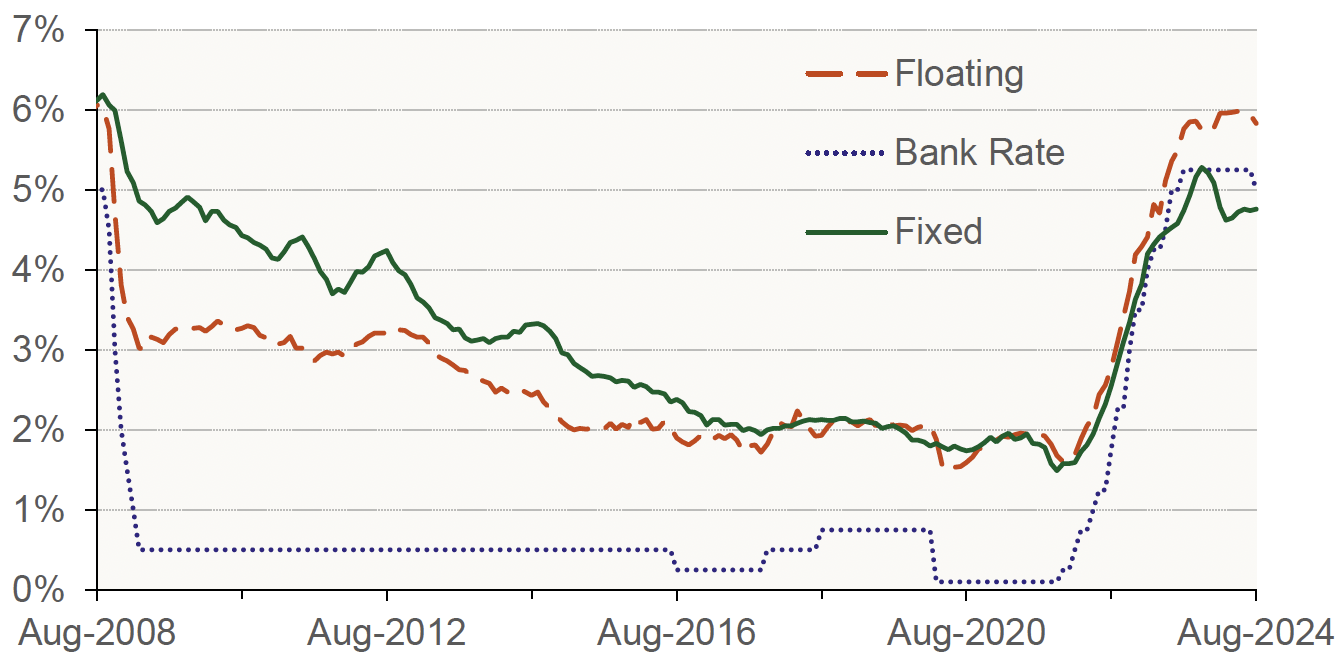
Source: Bank of England
Bank of England data on advertised mortgage rates (as opposed to data in Chart 6.1 which is based on interest actually paid) suggests that the recent cut has been feeding into advertised fixed rates, with Chart 6.3 showing that average advertised two-year fixed rate has fallen over the month of August for both 90% LTV and 75% LTV mortgages. The spread on rates for the different LTV levels, which was elevated during the Covid pandemic, peaking in December 2020 and then again in April 2021 at 189 basis points, has been small since then and has become even more compressed recently.
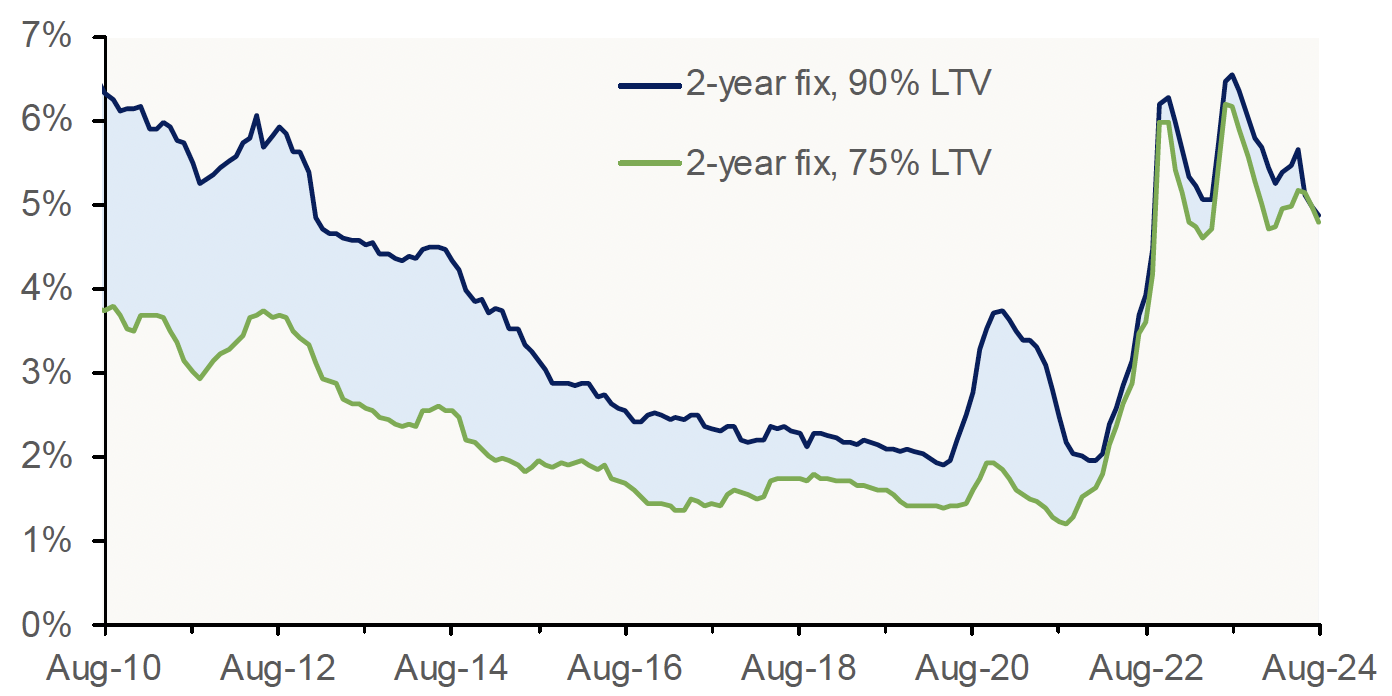
Source: Bank of England
More recent data from the Moneyfacts Treasury Report[3] provides more evidence that the reduction in Base Rate at the start of August 2024 is feeding into fixed rates on new mortgages. The average 2-year fixed-rate mortgage has fallen from 5.77% on 1 August 2024 to 5.40% on 1 October 2024, which is significantly less than a year before when the average rate stood at 6.47%. The average 5-year fixed rate mortgage has fallen from 5.38% on 1 August 2024 to 5.07% on 1 October 2024, an even more marked difference from a year earlier when it was 5.97%.
Chart 6.4 shows that the vast majority of regulated[4] mortgages are on fixed rates. However, following a period of sustained increase, there was a sharp drop in the share of new mortgages on fixed rates in Q1 2023, to 83.1% from 94.5% the previous quarter. It is possible that the spike in advertised mortgage rates towards the end of 2022 following the UK Government mini-budget in September 2022 led to an increased share of customers choosing a variable-rate mortgage in the hope that mortgage rates would fall once the mortgage-market volatility subsided.
More recently, there has been an increase over the quarter in the share of new lending at fixed rates from 87% to 93% in Q2 2024. Meanwhile, the corresponding figures for non-regulated[5] mortgages was 86% for gross lending and 79% for outstanding balances (Source: FCA).
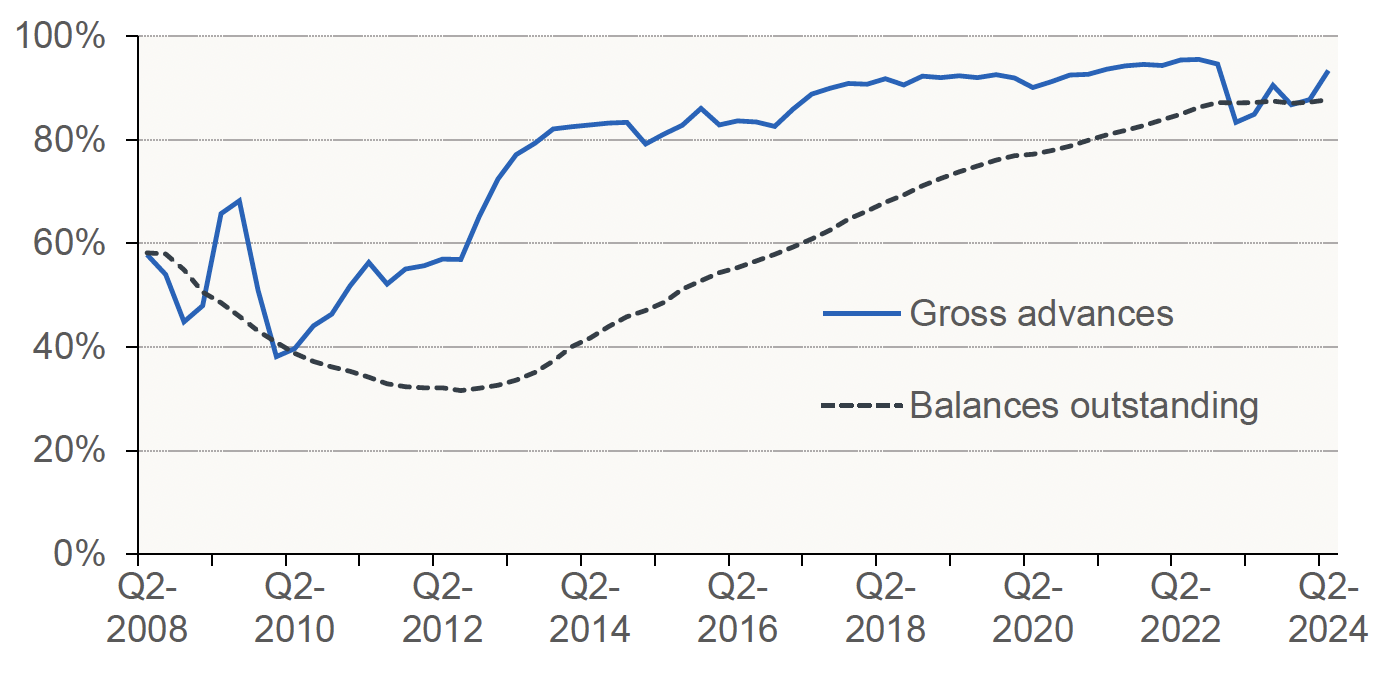
Source: FCA
Contact
Email: jake.forsyth@gov.scot
There is a problem
Thanks for your feedback