Scottish Housing Market Review – Q4 2021
Scottish housing market bulletins collating a range of statistics on house prices, housing market activity, cost and availability of finance and repossessions.
House Prices
National
Source: Registers of Scotland / UK HPI
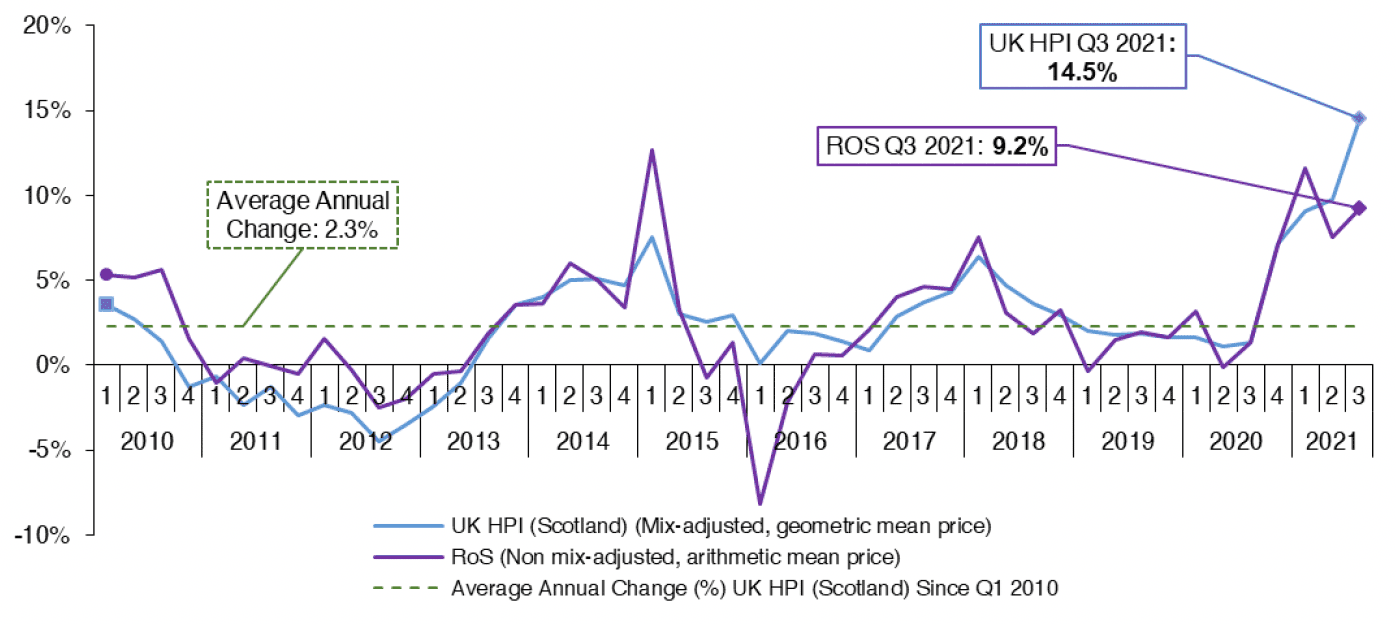
Scottish House Price Performance: National
House price inflation in Scotland, as measured by UK HPI, increased in Q3 2021 by 14.5% relative to Q3 2020. This is the highest quarter of house price inflation since Q1 2008, prior to the financial crisis. The average property price in Scotland stood at £179k in Q3 2021. More recent data shows that while annual house price inflation has eased somewhat from the 16.9% recorded in August 2021, it remains elevated at 11.3% in October.
Data from Registers of Scotland shows a slightly lower increase in annual house price inflation in Q3 2021, of 9.2%. However, this data is not mix-adjusted, so could be affected by the composition of properties sold. This is supported by looking at the number of transactions in greater detail, with transactions for flats increasing to a greater extent than other property types.
Annual price growth to Q3 2021 was highest for detached properties (18.1%). Flats increased by the lowest amount, increasing by an annual 10.8%, as measured by the UK HPI.
Scottish House Price Performance by Dwelling/Buyer Type
Chart 2.2 shows the rate of change in the average new and existing build property price in Scotland. This data is published with a lag relative to the headline HPI. In Q2 2021, the average Scottish new build property price increased to a greater extent than the existing build price, rising by 13.8% to £246K. The average existing build price rose by 9.3% to £164K.
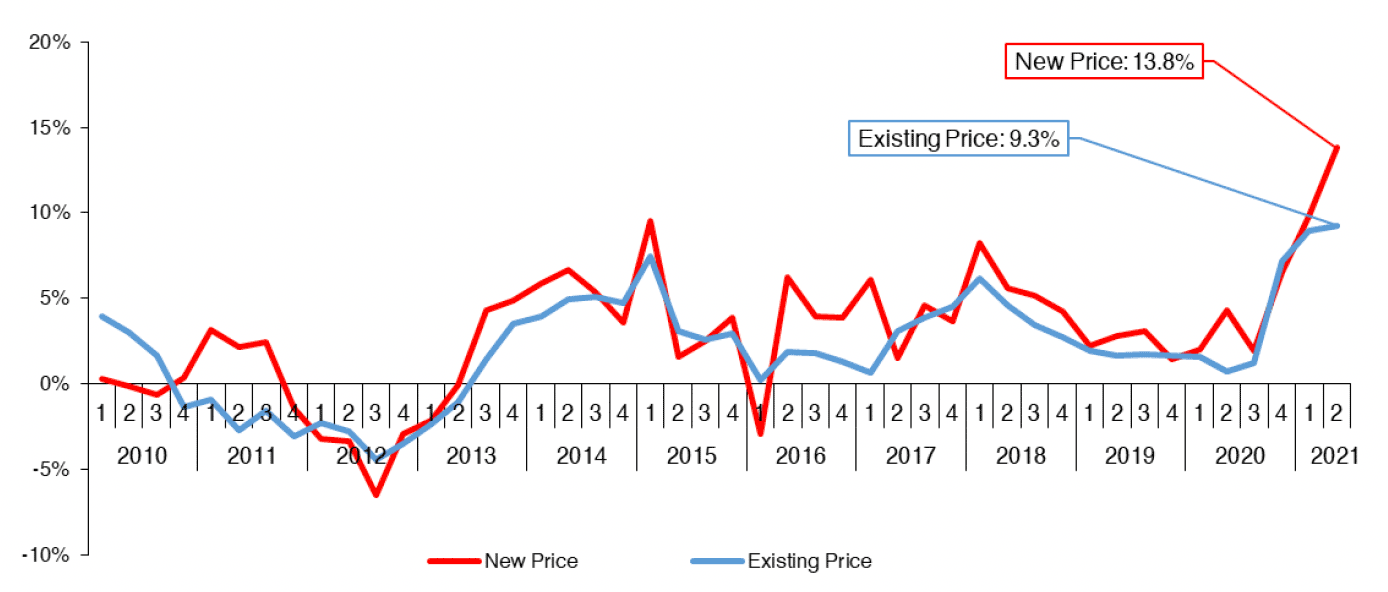
Source: UK HPI (Scotland)
The UK HPI also shows that the average price of a property bought by former owner occupier in Scotland increased by an annual 15.4% in Q3 2021, to £217K. Meanwhile, the average price of a property purchased by a first-time buyer increased by an annual 13.6% in Q3 2021, to £144K.
Scottish House Price Performance: Regional
Registers of Scotland data show that house prices rose strongly across Scotland in Q3 2021. The largest increase was in the Ayrshires and Dumfries & Galloway, where house prices increased 12.2% annually to 159K (average arithmetic mean price; prices not mix-adjusted). The smallest increase was in the Forth Valley, which increased by 5.1% annually to £183K. Over the five year period to Q3 2021, the annualised house price inflation rate in Aberdeen/shire & Moray was 1.2%, relative to 3.8% across Scotland. This can in part be explained by lower oil prices, which have led to a decline in the oil industry, a crucial component of the Aberdeen economy, and therefore, the regional housing market. There was a further sharp fall in oil prices due to the initial impact of Covid-19 on the world economy during Q1 2020, although they have now recovered to pre-Covid levels.
The longer-term trend (as measured by the change in house prices over the 4 quarter period to Q3 2021 over the previous four-quarter period) shows that house price growth has been positive in all areas of Scotland. The strongest price growth was again seen in the Ayrshires and Dumfries & Galloway, where house prices increased by 13.2%, whilst the smallest increase in house prices was seen in Aberdeen/shire and Moray, where house prices increased by 5.8%.
A summary of the average house price in Q3 2021 by Scottish region is included below. This also includes the annual change in the average house price in Q3 2021, as well as the annual change in the average house price using a rolling four quarter period to Q3 2021, which smooths out volatility in quarterly data (Source: RoS).
| Average Price – Q3 2021 | 12 Month Change | Annual change (rolling 4 quarters) | |
|---|---|---|---|
| Aberdeen/shire & Moray | £210K | 10.6% | 5.8% |
| Argyll & Bute, Highland & Islands | £197K | 7.3% | 7.6% |
| Ayrshires, Dumfries & Galloway | £159K | 12.2% | 13.2% |
| Clyde Valley | £184K | 9.2% | 7.6% |
| Edinburgh, Lothians & Borders | £273K | 8.7% | 8.3% |
| Forth Valley | £183K | 5.1% | 8.8% |
| Tayside & Fife | £192K | 9.8% | 9.5% |
| Scotland | £204K | 9.2% | 8.5% |
Source: Registers of Scotland
Contact
Email: William.Ellison@gov.scot
There is a problem
Thanks for your feedback