Scottish Income Tax 2025 to 2026: factsheet
A factsheet on the changes made to Scottish Income Tax for 2025-26.
Income Tax Policy Proposal: Scottish Budget 2025-26
- The Starter rate band will increase by 22.6% and the Basic rate band will increase by 6.6%. This will increase the thresholds for paying both the Basic and Intermediate rate of tax by 3.5%.
- This increase is significantly above inflation, which is 1.7%, based on the Consumer Price Index from September 2024.
- The Higher, Advanced and Top rate thresholds will be frozen at their current levels in cash terms to the end of this Parliament (2026-27).
- The UK Government confirmed in the 2024 Autumn Statement that the UK-wide Personal Allowance will remain frozen at £12,570.
- The Scottish Fiscal Commission (SFC) has forecast that Income Tax will raise just under £20.5 billion in 2025-26 in Scotland.
The tax rates you pay in each band if you have a standard Personal Allowance of £12,570 are shown in Table 1.[1]
2024-25 |
2025-26 |
|||
|---|---|---|---|---|
Band |
Rate |
Band |
Rate |
|
Starter |
£12,571* - £14,876 |
19% |
£12,571*- £15,397 |
19% |
Basic |
£14,877 - £26,561 |
20% |
£15,398 - £27,491 |
20% |
Intermediate |
£26,562 - £43,662 |
21% |
£27,492 - £43,662 |
21% |
Higher |
£43,663 - £75,000 |
42% |
£43,663 - £75,000 |
42% |
Advanced |
£75,001 - £125,140** |
45% |
£75,001 - £125,140** |
45% |
Top |
Over £125,140 |
48% |
Over £125,140 |
48% |
*Assumes individuals are in receipt of the standard Personal Allowance.
**Those earning more than £100,000 will see their Personal Allowance reduced by £1 for every £2 earned over £100,000.

Impact on individual taxpayers of changes to Scottish Income Tax
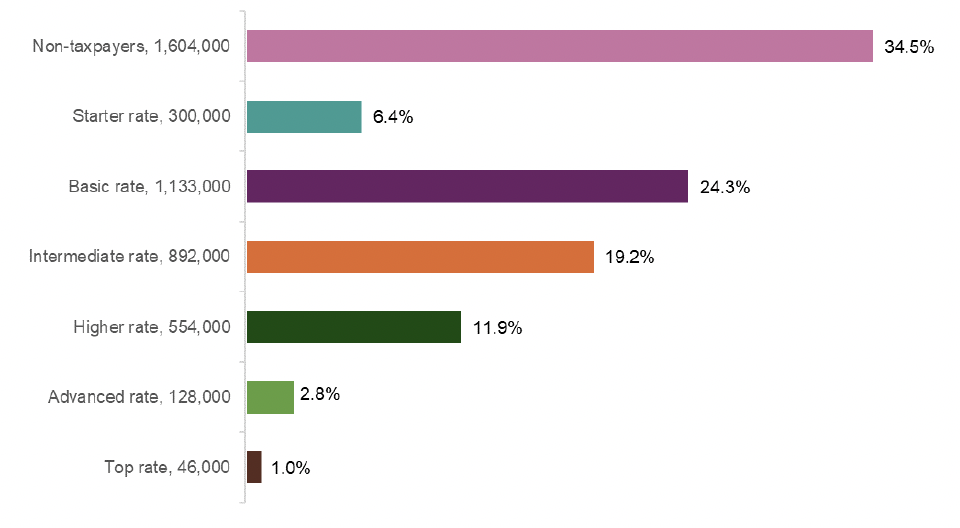
- It is estimated over 34% of Scottish adults (over 1.6 million out of 4.65 million adults) are not affected by the 2025-26 policy changes as their income is below the UK-wide Personal Allowance of £12,570.
- Those earning less than around £30,300 – which is around 51% of Scottish taxpayers – will continue to pay slightly less Income Tax in 2025-26 than if they lived elsewhere in the UK.
- No taxpayer will pay more Scottish Income Tax in 2025-26 than they did in 2024-25 on their current income.
The impact of Income Tax policy in 2025-26 on different taxpayers can be considered by comparing take home pay in 2025-26 to a scenario where all tax bands are increased in line with inflation, which is the SFC’s baseline assumption.
This is illustrated in the table below alongside a comparison of take-home pay resulting from Scottish Income Tax policy compared to the rest of the UK in 2025-26. For a given income, the table below shows:
- The impact of Income Tax policy in 2025-25 relative to the SFC baseline, (assumed inflationary increase to all bands).
- The impact of Income Tax policy in 2025-26 compared to Income Tax policy in 2024-25.
- The impact of Scottish Income Tax policy in 2025-26 compared to Income Tax policy in the rest of the UK.
For example, in 2025-26 taxpayers earning the median income of £29,800 will be £5 better off than if they lived elsewhere in the UK and £15 better off in 2025-26 than they were in 2024-25. They will also be £12 better off than if all Income Tax bands had increased by inflation.
Example Income of Scottish taxpayers in 2025-26 |
Impact on take home pay (2025-26) |
||
|---|---|---|---|
Policy impact relative to SFC baseline |
Position relative to tax paid in 2024-25 |
Position relative to the rest of the UK in 2025-26 |
|
£15,000 |
£1 |
£1 |
£24 |
£20,000 |
£5 |
£5 |
£28 |
£20,400 (25th percentile) |
£5 |
£5 |
£28 |
£24,242 (Real Living Wage) |
£5 |
£5 |
£28 |
£29,800 (Median Income) |
£12 |
£15 |
£5 |
£35,000 |
£12 |
£15 |
-£47 |
£40,000 |
£12 |
£15 |
-£97 |
£44,500 (75th percentile) |
-£98 |
£15 |
-£318 |
£45,000 |
-£98 |
£15 |
-£428 |
£50,000 |
-£98 |
£15 |
-£1,528 |
£60,000 |
-£98 |
£15 |
-£1,782 |
£70,000 |
-£98 |
£15 |
-£1,982 |
£80,000 |
-£136 |
£15 |
-£2,332 |
£90,000 |
-£136 |
£15 |
-£2,832 |
£100,000 |
-£136 |
£15 |
-£3,332 |
£130,000 |
-£199 |
£15 |
-£5,363 |
£800,000 |
-£199 |
£15 |
-£25,463 |
Impact of Income Tax changes on Scottish households
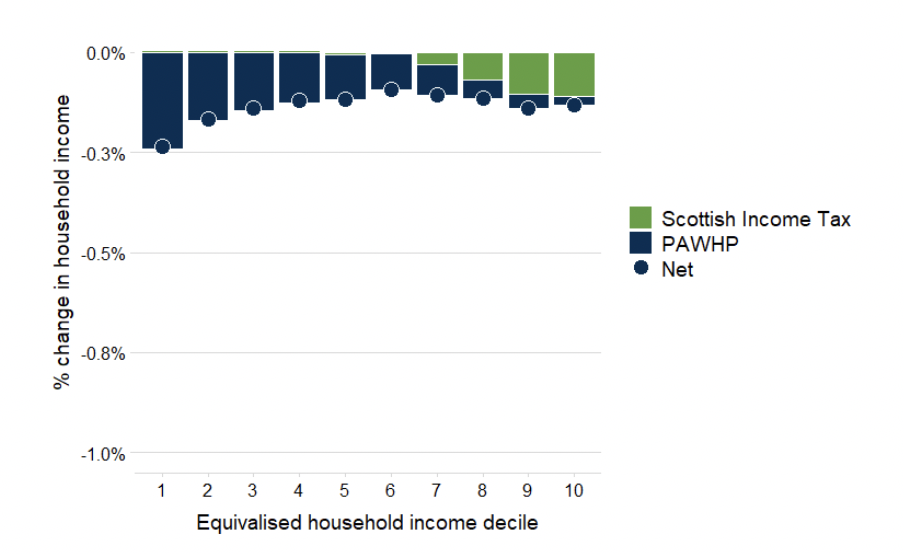
- Increases to the Basic and Intermediate rate thresholds have a small positive impact in the bottom half of the income distribution. The negative impact of frozen thresholds principally falls on the highest earning 20% of households, with the top 10% paying an average of 0.1% of their income (around £130) more.
- Scottish Income Tax changes – Increases to the Basic and Intermediate rate threshold, while freezing the Higher, Advanced and Top rate thresholds, mean that almost half (47%) of Scottish households are better off, with over three-quarters (76%) of households either better off or unaffected as a result.
- Overall, around 62% of households in Scotland are better off or unaffected under the Scottish tax and social security system compared to the rest of the UK.

Source: OCEA analysis using UKMOD
International Comparison of Scottish Income Tax
- The below figure sets out an international comparison of estimated Income Tax and social security contributions (NICs) as a share of gross income and social security across the household income distribution in Scotland, England and across other EU countries[3][4].
- The Scottish Income Tax system is progressive. Personal tax as a proportion of income is generally lower than the EU median across household deciles, with households around the median income paying less tax than the average household across EU countries.
- The average proportion of tax paid by households at the top and bottom of the distribution is estimated to be more similar to that seen in other EU countries.
- Household comparisons between Scotland and England will reflect differences in tax policy, but also differences in the distribution of household income.
Equivalised income decile |
Lowest decile |
Median |
Highest decile |
|---|---|---|---|
Scotland |
9% |
14% |
35% |
England |
11% |
15% |
35% |
All EU countries |
8% |
18% |
32% |
Western EU and Nordic countries |
9% |
19% |
35% |
Benelux and Nordic countries |
9% |
23% |
37% |
Analysis with UKMOD and EUROMOD figures
Contact
Email: Lorraine.King@gov.scot
There is a problem
Thanks for your feedback