Scottish Islands Survey 2023: main findings report
This report summarises key findings of the Scottish Islands Survey (2023), which gathered views about different aspects of island life from Scottish island residents. The results will contribute to measuring progress towards the objectives set out in the National Islands Plan (2019).
2. Methodology
Building on the approach taken in the National Islands Plan Survey (2020), the questionnaire data analysis and sampling approach aimed to:
- distribute the survey to the maximum number of islands possible, including islands with very small populations;
- maximise the representativeness of the sample population, based on the age, gender and geographical distribution of adult island residents; and
- support the production of representative statistics, which are more realistic as they account for variations in response rates by different population groups.
The survey was co-developed by the research team at the James Hutton Institute, the Scottish Government and the project’s Research Advisory Group.
2.1 The survey framework: subregions and sampling design
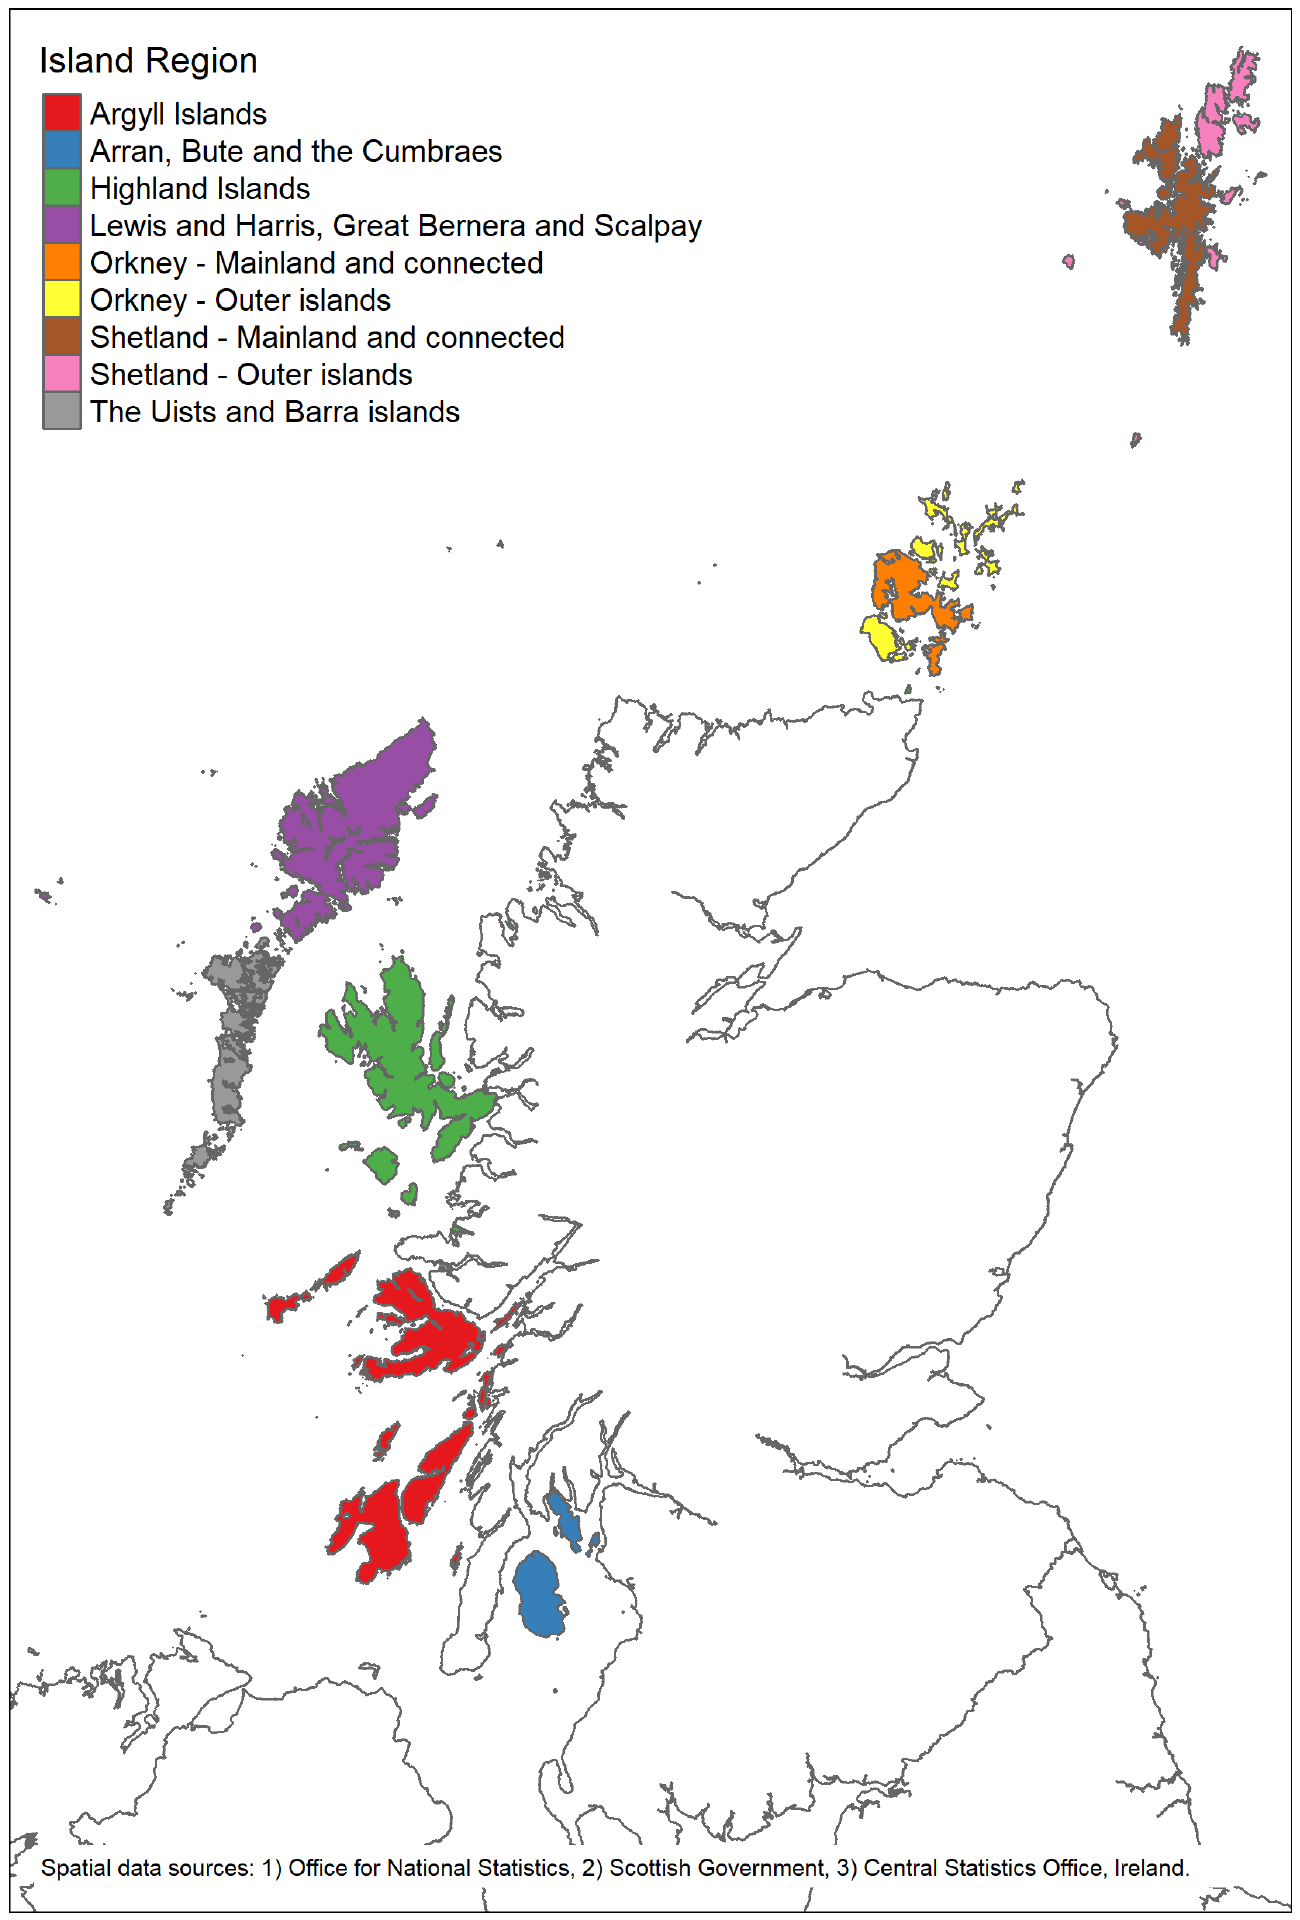
The survey used the Scottish Island Regions (2023) framework[7], first developed during the 2020 survey sampling and now adapted and implemented by the Scottish Government as an official geography for statistical reporting. The framework groups the islands into nine meaningful “island regions” to assess geographical differences in responses, and minimises the risk of identifying individuals or groups of people from published data. A map of the island regions is shown in Figure 1, and estimated adult populations of islands within these regions are given in Annex 2.
Target numbers of surveys for 72 cohorts of respondents – based on island region, sex, and age group – were calculated for a representative distribution of 20,000 surveys. Populated individual islands were identified within the island regions, partly using postcode locations and populations. Island postcodes were provided to Experian,[8] who returned 26,309 names and addresses of likely island residents who were adults (aged 18 and over). This represents an extension of the sample from the 2020 survey, which was based on residents aged 18–75.
A three-stage sample extraction process was used, based on the population characteristics of individual islands and the island regions as a whole. Firstly, to minimise the risk of having no responses from individual islands (to below 5%), islands where 37 or fewer names and addresses were available had all of these included in the sample (i.e. all were sent questionnaires); this threshold was based on statistical probabilities of receiving no responses from different populations. Secondly, random or full samples of the remaining names and addresses were extracted to achieve the target numbers in each of the 72 cohorts. Thirdly, target numbers at the island region level were considered, and random, full or zero samples were extracted based on these, with a small adjustment due to oversampling for some island regions. Characteristics of the sample are described below.
2.2 Survey questionnaire and survey mode
The survey was sent to 20,000 island residents on 14th November 2023. A paper questionnaire and reply-paid envelope was sent to every address. In addition, a QR code was included for those who wanted to complete the questionnaire on-line. Respondents could complete the survey by post, telephone or online, in English or Gaelic. The survey closed on 31st January 2024. No reminder was sent.
The survey asked about their perceptions of aspects of island life, including population levels, economic development, transport, housing, fuel poverty, digital connectivity, health and social care, environmental wellbeing, community empowerment, and culture and education. The 2023 questionnaire (Annex 3) contained 51 main questions asking for closed responses, plus a question inviting open comments. The survey only targeted island residents. The survey did not include visitors or users of holiday and second homes. The 2020 questionnaire has previously been published.[9] The Privacy Notice is contained in Annex 3 (pages 1–2) and the Data Protection Impact Assessment can be found online.[10] A summary of the question changes between the 2020 and 2023 surveys is published as Annex 4.
2.2 Survey response
4,358 people responded to the survey (4,034 by post, 323 online including nine in Gaelic, and one by phone), representing a 22% response rate (the same response rate as in 2020). Additionally, responses were received from 66 islands in 2023, an increase from 2020 (59 islands).
| Age group | Population (2021) | Sample | Survey respondents | Response rate (estimated) |
|---|---|---|---|---|
| 18-35 | 17,640 | 2,624 | 214 | 8% |
| 36-50 | 17,797 | 4,348 | 542 | 13% |
| 51-65 | 24,470 | 6,312 | 1,427 | 23% |
| 66 and over | 25,082 | 6,716 | 2,087 | 31% |
| Total | 84,989 | 20,000 | 4,270 | - |
Note: comparison of self-reported data within surveys and Experian sample data. Not all survey respondents provided their age.
| Population (2021) (data: sex) | Sample (data: gender) | Survey respondents (data: sex) | Response rate (estimated) | |
|---|---|---|---|---|
| Female | 43,254 | 10,248 | 2,371 | 23% |
| Male | 41,735 | 9,752 | 1,962 | 20% |
| Prefer not to say | - | - | 16 | - |
| Total | 84,989 | 20,000 | 4,349 | - |
Note: comparison of self-reported data within surveys and Experian sample data. Not all survey respondents provided their sex.
| Island region | Population (18 and over, 2021) | Sample | Survey respondents | Response rate |
|---|---|---|---|---|
| Argyll islands | 6,839 | 1,609 | 402 | 25% |
| Arran, Bute and the Cumbraes | 10,266 | 2,416 | 515 | 21% |
| Highland islands | 9,017 | 2,122 | 452 | 21% |
| Lewis and Harris, Great Bernera and Scalpay | 17,141 | 4,034 | 749 | 19% |
| Orkney – Mainland and connected[11] | 16,212 | 3,815 | 941 | 25% |
| Orkney – Outer islands | 2,324 | 547 | 149 | 27% |
| Shetland – Mainland and connected8 | 16,215 | 3,816 | 785 | 21% |
| Shetland – Outer islands | 2,101 | 494 | 150 | 30% |
| The Uists and Barra islands | 4,874 | 1,147 | 215 | 19% |
| Total | 84,989 | 20,000 | 4,358 | - |
2.3 Weighting of responses
Due to the above differences in response rates between different population groups (especially notable across different age groups), the demographic and geographical distribution of the survey respondents was different from that of the adult island population as a whole. Weights for individuals in each of the 72 cohorts (combinations of age group, gender and island region) were calculated based on these data, with characteristics of survey respondents identified from survey responses as far as possible (some Experian data were used to fill non-responses). Weighted percentages were calculated using coded responses (e.g. 1 if a certain response was given, 0 if another response was given) multiplied by the respective weights for individuals.
2.4 Analysis
This report is based on an analysis of 394 variables which were created from the responses to the 2023 Islands Survey. Three further variables: island region, age group and sex, were used to analyse these responses. Additionally, 117 out of the 394 variables were analysed to assess changes in perceptions between the 2020 and 2023 Islands Surveys. These variables were identified as comparable with counterparts in the earlier survey, based on a thorough review of survey questions and datasets. Some variables reflecting respondents’ characteristics and circumstances were not included in the 2020-2023 comparison: these included variables on employment status and household income, and some demographic characteristics which are covered in larger data collection exercises (e.g. Censuses).
All statistics given for all island respondents, and for the nine island regions, are weighted (as described in Section 2.3) with the exception of statistics on wellbeing scores and the duration of residence in islands. Comparisons by age group and sex are not weighted. As no questions were compulsory, some questions were conditional on the answers to others, and some invalid responses were removed during data cleaning, the number of valid responses received varied between questions.
Responses which are reported in the text reflect those available in the survey, except for some variables where “Yes” indicates that an option was selected, and “No” shows that this option was not chosen. For questions where people could respond “Agree” or “Strongly agree”, and “Disagree” or “Strongly disagree”, these were combined to “Agree” and “Disagree” categories, respectively, for the purposes of the analysis. For Gaelic surveys, the responses were converted into English.
All comparisons described in the text (between different age groups or between islands) are statistically significant at the 95% confidence level or above (i.e. p-values below 0.05), unless otherwise specified. This means that the likelihood of finding the same difference in the wider population (beyond the survey sample) is 95%. For the 2023 Survey analysis, comparisons by age groups, sex, and island regions did not use weighted values, but were based on cross-tables of response counts, following the removal of some responses (e.g. “Don’t know”, “Prefer not to say”, “Not applicable”), and used the Chi-square test and Fisher’s Exact test. Significant differences in wellbeing scores and the period of residence in islands were identified using the Kruskal-Wallis and Mann-Whitney U tests, again using the 95% confidence level. Lastly, 90 significant differences in responses between the 2020 and 2023 Surveys were identified from an analysis of 117 variables which were regarded as comparable in both years, and the proportions of selected responses (generally reflecting agreement, options being chosen, or relatively frequent use or visits) recorded in both years. These tests used unweighted percentages, but weighted percentages are given in this report for 2020 and 2023.
The term “significant” is used in this report to refer to statistical significance and is not intended to imply substantive importance.
The quotes that appear throughout the report come from responses to Section 15 (Additional Comments) of the survey, in which respondents were asked to add any comments about the survey, their local area or the National Islands Plan. Just under one third of respondents (1,027) added text to this section, ranging from a few words to several paragraphs. These comments were imported to qualitative data analysis software (NVivo 12) and coded according to the section of the report to which they relate. In selecting quotes for the report, we a) identified those that reflected or added context to the quantitative data analysis, and b) included quotes from a range of island regions, age groups and genders.
This report contains some comparisons from the Scottish Islands Survey (2023) with available national or regional statistics for the same time period. It places the findings for the Scottish Islands in the wider context of what is happening in Scotland as a whole. Comparable questions were not available for every question. However, some Scottish Islands Survey 2023 questions were the same or similar to questions in other surveys. The comparisons made are not statistical comparisons but simply for context. More detail is contained in an accompanying workbook (Annex 6).
2.5 Limitations
The survey received a high response rate with returned surveys from several smaller islands, although some limitations must be acknowledged. Older islanders were much more likely to complete the survey: just under half of all respondents were over 65 years old, with younger residents of working age under-represented in responses. Response weighting, which partly accounted for age group, was undertaken to address this, but this response bias is notable. Broader challenges of quantitative research in island areas should be recognised, including the limited availability of recent, granular population data for islands at the time of analysis; requiring estimates of island populations during the sampling process. The most recent population figures available during the sampling process were from the 2011 Population Census inhabited islands reports. National Records of Scotland published 2022 census population data for island groups in June 2024. These groups often contain just one island[12]. The 2022 Population Census inhabited islands report is due to publish in 2025.
Contact
Email: socialresearch@gov.scot
There is a problem
Thanks for your feedback