Scottish local government financial statistics 2017-2018
Annual publication providing a comprehensive overview of financial activity of Scottish local authorities based on authorities audited accounts.
Key Facts
How does local government spend its money?
Revenue expenditure consists of the day-to-day costs of running local authority services, such as paying salaries and bills.
This expenditure can be funded either by General Funding such as Council Tax or the General Revenue Grant, or Income to Services such as rent or specific grants.
Education and Social Work are the largest local government services, together accounting for more than half of gross revenue expenditure.

Where does the money come from?
The main source of revenue income for local government is the General Revenue Grant from the Scottish Government, worth £6.8bn.
Local Taxation (Council Tax and Non-Domestic Rates) contributed a further £4.9bn to the funding of local government in 2017-18
Service Income (e.g. fees and charges on services, rental income, other government grants) makes up the remaining £5.8bn.

Where is the money spent?
Most authorities spend a similar amount per head of population - only five authorities spend £250 more or less per head than the Scottish average.
The island authorities spend the greatest amount per head, with Shetland spending £3,936 per person in 2017/18 – more than double the Scottish average of £1,869. These authorities receive extra funding in recognition of the additional costs they face in providing services.

What savings do councils have?
If there is a difference between what councils spend and what they receive, the difference must be met from or contribute to reserves. In 2017-18, councils held reserves equal to an average of 9% of total annual expenditure, with values ranging between 3% and 15% for individual councils.
Orkney and Shetland have been excluded from this analysis, as both have large reserves relating to oil, gas and harbour related activities.

Is Local Government investing in infrastructure?
Spending which creates an asset to be used over several years (e.g. buildings or machinery) is known as capital expenditure.
Education capital expenditure increased to £898 million in 2017- 18, continuing an increasing trend in recent years. Education capital expenditure has increased 74% since 2012-13, and now makes up about a third of all capital expenditure.

How is capital expenditure funded?
Unlike revenue expenditure, local authorities can borrow to fund capital expenditure. Local authorities borrowed £1.0bn in 2017-18 to supplement £1.2bn which they received in Grants & Contributions.
"Other" capital expenditure financing has grown in recent years, largely due to an increase in infrastructure projects funded through the Non-Profit Distributing model.

Do councils have a lot of debt?
Local authorities can borrow to fund capital expenditure. Total debt increased by 4% from £16.8bn on the 31st March 2017 to £17.6bn on the 31st March 2018.
Of this, £14.0bn was in the General Fund and £3.6 billion was in the Housing Revenue Account – a separate account relating to local authority provision of housing.

What about debt for individual councils?
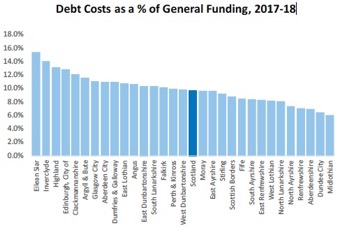
Local authority debt is repaid from future revenue budgets. Councils in Scotland spent an average of 10% of their General Funding on debt repayments in 2017-18, with values for individual authorities ranging between 6% and 15%.
Orkney and Shetland have been excluded from this analysis, as they have large levels of investment income.

Where can I find out more?
| What are you looking for? | Where is it? |
|---|---|
| A longer summary | Main publication |
| The full publication tables | Excel tables |
| Other publications about Local Government Finance | Local Government Finance Statistics |
https://www.gov.scot/Topics/Statistics/Browse/Local-Government-Finance
Source: Scottish Local Government Finance Statistics, 2017-18 (published February 2019)
There is a problem
Thanks for your feedback