Atlantic salmon - determining run timing proportions: report
Recently, a number of genetic markers associated with run timing was published. This Scottish Marine and Freshwater Science report describes the development and calibration of a panel of twelve of these markers into a tool that could be used to determine run timing proportions in Scottish Atlantic salmon populations.
Comparative analysis
For each test fish, the probability of running early was plotted against Julian return day. Figure 2 shows the probability of being an early running fish for the original (Paper9 - light) and the new twelve SNP (Flex12 - dark) panel. It can be seen that the relationships are similar, in that the probability of being an early running fish is high when actual Julian return day is low and reduces as return day increases, as would be expected and as was seen in the validation analysis of Cauwelier et al. (2018).
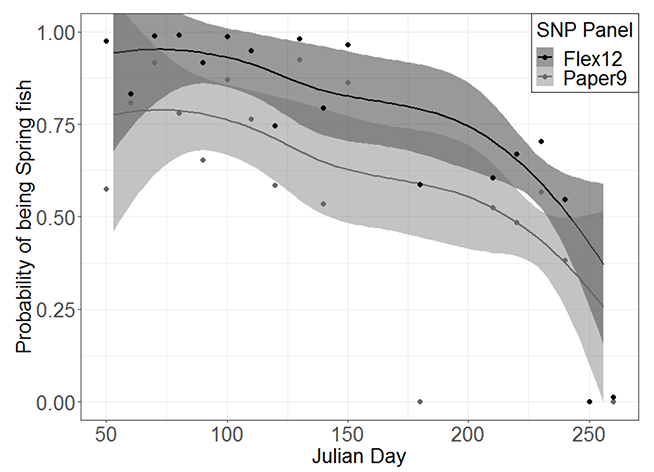
Figure 1. Probability of being an early running fish for the test fish using the original SNP markers from Cauwelier et al. (2018) (Paper9 - light) and the new twelve SNP panel (Flex12 - dark). Lines represent the fitted linear model, with 95% confidence intervals as shaded bands around these, and points represent mean probabilities for each 10 Julian return days.
Although the shape of the relationships between Julian day and the probability of being an early running fish are similar in the two SNP panels, the strength of the relationship (as reflected on the Y axis) is seen to be higher in the 12 SNP panel. To test these differences, comparisons of assignment probabilities between the top twelve SNPs described here and the original panel reported in Cauwelier et al. (2018) were made by testing the differences of the slopes and intercepts of general linear models (GLM’s) fitted to the different SNP panel results in the form:
ANOVA was then used to examine differences in model slopes and there was found to be no significant difference in the slopes of the two relationships (p = 0.858).
To examine the intercepts, another model was fitted, this time including SNP panel as one of the explanatory variables:
In this case, there was a significant difference in intercepts between the two panels (p < 0.0001), with the intercept being 0.991 and 1.175 for the original and twelve SNP panels, respectively.
The absolute relationship between Julian day and return timing is thus seen to remain constant with the two SNP panels, but the probabilities using the twelve SNP panel are higher across all return times than the original panel from Cauwelier et al. (2018).
Contact
Email: Eef.Cauwelier@gov.scot
There is a problem
Thanks for your feedback