Juvenile Atlantic salmon - mapping the early running component: report

This Scottish Marine and Freshwater Science report describes the application of a genetic tool to estimate the early running component of juvenile Atlantic salmon. The proportions were mapped to visualise within and between-river patterns. These maps can be used to inform and help river managers achieve their conservation aims.


Results

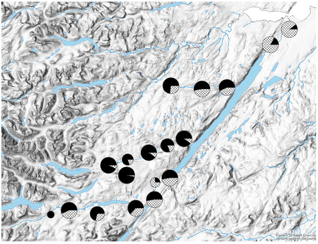
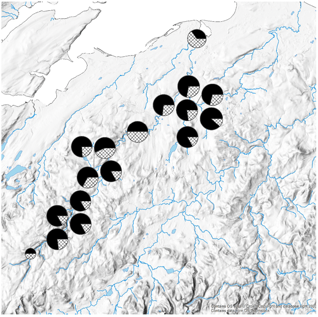
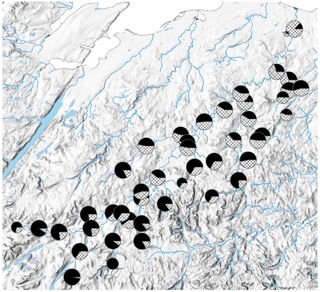
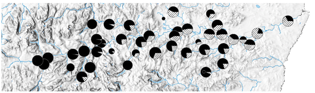
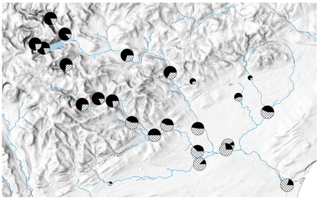
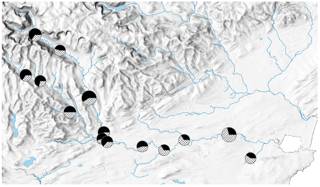
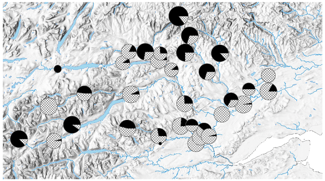
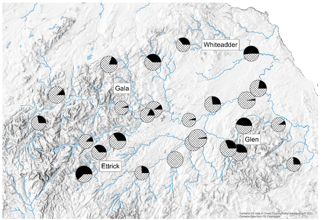
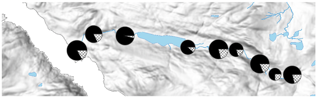
Of the 6,183 juveniles sampled and screened, 209 (3.4%) failed QC, resulting in a final dataset of 5,974 juveniles. Figures 2 – 10 show, per river, the proportion of early and later running components for each site, based on the cut off value.

Figure 2. Pie charts showing early (filled portion) and later (dashed portion) run timing proportions for sites from the river Ness (1:250,000). Pie charts are sized according to the number of individuals screened per site.

Map of the river Ness with pie charts showing the proportion of early (filled) and later (dashed) running fish in a sample of juveniles.

Figure 3. Pie charts showing early (filled portion) and later (dashed portion) run timing proportions for sites from the river Findhorn (1:300,000). Pie charts are sized according to the number of individuals screened per site.

Map of the river Findhorn with pie charts showing the proportion of early (filled) and later (dashed) running fish in a sample of juveniles.

Figure 4. Pie charts showing early (filled portion) and later (dashed portion) run timing proportions for sites from the river Spey (1:400,000). Pie charts are sized according to the number of individuals screened per site.

Map of the river Spey with pie charts showing the proportion of early (filled) and later (dashed) running fish in a sample of juveniles.A map of a mountain with black circles

Figure 5. Pie charts showing early (filled portion) and later (dashed portion) run timing proportions for sites from the river Dee (1:300,000). Pie charts are sized according to the number of individuals screened per site.

Map of the river Dee with pie charts showing the proportion of early (filled) and later (dashed) running fish in a sample of juveniles.

Figure 6. Pie charts showing early (filled portion) and later (dashed portion) run timing proportions for sites from the river North Esk (1: 125,000). Pie charts are sized according to the number of individuals screened per site.

Map of the river North Esk with pie charts showing the proportion of early (filled) and later (dashed) running fish in a sample of juveniles.

Figure 7. Pie charts showing early (filled portion) and later (dashed portion) run timing proportions for sites from the river South Esk (1:150,000). Pie charts are sized according to the number of individuals screened per site.

Map of the river South Esk with pie charts showing the proportion of early (filled) and later (dashed) running fish in a sample of juveniles.

Figure 8. Pie charts showing early (filled portion) and later (dashed portion) run timing proportions for sites from the river Tay (1:400,000). Pie charts are sized according to the number of individuals screened per site.

Map of the river Tay with pie charts showing the proportion of early (filled) and later (dashed) running fish in a sample of juveniles.

Figure 9. Pie charts showing early (filled portion) and later (dashed portion) run timing proportions for sites from the river Tweed (1:325,000). Pie charts are sized according to the number of individuals screened per site.

Map of the river Tweed with pie charts showing the proportion of early (filled) and later (dashed) running fish in a sample of juveniles.  the main tributaries mentioned in the text are labelled.

Figure 10. Pie charts showing early (filled portion) and later (dashed portion) run timing proportions for sites from the river Ullapool (1:70,000). Pie charts are sized according to the number of individuals screened per site.

Map of the river Ullapool with pie charts showing the proportion of early (filled) and later (dashed) running fish in a sample of juveniles.

Contact

Email: Eef.Cauwelier@gov.scot

Back to top