Scottish Prison Population Projections: June 2024 Edition
This report presents short-term Scottish prison population projections for the six month period from May to October 2024. They have been produced using ‘microsimulation’ scenario modelling which simulates prison arrivals and departures, and estimates the number of individuals in prison.
5 Microsimulation Model Results: May to October 2024
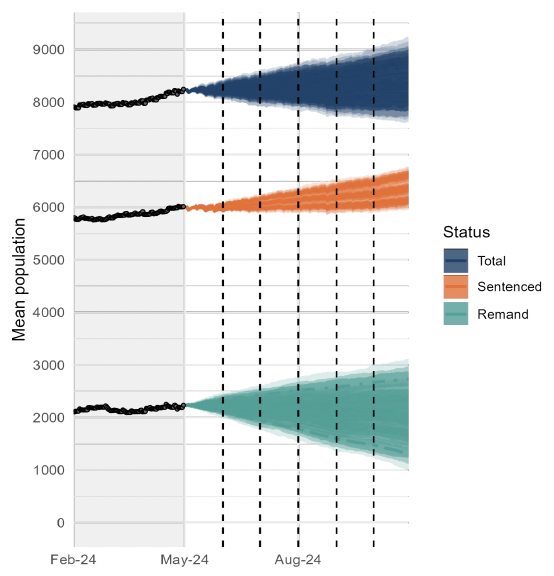
The latest prison population projections are shown in figure 15 and table 2 below. The actual total prison population on 30th April 2024 was around 8,250. The overall projected range for the average daily prison population in October 2024 is between 7,650 and 9,150. Modelling indicates it is likely that the overall prison population in Scotland will increase between the beginning of May and the end of October 2024.
The actual remand population on 30th April 2024 was around 2,250. The overall projected range based on modelling for the average daily remand population in October 2024 is between 1,100 and 3,050. Modelling indicates it is likely that the remand prison population in Scotland will decrease between the beginning of May and the end of October 2024. If the remand population decreases primarily because of enhanced monthly case conclusions, this could contribute to an increased sentenced population as people transition from remand to the sentenced population.
The actual sentenced population on 30th April 2024 was around 6,000. The overall projected range based on modelling for the average daily sentenced population in October 2024 is between 5,950 and 6,700. Modelling indicates it is highly likely that the sentenced prison population in Scotland will increase between the beginning of May and the end of October 2024. The sentenced population is almost certain to rise if inflows exceed outflows. The rate of inflow to the sentenced population could increase if either the overall rate of transition from remand to the sentenced population increases, or if there is a greater inflow of individuals directly from the community to the sentenced population.
| Month | Remand | Sentenced | Total | |||
|---|---|---|---|---|---|---|
| Average Daily Population by Month - Lower estimate | Average Daily Population by Month - Upper estimate | Average Daily Population by Month - Lower estimate | Average Daily Population by Month - Upper estimate | Average Daily Population by Month - Lower estimate | Average Daily Population by Month - Upper estimate | |
| May-24 | 2,100 | 2,350 | 5,950 | 6,050 | 8,100 | 8,350 |
| Jun-24 | 2,550 | 2,550 | 5,900 | 6,200 | 8,000 | 8,500 |
| Jul-24 | 2,700 | 2,700 | 5,900 | 6,300 | 7,900 | 8,650 |
| Aug-24 | 2,850 | 2,850 | 5,900 | 6,450 | 7,800 | 8,800 |
| Sep-24 | 2,900 | 2,900 | 5,900 | 6,600 | 7,700 | 8,950 |
| Oct-24 | 1,100 | 3,050 | 5,950 | 6,700 | 7,650 | 9,150 |
In Table 2 the upper total population and upper remand range estimates are from the scenario variant with a lower conclusion rate and higher remand arrival rate. The lower range estimates for the total and remand populations are from the scenario with a high conclusion rate and a low remand arrival rate.
It should be noted that whilst the projections are based on recent trends, they do not explicitly model the impact of potential future policy or operational changes and their potential impact on the prison population.
Contact
Email: Justice_Analysts@gov.scot
There is a problem
Thanks for your feedback