Scottish Rural Development Programme 2014-2020: Evaluation of Capital Grant Schemes: Annex A - Sector overview
This annex presents a sector overview as part of the independent evaluation of three capital grant schemes funded through the Scottish Rural Development Programme (SRDP) 2014-2020. This is an annex to the main evaluation report.
2. Socio Economic Review
Summary overview
The agricultural industry in Scotland makes an important contribution to the Scottish economy, supporting jobs and economic activity. The sector also continues to face a range of challenges.
Key positive aspects about the state of the agricultural industry include that:
- around 80% of Scotland’s land mass is used for agricultural production.
- total area of land either used for growing crops or rearing livestock has grown by 10% between 2014 and 2022 to 5.66 million hectares.
- the agricultural sector employs around 67,000 people directly in Scotland – employment has remained relatively stable over the past decade.
- Scottish farmers, growers and crofters produce an output worth around £3.18 billion annually.
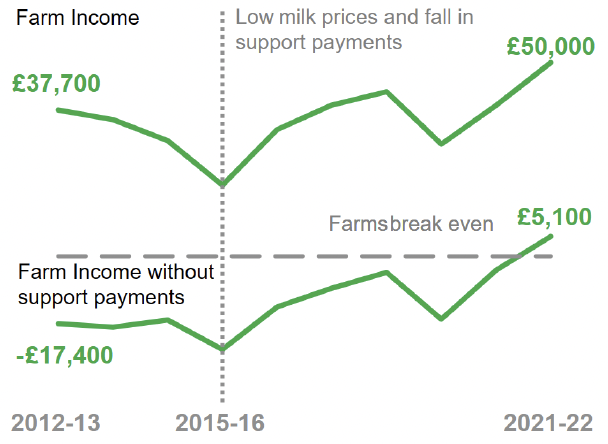
- income generation from agriculture has grown - from an average loss of £17,400 (pre subsidy) per farm in 2012-2013 to a profit of £5,100 (pre subsidy) by 2021-2022.
On the flip side the agricultural sector
- farm work has become increasingly uncertain, with around 12% of the agricultural workforce classed as either seasonal or casual labour – up from 10% in 2014.
- farming and crofting remains a male dominated industry, albeit female participation has increased.
- farmers and crofters are getting increasingly older.
- pay in the farming sector is below the national average (by about 12%).
- the crofting sector in Scotland faces significant challenges, with the average crofting income less than £5,000 per year – a recent survey published by SG (2019) found that 92% of crofters surveyed felt that crofting was not economically viable without a household member supplementing their income from non-crofting related activities.
Agriculture continues to be crucial to economic growth (directly and indirectly) – there is more to do on succession planning and attracting more people into the industry - driving up pay and income to ensure economic viability is part of this. Not least given the cost of living pressures currently facing households and businesses, including farmers and crofters.
Introduction
This section provides an overview of the agriculture sector in Scotland, analysing various time series data over the programme period to identify trends and changes that have occurred. This helps to contextualise the operating environment in which the capital grant schemes were delivered.
The section looks at:
- agricultural employment, including demographic changes.
- farm income and Gross Value Added (GVA).
- economic output.
- the size of the worked agricultural area.
- the impact of subsidies.
- the economic condition of crofting.
Sector overview
The agriculture industry employs around 67,000 people directly in Scotland, representing around 8% of the total rural workforce.[11] The number of people employed in agriculture has remained relatively stable over the last 10 years. The median age of farmers and crofters has, however, increased.[12]
It is estimated that a further 360,000 jobs (roughly 1 in 10 of all Scottish jobs) are dependent on agriculture in some way.[13] This would include the likes of the Scotch Whisky industry which uses cereal for its malt whisky products or the tourism and hospitality sector (for example, for restaurants, cafes, hotels).
Farming also uses a significant proportion Scotland’s land mass, with around 80% under agricultural production, with Scottish farmers, crofters and growers producing an output worth, in monetary terms, around £3.18 billion annually.[14] Although agriculture only makes up around 0.8% of Scotland’s total GVA, it accounts for around 2.5% of the country’s employment.[14]
Income
In terms of income generated from farming, things have begun to improve. In 2021-2022 the average farm in Scotland (including subsidies) had an income of £50,000, up from around £37,700 in 2012-2013 (an increase of 33%).[15] Although when excluding subsidy support, the average farm income in Scotland was only £5,100 in 2021-2022 – though this is a vast improvement on the average in 2012-2013, when the average farm lost £17,400 (pre-subsidy),[16] see Figure 2.1. Only in the years post 2020 (from 2012) has farm income excluding subsidies been positive (that is, in the black), with the average Scottish farm registering a pre-subsidy loss between the years 2012 and 2020.[17]
Source: Scottish Government, Scottish Farm Business Income 2021-2022
The recently improved financial position of farms is in part a reflection of a diversification in activities – many more farms are embracing the likes of agritourism as a way to generate additional revenue and reduce reliance on traditional agricultural activities. This is further highlighted in Figure 2.2, which shows that purely based on agricultural activities the average farm in Scotland would have lost £5,500 in 2021-2022.

Source: Scottish Government, Scottish Farm Business Income 2021-2022
Land use
Around 85% of agricultural land in Scotland is classified as being a Less Favoured Area. This is an EU classification which recognises natural and geographic disadvantage.[18]
Due to the geographic landscape of Scotland, the type of faming tends to vary on a West-East basis. Sheep farming is the predominant farming type in the North-West and West of Scotland, where the land is generally mountainous and rocky, with the largest cereal and fruit producing areas concentrated in the East, where the land is generally flatter, more fertile and receives higher amounts of sunshine.
Dairy farming is particularly prevalent in the likes of Dumfries and Galloway and the wider South-West of Scotland, with the North-East having the greatest mix of farming types and a particular strength in beef production.
Figure 2.3 provides a map of the various land uses across Scotland.
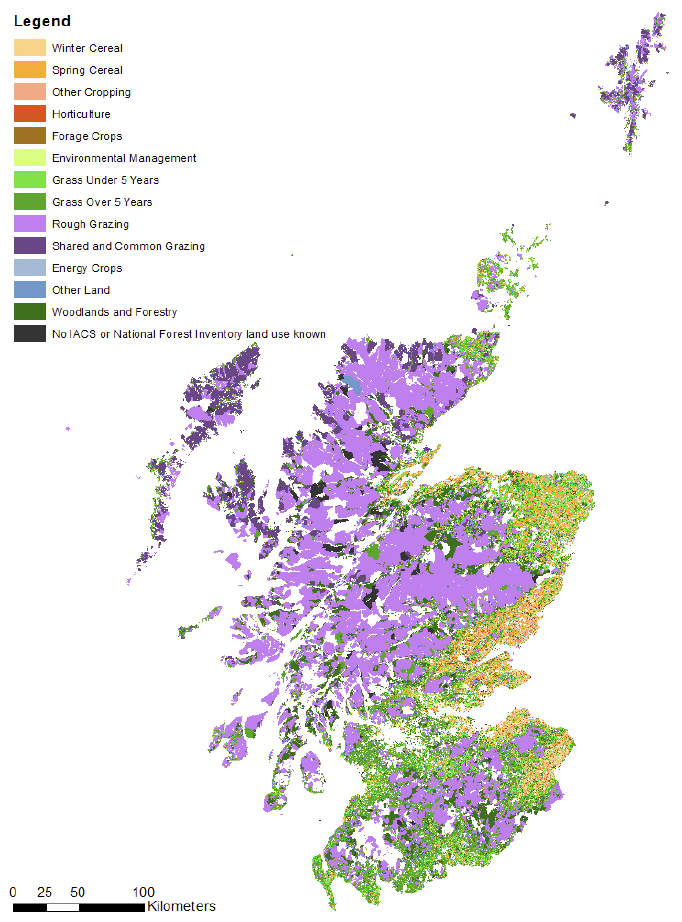
Source: James Hutton Institute: Natural Capital Accounts for Scotland: Agriculture Sector Accounts (Reproduced under CC BY 4.0 license)
Demographics
The median age of farmers in Scotland has increased from 57 in 2012-2013 to 60 in 2021-2022, with increases experienced across all farm types (barring specialist cattle which has remained the same). This can in small part be explained by Scotland’s overall ageing demographics.[19]
That being said, workers in the farming sector in Scotland are ageing at a much faster rate than the population as a whole, with a lack of new entrants coming into the sector. This means that existing farmers are working to an increasingly older age without young entrants to replace them, see Table 2.1.
| Year | Cereal | General Cropping | Dairy | Specialist Sheep (LFA) | Specialist Cattle (LFA) | Specialist Cattle & Sheep (LFA) | Lowland Cattle & Sheep | Mixed | All types |
|---|---|---|---|---|---|---|---|---|---|
| 2012-13 | 58 | 59 | 51 | 60 | 58 | 56 | 57 | 56 | 57 |
| 2013-14 | 59 | 59 | 51 | 61 | 57 | 56 | 56 | 57 | 57 |
| 2014-15 | 59 | 60 | 52 | 61 | 58 | 58 | 58 | 57 | 58 |
| 2015-16 | 61 | 58 | 53 | 63 | 58 | 58 | 58 | 59 | 59 |
| 2016-17 | 60 | 58 | 54 | 64 | 57 | 59 | 59 | 60 | 59 |
| 2017-18 | 61 | 57 | 52 | 65 | 58 | 59 | 56 | 60 | 59 |
| 2018-19 | 62 | 58 | 53 | 65 | 59 | 60 | 56 | 61 | 59 |
| 2019-20 | 60 | 60 | 54 | 63 | 59 | 60 | 56 | 61 | 60 |
| 2020-21 | 61 | 61 | 55 | 64 | 58 | 61 | 57 | 61 | 60 |
| 2021-22 | 62 | 61 | 56 | 65 | 58 | 62 | 58 | 62 | 60 |
| Overall Change | +4 | +2 | +5 | +5 | - | +6 | +1 | +6 | +3 |
Source: Scottish Government, Scottish Farm Business Income 2021-2022
Employment
In terms of employment in agriculture, at most recent count (based on the June 2023 Scottish Agricultural Census), the total Scottish agricultural workforce totalled 66,753 people.
The number of people employed in agriculture has remained relatively stable over the last 10 years, with 2015 and 2016 registering a noticeable fall in employment (Figure 2.4) which was likely due to poorer cereal yields in 2016, which were down by 11% on 2015 levels.[20]
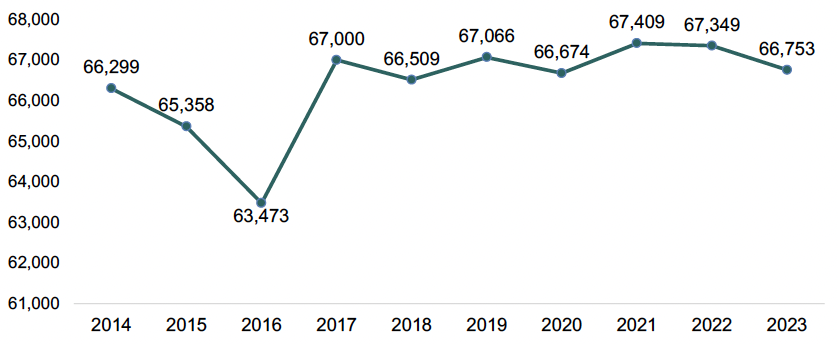
Source: Scottish Government, Scottish Agricultural Census, June 2023
Note: Includes Occupiers, FT and PT employees and seasonal/casual workers
The agricultural sector tends to have quite a large element of casual labour given the seasonality of the industry and the need at certain points of the year to increase labour supply (for example, lambing season, sheep shearing).
Although seasonal/casual working has always been an intrinsic part of the agricultural industry it has grown in recent years. In 2014 the proportion of the total agricultural workforce who were classed as seasonal/casual was around 10% (6,666 workers), while by 2020 the number of casual/seasonal workers had risen to 8,307, around 12% of the agricultural workforce.[21]
Other key points to note from the Scottish Agricultural Census include the following.
Of those workers who are not farm occupiers, but either employed staff, partners of the occupier or a family member of the occupier, there are particularly interesting changes around gender, including that:
- women are making up a growing share of farm workers, with a 92% increase in full-time female staff working in agriculture over the last 10 years (2014-2023), whilst over the same period the number of full-time males has increased by only 2.2%. SG has since introduced the Women in Agriculture Practical Training Fund to support the personal development of women and girls aged thirteen years and older, providing them with additional skills to progress their careers and employment opportunities in Scottish agriculture beyond their current role – an important development to create more opportunities for women in agriculture.
- although this is significant change, the industry is still male dominated, with 78% of all full-time (non-occupier) farm workers male - although this is down from 87% in 2014, see Table 2.2. In terms of the number of farm occupiers, there has been very little change in the number either working ‘full-time’ or ‘half-time or more’.
- there has been a significant decrease (-17%) in the number of occupiers working ‘less than half-time’ - this suggests firstly that there are fewer occupiers working in farming and that those that are, are working a greater number of hours.
| Measure | 2014 | 2015 | 2016 | 2017 | 2018 | 2019 | 2020 | 2021 | 2022 | 2023 | % Change 2014-23 |
|---|---|---|---|---|---|---|---|---|---|---|---|
| Total Number of Casual and seasonal staff | 6,666 | 6,838 | 6,350 | 8,249 | 8,215 | 8,580 | 8,238 | 8,003 | 7,993 | 8,307 | +25% |
| % of total employment that are causal or seasonal | 10% | 10% | 10% | 12% | 12% | 13% | 12% | 12% | 12% | 12% | +2% |
| Occupiers - Fulltime | 11,382 | 11,203 | 10,699 | 11,108 | 11,193 | 11,270 | 11,385 | 11,722 | 11,684 | 11,391 | +0.1% |
| Occupiers – Half time or more | 6,027 | 5,932 | 5,745 | 5,923 | 6,030 | 6,021 | 6,041 | 6,354 | 6,339 | 6,035 | +0.1% |
| Occupiers – less than half time | 21,576 | 20,834 | 20,270 | 20,704 | 20,198 | 20,540 | 20,462 | 20,232 | 20,234 | 17,908 | -17% |
| Non-occupiers - Fulltime Males [22] | 11,542 | 11,529 | 11,324 | 11,568 | 11,373 | 11,160 | 10,985 | 11,182 | 11,166 | 11,796 | +2.2% |
| Non-occupiers - Fulltime Females[23] | 1,691 | 1,769 | 1,769 | 1,848 | 1,866 | 1,950 | 1,934 | 2,204 | 2,221 | 3,253 | +92% |
Source: Scottish Government, Scottish Agricultural Census, June 2023
Economic value
The agriculture industry has a significant wider impact within the Scottish economy.
The output multiplier for agriculture in the SG input-output tables[24] has typically been around 50% over the past 20 years. This in lay terms means that, for example, £10 million of activity in the agricultural sector, would typically generate a further £5 million in economic activity in other sectors of the Scottish economy. Essentially, agricultural activity has a large indirect impact on the wider economy via supply chains and supporting activity elsewhere in the economy.
In examining Scottish Annual Business Statistics[25] data for the sector, specifically the category entitled ‘Crop and animal production, hunting and related service activities’ the average GVA per head was £45,022 in 2021, which equates to £48,732 in 2024 prices.[26] GVA is a measure of the value of goods or services produced by an individual over an annual period (that is, the average agricultural worker in Scotland in 2024 will produce goods/services worth £48,732).
In terms of wages, the agricultural sector in Scotland has tended to pay below the Scottish average, with average wages approximately 12% higher for full-time workers outside the agricultural sector than those working within it. The gap is beginning to close, falling from an 18% difference in 2014 to 12% by 2019 (the latest year in which comparable data for the agricultural sector is available), see Table 2.3.
| Measure | 2014 | 2015 | 2016 | 2017 | 2018 | 2019 |
|---|---|---|---|---|---|---|
| Fulltime hired agricultural worker* | £439 | £454 | £479 | £478 | £518 | £517 |
| Fulltime employee - Scotland Average | £519 | £527 | £536 | £547 | £563 | £578 |
| % Difference (Scottish average compared to Agriculture) | 18% | 16% | 12% | 14% | 9% | 12% |
Source: Scottish Government, Economic Report on Scottish Agriculture, 2020
Note: *Includes cash earnings, bonuses and overtime payments
Land use
The amount of land in Scotland that is used for agriculture increased by around 10% between 2014 and 2022, with the area used as ‘total sole right agricultural land’ – that is, land solely used for the purpose of growing crops or rearing livestock, growing by 60,000 hectares (equivalent to around 85,000 football pitches), from 5.60 million hectares in 2014 to 5.66 million by 2022, see Figure 2.5.
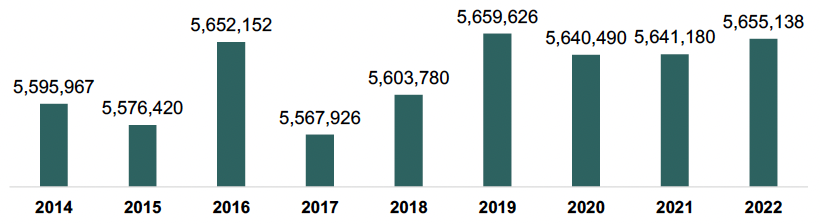
Source: Scottish Government, Scottish Agricultural Census, June 2023
Value of output
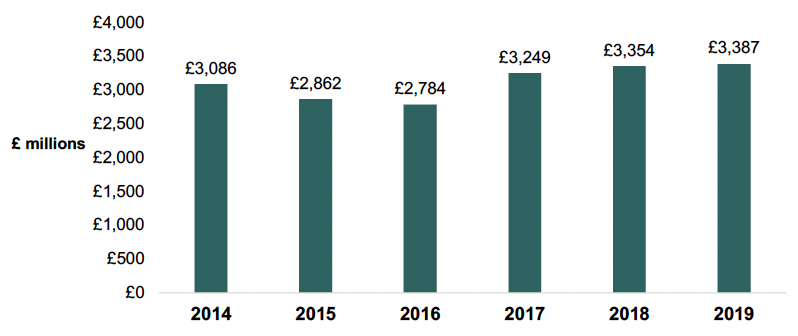
The economic output from the Scottish farming industry has increased over recent years (2019 being the last remaining year in which SG Economic Reports on Scottish Agriculture were published) reaching £3.39 billion in 2019.
There were reductions in economic output in 2015 and 2016, with poorer than expected crop yields during this period.[27] A large increase was then registered between 2016 and 2017, with steady increases in subsequent years, see Figure 2.6.
Source: Scottish Government, Economic Report on Scottish Agriculture, 2020
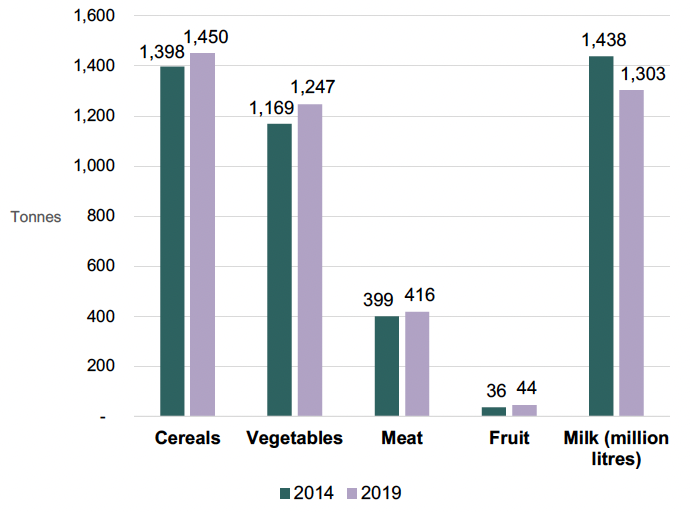
Each category of agricultural product (excluding milk) has experienced an increase in output between 2014 and 2019 - particularly notable was fruit (output grew by 25% over this period), although the volume of fruit production is considerably lower in tonnages than the likes of vegetables or cereals, see Table 2.4 (below) and Figure 2.7 (next page).
Table 2.4: Changes in output between 2014 and 2019
- Cereal: +4% change in output (2014-19)
- Veg: +7% change in output (2014-19)
- Meat: +4% change in output (2014-19)
- Fruit: +25% change in output (2014-19)
- Milk: -9% change in output (2014-19)
Source: Scottish Government, Economic Report on Scottish Agriculture, 2020
Source: Scottish Government, Economic Report on Scottish Agriculture, 2020
Farm income and costs
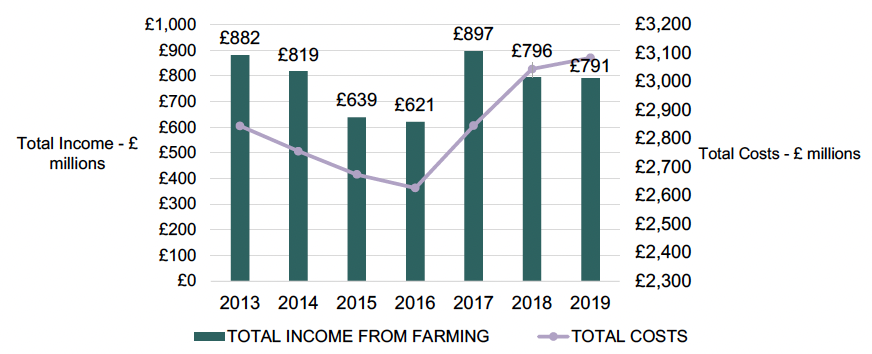
Despite the rises in agricultural output, the income generated from farming has tended to be slightly more erratic over recent years. Over the period 2013 to 2019, it peaked at around £900 million (2017), then fell to £791 million (2019), a decrease of 12%, despite output increasing by 4% over the same period. Total costs have also increased significantly from a low of £2.63 billion in 2016 to £3.08 billion in 2019, see Figure 2.8.
Source: Scottish Government, Economic Report on Scottish Agriculture, 2020
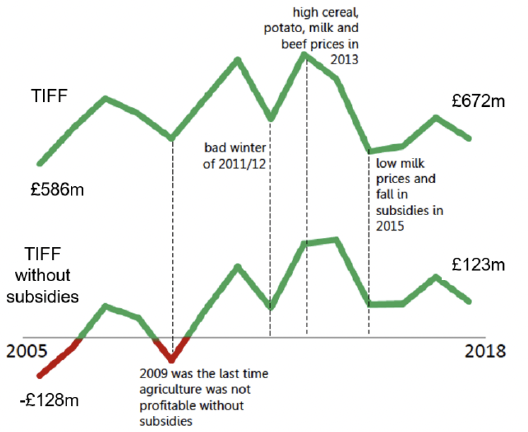
What is clear is that without subsidy support, income from farming would be significantly lower, as shown in Figure 2.9. The years 2005 and 2009 would have experienced losses without subsidy support. Income tended to fluctuate quite significantly thereafter, with lower milk prices having an impact on farm income from 2015 onwards.
Source: Scottish Government, Economic Report on Scottish Agriculture, 2020
Crofting sector
In December 2022 SG published an Economic Conditions Report of Crofting 2019-2022 which provides an overview of the current economic conditions facing the crofting industry. It provides an update to the previous reports covering the periods 2011-2014 and 2015-2018. The research took the form of a survey of 4,000 crofters between July and September 2022 which sought views on a range of social and economic issues.
A key finding is that crofting remains an economically challenging industry in which to make a living, with one-third of crofters stating that they had made no income from crofting over the last 12 months, with just over half of crofters receiving an income from grant money and/or support schemes.
Other key findings from the report are set out under the following sub-headings.
Background/Demographics
- crofters tend to be male (68%) and over the age of 55 (68%), although the proportion of female crofters has risen considerably, from 13% (2014) to 26% (2018) and is now 30% (2022).
- the most likely reason to become a crofter is having been brought up in a crofting family – 48% of crofters have been doing so for over 20 years, although this is down considerably from 70% in 2014.
Income and Expenditure
- those receiving no income from crofting has increased from 25% in 2018 to 38% in 2022 - the average crofting income is £4,538.
- 82% of crofters have running costs of under £5,000 a year.
- a greater proportion of crofters are now paying rent or a mortgage (64%) - up from 57% in 2018.
- the vast majority of crofters (92%) agreed that crofting was not economically viable without household members supplementing their income from non-crofting related activities.
Croft Investment
- there has been a slight decrease in the proportion of crofters looking to make investment in their croft, at 61%, down from 68% in 2018.
- plans for investment in crofts had risen significantly, with 62% stating they planned to invest in their croft, compared to 48% in 2018.
- livestock was the most common response in regard to the type of investment planned, 52%, followed by crops (30%) and forestry and woodland creation (22%).
Biodiversity
Questions on biodiversity, peatland restoration and woodland creation were newly added to the 2022 survey, and key findings include that:
- 28% of crofters had undertaken one or more of these activities during the reporting period (2019-2022).
- the most common activity undertaken was woodland/forestry creation (18%), followed by biodiversity activities (12%).
- 25% of crofters have used available schemes to either restore peatland, carry out biodiversity activities or create forestry/woodland.
- a lack of information (38%) and uncertainty on the potential benefit (37%) were the most common reasons for not undertaking these types of activities.
Contact
Email: socialresearch@gov.scot
There is a problem
Thanks for your feedback