Scottish Rural Development Programme 2014-2020: Evaluation of Capital Grant Schemes – Main Report
This report presents findings from an independent evaluation of three capital grant schemes funded through the Scottish Rural Development Programme (SRDP) 2014-2020.
8. Impact
Overview
A key research aim was to address the EC Reporting Requirement to monitor change in agricultural output – that is the change in agriculture output per AWU to determine how the CAGS, SFGS and NECGS grant have impacted business productivity.
The annual work unit is calculated by capturing the full-time equivalent employment (FTE) – that is, the total hours worked divided by the average annual hours worked in full-time jobs in the country. In this case, one annual work unit corresponds to the work performed by one person who is occupied on an agricultural holding on a full-time basis.[14] The Output is calculated by adding the Value of Sales of products and services (in £) together with the Value of Stocks of products (in £) and the Value of own use or consumption (in £).
The EC measures the AWU in agriculture to assess and compare the labour input across the agricultural sector of member states. This measurement is crucial for several reasons, including for:
- productivity analysis – it is a key indicator for analysing agriculture labour and helps in understanding income generated from farming.
- policy making – data collected on AWUs are used to inform the CAP ensuring polices are tailored to need.
- comparative analysis – by standardising this measurement the EC can make comparisons across regions on labour input and output.
- resource allocation – understanding the AWU helps allocate resources and support where it is needed most to ensure sustainability and growth in agriculture across the EU.
As part of the evaluation, grant recipients were asked to detail their employment, and the value of their sales, stock and running costs, at three distinct time points, namely:
- the year in which the grant funded project started – responses ranged from 2014 to 2021.
- the year the project was completed – responses ranged from 2014 to 2024.
- two-years post project completion – responses ranged from 2014 to ‘not yet 2-years post project.
In total we received around 90[15] complete responses to the impact section, approximately half the number received for the whole survey.
Table 8.1 provides details of the survey question grant recipients were asked in relation to quantifying the value of their sales, stock and running costs.
Table 8.1: Impact survey question
| (Financial or calendar year, to fit with your business accounts) | Value of sales of livestock, products, and services (in £) | Value of stock (including unsold products/stock and growing crops) (in £) | Value of running costs (for example, feed, energy, fertilisers, and own consumption (in £) | ||
|---|---|---|---|---|---|
| Year in which first project started (since 2014) | |||||
| Year in which most recent project completed (this could be actual or forecast) | |||||
| 2-years after most recent project received funding (this could be actual or forecast) | |||||
The survey asked recipients to specify their employment at each of the same three time periods, broken down by full-time, part-time, seasonal and casual employment. The purpose of this was to assess the relationship between employment and the value of sales and stock. This also allows a calculation of an AWU – that is, what have been the changes in terms of the number of FTE[16] staff working across the recipient farms and crofts.
Method
To calculate the employment figures raw data was provided by recipients for the above three categories broken down by employment type (full-time, part-time, seasonal, and casual). Survey respondents were also asked to specify the average number of hours worked by their casual and seasonal labour over an average year. This allowed casual and seasonal employment to be calculated as an FTE.
Based on respondents’ answers it was calculated that casual/seasonal work equated to 0.3 of an FTE. As per HM Treasury Green Book guidance we have assumed a part time worker equates to 0.5 FTE.
To calculate the value of sales, stock and running costs, data provided by respondents was used. We were able to look at the difference across time periods to assess as to whether there had been an uplift (or decrease) in these values, and then assess the relationship between this change against any employment changes for the same period.
Lastly, we asked grant recipients to assess the ‘additionality’ which the grant funding provided them – that is, in the absence of grant support what proportion of the impacts would have occurred anyway. This ensured that we were able to properly attribute the impact of the grant support to the total impacts.
Limitations
It should be noted that there are a few limitations and data gaps in this area of analysis. Firstly, the impact element of the survey received around 90 complete responses, which was less than half the total number of responses (199) received to the survey. As we work from an estimation that there were 3,226 unique farms and crofts that received grant support from one of the three schemes,[17] the 90 responses represents a relatively small sample size. Furthermore, responses related to the SFGS and NECGS schemes were very low (less than 10 each) hence it is not possible to draw any conclusive findings for the grant schemes individually as the sample is simply too small.
Several grant recipients (around 10) noted some difficulties in estimating the value of stock, sales and running costs at each of the time points, stating that it was not a measure they kept an active count of and that it involved a large degree of estimation. Several respondents noted that they had provided a ‘very rough estimation’, suggesting there was a lack of confidence in the accuracy of the figures they were providing.
Lastly, as the grant programme ran over a period where we witnessed several macro-economic shocks, with the likes of the COVID-19 pandemic, BREXIT and the war in Ukraine, there were a few external factors that may have impacted on employment, production, and the general costs of materials. All of which make isolating the impact of the grant support challenging.
Findings
This sub-section sets out the findings for the impact analysis, broken down by:
- employment/annual work unit.
- the value of:
- sales.
- stock.
- running costs.
Employment
Employment across the recipient farms and crofts has fluctuated across the period of analysis. Some of the key points to note from Table 8.2 over, include:
- full-time employment increased by 196 (+4%), in the year post project completion, while part-time employment fell slightly over this period, down 46 (-0.8%).
- casual and seasonal employment saw a fairly large decrease in the year post project completion, falling by circa 800 (-12%). This contrasts with the trends seen across the farming sector in Scotland, with the number of casual and seasonal staff increasing by 25% between 2014-2023 – see Table 4.2.
- Full-time and part-time employment were both up 2-years post project completion (from pre project), while casual and seasonal employment was down – although it had rebounded slightly from the large fall witnessed during the year post project. This is broadly in-line with wider Scottish agricultural trends (FT and PT has been up marginally – circa 1% over 2014-2023 – see Table 4.2).
- when converted to FTE, there was a small decease in the total number of employees, down 64 in the year post project, while FTE numbers were up by 109 2-years post project completion.
| Type of employment | Employment pre project /grant | Employment post project | Employment 2-years post project | Change post project | Change 2-years post project |
|---|---|---|---|---|---|
| FT | 4,624 | 4,820 | 4,729 | + 196 | +105 |
| PT | 5,524 | 5,479 | 5,710 | -46 | +186 |
| Casual | 3,846 | 3,764 | 3,624 | -83 | -223 |
| Seasonal | 3,279 | 2,570 | 2,837 | -709 | -442 |
| Total – FTE[18] | 9,523 | 9,459 | 9,632 | -64 | +109 |
N=90
Note: Figures have been scaled up to account for the entire size of the grant recipient population (pprox.. 3,226 unique farms/crofts received grant funding). The figure of 3,226 is an estimation and is based on estimations provided by Scottish Government, and assumes:
- 50% of the 4,857 CAGS approvals being for unique businesses
- 60% of 158 SFGS approvals being for unique businesses
- 80% of the 878 NECGS approvals being for unique businesses
However, it is important to note the proportions are rounded, and the estimations are based on incomplete data as some data are not held electronically. The 90 responses make up a circa 2.8% sample of the total number of the estimated unique businesses that received grant support. The total impacts have been scaled up on the basis of the 90 responses being a representative sample of grant recipients i.e., Total impacts = Survey impacts/(2.8/100).
It is important to note that some of the reporting on employment occurred during COVID-19, during which employment shrank and when there was great uncertainty within the economy, which could help explain some of the large changes experienced. The fairly large increase in part time employment, at a time when seasonal and casual employment had fallen (2-years post project), is also interesting.
The fall in casual/seasonal employment could also be partly linked to BREXIT, which has made employing EU workers for seasonal roles – for example, fruit picking, etc increasingly challenging.
Value of sales, stock and running costs
The value of the sales and the stock of the grant recipient farms and crofts has risen, both in the year of project completion as well as 2-years post project completion. The running costs have also increased during this period, although this is likely in-part due to some of the large macroeconomic changes that have occurred e.g., BREXIT and the war in Ukraine, which have increased the costs of grains and fuel (the war in Ukraine has led to an approximate 38% reduction in Ukrainian grain production between 2021/22 and 2023/24[19] – Ukraine accounts for over 10% of the worlds wheat, barley and corn production[20]), rather than solely as a result of the grant scheme itself.
Table 8.3 below sets out the value impacts over the grant support period. Key points to note include that:
- the value of sales of livestock, products and services increased by £33.9m in the year of project completion (+60%), while they were up £90.6m (+160%) 2-years post completion (in comparison to the value of sales prior to the project commencing).
- the value of stock (including unsold products/stock and growing crops) increased by £15.9m in the year of project completion (+28%), while the value of stock was up £27.8m (+48%) 2-years post completion (in comparison to the value of stock prior to the project commencing).
- the value of running costs increased by £15m (+44%) in the year of project completion in comparison to pre-project. They were also up £8.2m 2-years post project completion in comparison to before the project commenced.
| Measure | Pre-project value | Total value – year of project completion | Change (+/-) – year of project completion | Total value – 2 years post project completion | Change (+/-) – 2 years post project completion |
|---|---|---|---|---|---|
| Value of sales of livestock, products, and services (in £) | £56,772,625 | £90,648,565 | +£33,875,940 | £147,423,933 | +£90,651,307 |
| Value of stock (including unsold products/stock and growing crops) (in £) | £57,644,016 | £73,531,156 | +£15,887,141 | £85,405,753 | +£27,761,737 |
| Value of running costs (for example, feed, energy, fertilisers, and own consumption (in £). | £34,117,727 | £49,132,759 | +£15,015,032 | £42,333,556 | +£8,215,829 |
Note: Figures were estimated in 2024 prices. These impacts have been scaled up based on the responses of the 90 farms/crofts and assumes they are a represenatative sample of the estimated 3,226 unique farms and crofts that recived grant funding.The estimation of unique farms is based on rounded proportions and on incomplete data as some data are not held electronically.
Additionality and summary of findings
As part of the survey, grant recipients were asked the question ‘What amount of your outcomes would have happened if you did not get the capital grant scheme funding?’.
This question helped to gauge additionality and enabled a certain proportion of the total impacts to be attributed to the capital grant support schemes. The response to this question is presented in Figure 8.1 below.
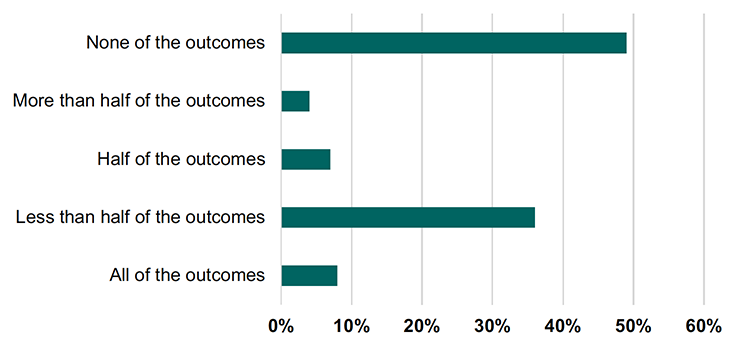
N=90
In taking a weighted average of the above reponses – that is, assuming 50% additonality for respondents who answered ‘half of outcomes’, 75% for those responding ‘less than half of the outcomes’ and 25% for those responding ‘more than half of the outcomes’, we can calculate that on average, 69% of the impacts could be atributed to the grant support itself.
In applying this additionality weighting to the aforementioned employment and value of sales and stock[21] (Table 8.2 and 8.3), we can conclude the following:
- the grant support has raised annual work units (FTE) employment by 75 (2-years post project completion)
- the grant suport has helped raise the value of sales by £62.5m (2-years post project completion)
- the grant suport has helped raise the value of stock by £19.2m (2-years post project completion)
These additionality findings are sumarised in Table 8.4 below.
| Measure | Year of project completion | 2 years post project |
|---|---|---|
| Employment | -44 | +75 |
| Value of sales of livestock, products and services | +£23.4m | +£62.5m |
| Value of stock (including unsold products/stock and growing crops) | +£11.0m | +£19.2m |
Note: These impacts have been scaled up to account for the estimated 3,226 farms and crofts that recived grant funding. As noted previously, this estimation is based on rounded proportions and incomplete data as some data are not held electronically. The impacts are based on the responses of 90 grant recipient farms and crofts.
Contact
Email: socialresearch@gov.scot
There is a problem
Thanks for your feedback