Scottish Shellfish Farm Production Survey 2023
This report is based on the returns of an annual survey questionnaire sent to all active authorised shellfish farming businesses in Scotland. Statistics on employment, production and value of shellfish from Scottish shellfish farms are presented.
Production
The shellfish species cultivated in Scottish waters in 2023 are shown in table 1.
Table 1 Shellfish species surveyed in this report and their corresponding Latin name.
Common mussel: Mytilus spp.
Pacific oyster: Magallana gigas (also known as Crassostrea gigas)
Native oyster: Ostrea edulis
King scallop: Pecten maximus
Production was dominated by common mussel and Pacific oyster, although small quantities of king scallop and native oyster were also produced. The 2023 production data for each species by region are given in tables 2 and 3. There was only a very small amount of queen scallop (Aequipecten opercularis) production during 2023 as the main producer ceased trading during 2022. Queen scallop information was not reported this year due to the low levels of production and producers.
Table 2 Scottish regional shellfish production for table for 2023.
Values are shown in tonnes for common mussel, and thousands of shells for Pacific oyster, native oyster and king scallop.
Note: individual values have been rounded to whole numbers of tonnes for common mussel, and to thousands of shells for other species. ‘All Scotland’ values are summed regional values.
Region |
Common mussel (Tonnage) |
Pacific oyster (thousands of shells) |
Native oyster (thousands of shells) |
King scallop (thousands of shells) |
|---|---|---|---|---|
Highland |
801 |
1,775 |
0 |
24 |
Orkney |
0 |
176 |
20 |
0 |
Shetland |
8,694 |
3 |
0 |
0 |
Strathclyde |
433 |
1,569 |
91 |
0 |
Western Isles |
383 |
404 |
0 |
0 |
All Scotland |
10,311 |
3,927 |
111 |
24 |
Data Source: Scottish Shellfish Farm Production Survey 2023, Supplementary Tables, Table 1
Table 3 Scottish shellfish production for on-growing 2023.
Values are shown in tonnes for common mussel and thousands of shells for Pacific oyster, native oyster and king scallop.
Note: individual values have been rounded to whole numbers of tonnes for common mussel, and to thousands of shells for other species. ‘All Scotland’ values are summed regional values.
Region |
Common Mussel (Tonnage) |
Pacific Oyster (thousands of shells) |
Native Oyster (thousands of shells) |
King Scallop (thousands of shells) |
|---|---|---|---|---|
Highland |
54 |
2,000 |
38 |
0 |
Orkney |
0 |
0 |
0 |
0 |
Shetland |
2,085 |
0 |
0 |
0 |
Strathclyde |
0 |
1,432 |
26 |
0 |
Western Isles |
387 |
800 |
0 |
0 |
All Scotland |
2,526 |
4,232 |
64 |
0 |
Data Source: Scottish Shellfish Farm Production Survey 2023, Supplementary Tables, Table 1
Trends in common mussel production for table and on-growing in Scotland are shown in chart 1, whilst trends in Pacific oyster production for table and on-growing in Scotland are shown in chart 2.
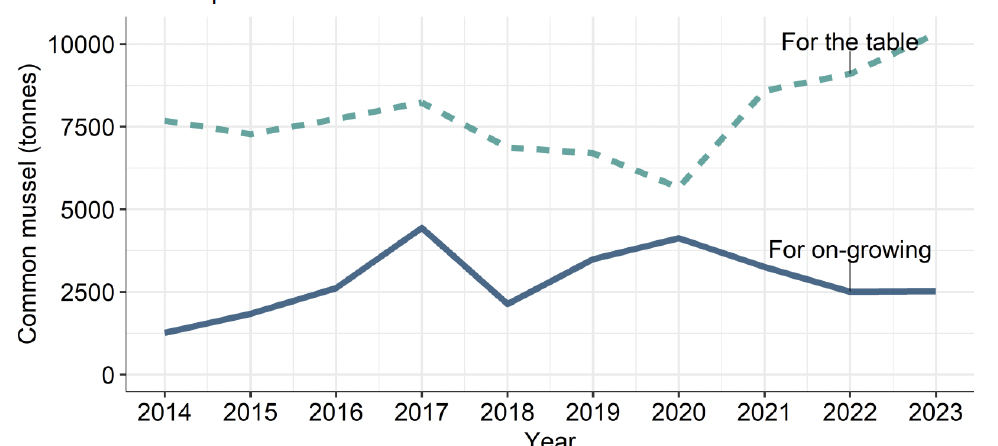
Chart 1 Trends in production for common mussel for table and on-growing 2014-2023.
The upper dashed turquoise line shows the production for table and the lower dark blue line shows the production for on-growing.
Data Source: Scottish Shellfish Farm Production Survey 2023, Supplementary Tables, Table 2
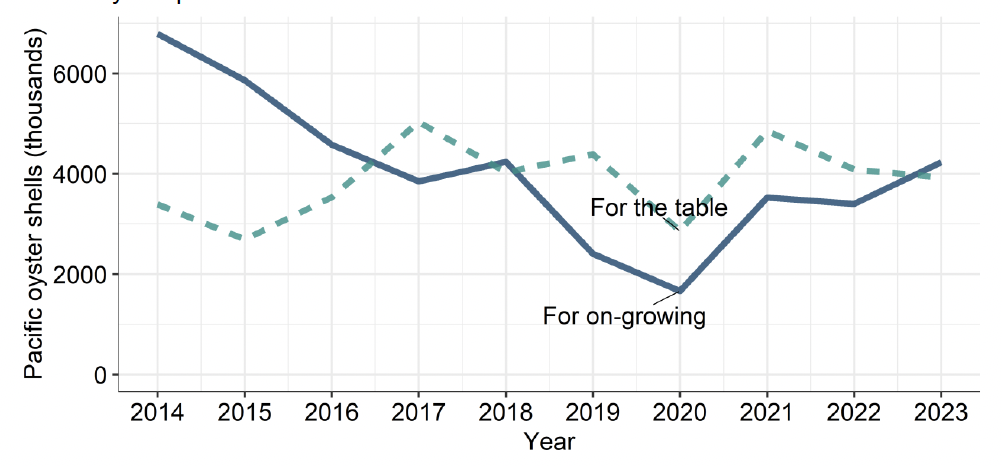
Chart 2 Trends in production for Pacific oyster for table and on-growing 2014-2023.
The upper turquoise dashed line shows the production for table and the lower dark blue line shows the production for on-growing. The data for this figure are shown in the supplementary data.
Data Source: Scottish Shellfish Farm Production Survey 2023, Supplementary Tables, Table 2
Trends for table production for native oyster and king scallop are illustrated in chart 3. Trends in on-growing production for native oyster and king scallop are illustrated in chart 4.
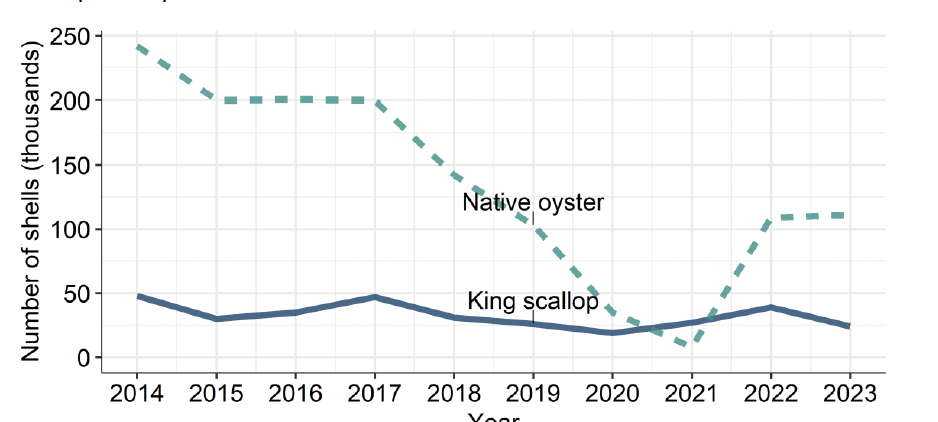
Chart 3 Trends in production for other species for table 2014-2023.
The upper turquoise dashed line shows native oyster production (in thousands of shells). The lower dark blue line shows king scallop production (in thousands of shells). The data for this figure are shown in the supplementary data.
Data Source: Scottish Shellfish Farm Production Survey 2023, Supplementary Tables, Table 2
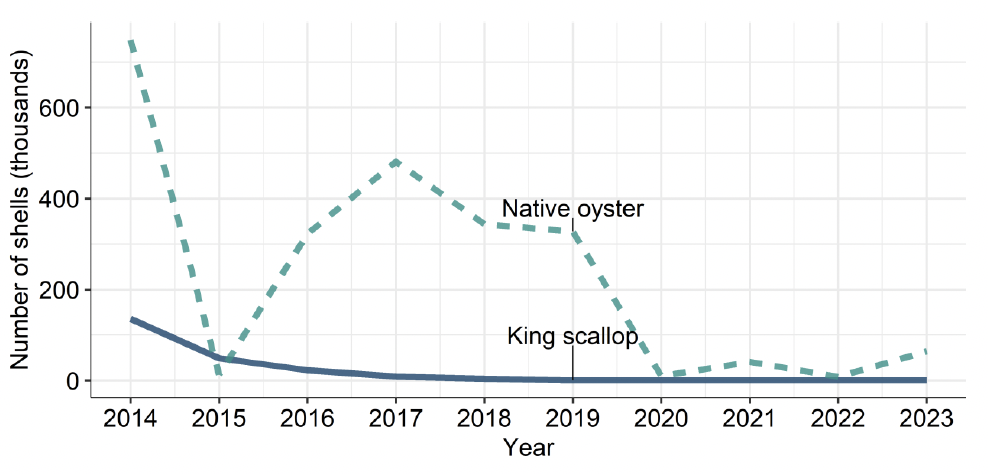
Chart 4 Trends in production for other species for on growing 2014-2023.
The upper turquoise dashed line shows native oyster production (in thousands of shells). The lower dark blue line shows king scallop production (in thousands of shells). The data for this figure are shown in the supplementary data.
Data Source: Scottish Shellfish Farm Production Survey 2023, Supplementary Tables, Table 2
Common mussel production, for the table, increased by 13% in 2023 (see chart 1) from 9,092 to 10,311 tonnes. This is the highest level of mussel production recorded in Scotland. The greatest regional contribution to mussel production was from Shetland, accounting for 8,694 tonnes (84%) of Scotland’s total. Pacific oyster production for the table decreased by 4% from 2023 (from 4,087,000 to 3,927,000 shells). Table production of farmed king scallops decreased by 38% while table production of native oysters increased by 2%. Historical data for all shellfish species show that production levels vary year on year. This can be due to a number of different factors such as poor spat fall, algal toxins, poor growth, adverse weather and fluctuations in market prices.
Prices of farmed shellfish fluctuated throughout the year. Their value at first sale was estimated from the following figures obtained from the shellfish farming sector. These vary with demand, level of production and geographical area of origin. The average price of Pacific oyster was £0.61 per shell; native oyster, £0.93 per shell; king scallop, £2.18 per shell; and common mussel £1,116 per tonne. The value of the table trade is estimated from the production figures shown in Table 2 and 3.
Common mussel: £11.5 million
Pacific oyster: £2.4 million
Native oyster: £0.1 million
King scallop: £0.1 million
In 2023, the total value at first sale for all species was calculated at approximately £14.1 million, an increase of 36% from the £10.4 million estimated in 2022.
Contact
Email: MD.Productionsurvey@gov.scot
There is a problem
Thanks for your feedback