Scottish Shellfish Farm Production Survey 2023
This report is based on the returns of an annual survey questionnaire sent to all active authorised shellfish farming businesses in Scotland. Statistics on employment, production and value of shellfish from Scottish shellfish farms are presented.
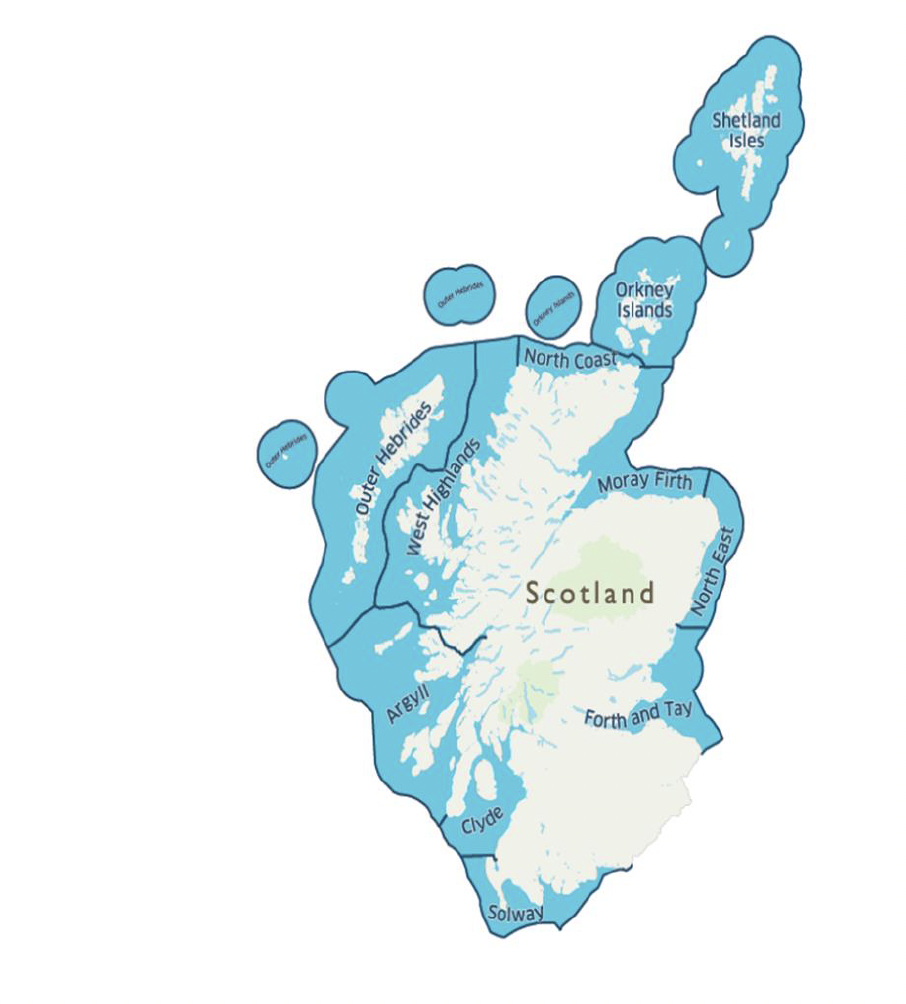
Scottish Marine Regions
The Marine (Scotland) Act 2010 introduced integrated management of Scotland's seas. The creation of a National Marine Plan, as required by the Act, sets the wider context for planning within Scotland including what should be considered when creating regional marine plans. Eleven Scottish Marine Regions have been created under the Act (figure 3) which cover sea areas extending out to 12 nautical miles.
To support the development of Regional Marine Plans by Regional Marine Planning Partnerships, tonnages/shell numbers and financial values of annual shellfish production for common mussel and Pacific oysters have been calculated for the regions defined under the Act.
Figure 3 Map shows locations of Scottish Marine Regions.
In order to maintain commercial confidentiality, common mussel production values for Argyll & Clyde, and the West Highlands, Moray Firth & the North Coast were merged. Similarly, Pacific oyster production for the West Highlands & the North Coast and Orkney Islands & Shetland Isles were also required to be merged. Other shellfish species including native oyster (Argyll & Solway) and king scallop (Argyll & West Highlands) were produced, however, these figures cannot be attributed to Scottish Marine Regions due to commercial confidentiality. All Scotland data for Other shellfish species can be found in Data Source: Scottish Shellfish Farm Production Survey 2023, Supplementary Tables, Table 8.
The data for charts 15-18 can be found in Data Source: Scottish Shellfish Farm Production Survey 2023, Supplementary Tables, Tables 9 and 10.
Chart 15 Common mussel production by Scottish Marine Region (Tonnage).
Chart shows production tonnage in each Scottish Marine Region – West Highlands & North Coast, Argyll & Clyde, Outer Hebrides and Shetland Isles from 2014 to 2023.
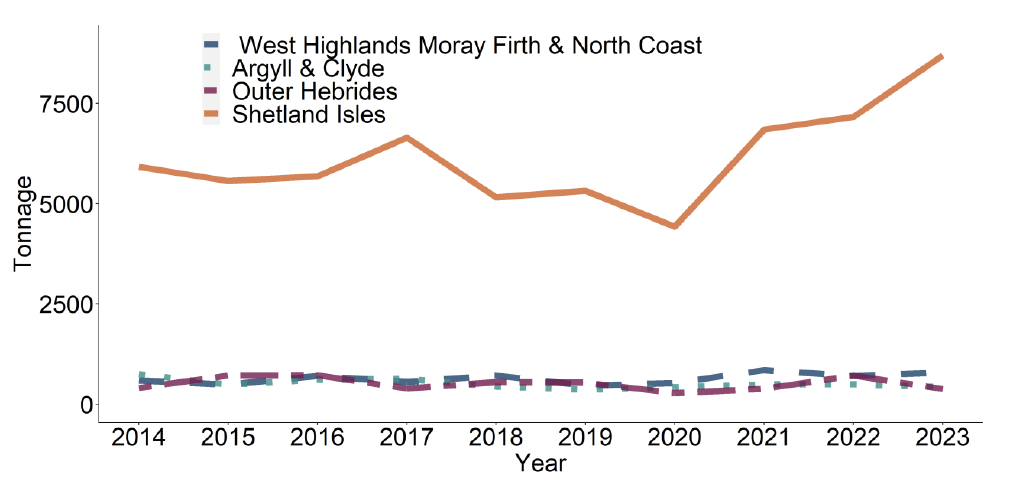
Chart 16 Common mussel production by Scottish Marine Region (Value in GBP)
Chart shows production value in GBP in each Scottish Marine Region – West Highlands & North Coast, Argyll & Clyde, Outer Hebrides and Shetland Isles from 2014 to 2023.
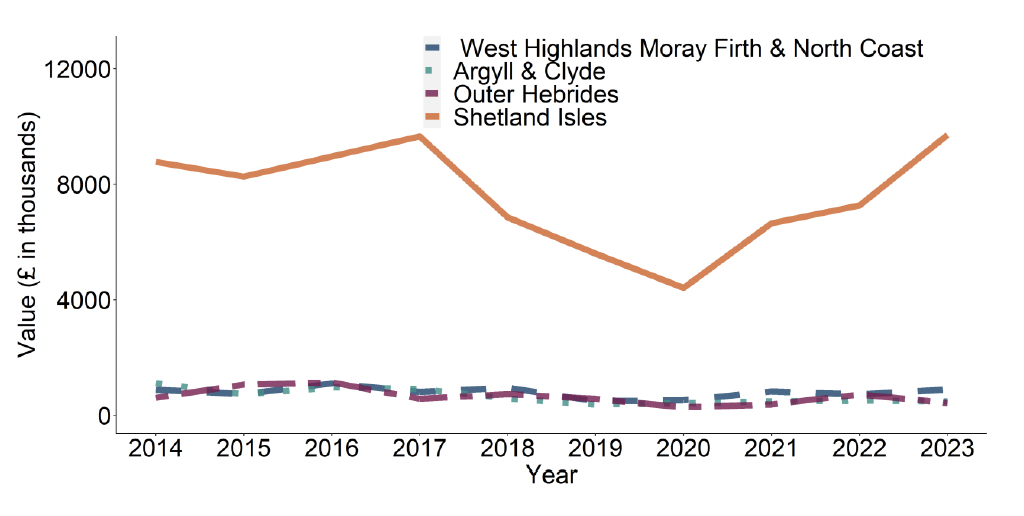
Chart 17 Pacific oyster production by Scottish Marine Region (in thousands of shells).
Chart shows production in thousands of shells for each Scottish Marine Region – Argyll, Clyde, Orkney Islands & Shetland Isles, Outer Hebrides and West Highlands & North Coast from 2014 to 2023.
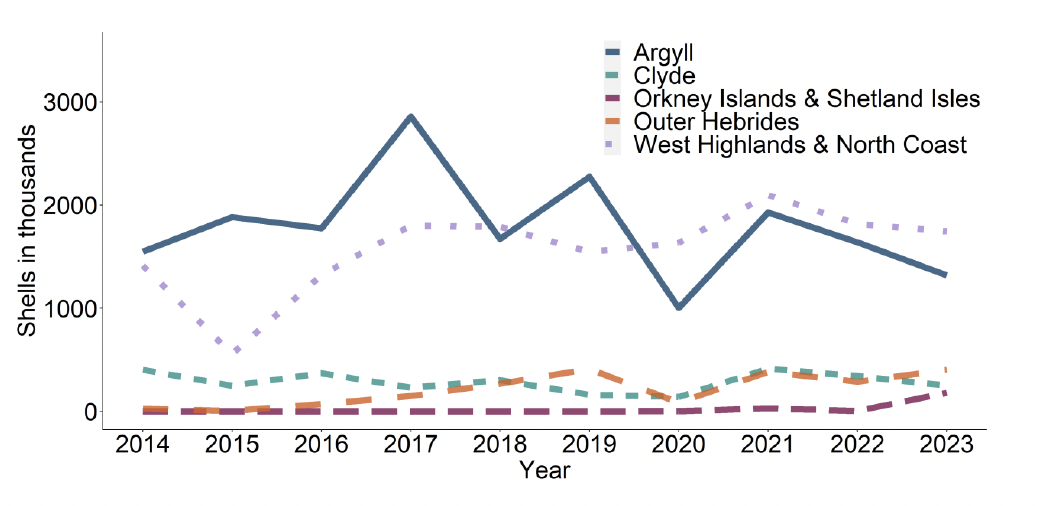
Chart 18 Pacific oyster production by Scottish Marine Region (Value in GBP)
Chart shows production value in GBP for each Scottish Marine Region – Argyll, Clyde, Orkney Islands & Shetland Isles, Outer Hebrides and West Highlands & North Coast from 2014 to 2023.
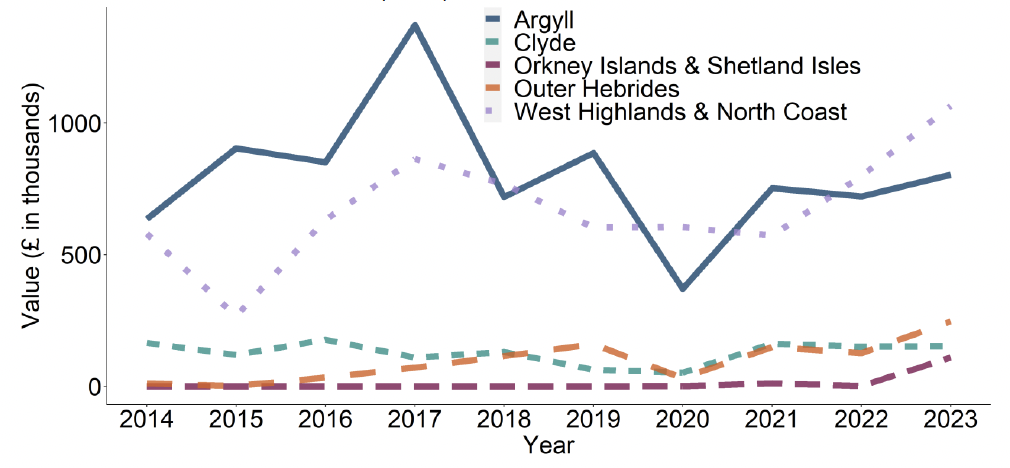
Data Source: Scottish Shellfish Farm Production Survey 2023, Supplementary Tables, Table 9 and 10.
Contact
Email: MD.Productionsurvey@gov.scot
There is a problem
Thanks for your feedback