Scottish Social Attitudes 2019: attitudes to government and political engagement
Findings from the 2019 Scottish Social Attitudes Survey (SSA), conducted between August 2019 and March 2020, on attitudes to government, the economy, the health service, levels of tax and spend, government priorities and political engagement
Chapter 3 – views on level of tax and spend, government priorities, the health service and the economy
This chapter presents views on the level of tax and spend, government priorities, the health service and the economy. The findings cover the following areas:
- Attitudes towards the level of taxation and government spending
- Attitudes towards the redistribution of income
- Priorities for government action
- Level of satisfaction with the health service, whether standards have improved or fallen and who is responsible for this
- Perceived changes to the economy and standard of living in Scotland and who is responsible for this
There are time series for all of the questions included in this chapter. For each of the questions, subgroup analysis focuses on the extent to which the attitudes of particular subgroups have driven overall recorded trends over time.[1]
Attitudes towards the level of taxation and government spending
In 2019 respondents were asked about their views on what the government's policy on taxation and spending should be, a question that has appeared regularly on SSA over the previous 20 years. The exact wording of the question is:
'Suppose the government had to choose between the three options on this card. Which do you think it should choose?'
Answer options were:
- Reduce taxes and spend less on health, education and social benefits
- Keep taxes and spending on these services at the same level as now
- Increase taxes and spend more on health, education and social benefits
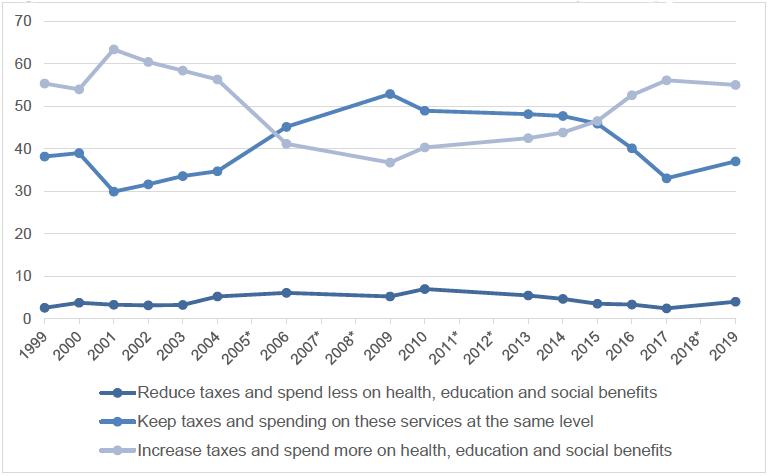
The majority (55%) of people in Scotland felt that taxation and spending should be increased, with just under 4 in 10 (37%) feeling it should be kept the same, and 4% thinking taxes and spending should be reduced. These results represent very little change from when the question was last asked in 2017, where the proportion who thought that taxation and spending should increase, be kept the same and be reduced was 56%, 33% and 2% respectively.
Figure 3.1 shows how attitudes to taxation and spending have changed over the past 20 years. Reducing the level of taxation and spending has consistently been the least popular response option with the proportion selecting this option never higher than 1 in 10. However, the proportion believing that the level of taxation and spending should either be increased or kept the same has fluctuated over time. Interestingly attitudes in this area have come full circle over the past 20 years, with the proportions of each of the three possible responses to this question being almost identical in 1999 and 2019.
For the first five years the question was asked (1999-2004) the proportion that thought taxation and spending should be increased was higher than the proportion thinking it should be kept the same. This changed in 2006 when for the first time the proportion who thought taxation and spending should be kept the same (45%) was higher than the proportion who thought taxation and spending should be increased (41%).
In 2009, the first survey after the 2008 financial crisis, the proportion who thought taxation and spending should be kept the same reached a peak of 53% and has steadily reduced since then with those who thought taxation and spending should be increased again becoming predominant after 2015.
Base: all respondents
*Data not collected in these years
Have particular subgroups driven attitudinal changes over time in levels of support for increasing taxation and spending?
Changes in the level of support for increasing taxation and spending over time have been driven by certain subgroups more than others. Exploring the decline in support for increasing taxation and spending between 2000 and 2009 showed that support declined more markedly among those who expressed a preference for remaining part of the UK, a decline of 21 percentage points compared with a decline of 9 percentage points among those who indicated support for independence. There was also a fall in support amongst people with different levels of political engagement. In general the more interested people were in politics the greater the fall in their level of support for increasing taxation and spending – support among those with 'a great deal' or 'quite a lot' of interest in politics fell by 24 percentage points between 2000 and 2009 from 66% to 42%, compared with a fall of 13 percentage points from 47% to 33% for those with 'not very much' or 'none at all'.
After 2009, support for increasing taxation and spending has generally increased up to the latest data from 2019. In contrast to the preceding period, between 2000 and 2009, the rise in support for increasing taxation and spending between 2009 and 2019 was shown to be related to changes according to liberal-authoritarian attitudes.[2] The proportionate increase in the level of support for increasing taxation and spending was larger for those with the most liberal views than for those in the authoritarian group. Between 2009 and 2019, there was a 29-percentage point increase from 38% to 67% in the proportion of those with the most liberal views who supported the increase of taxation and spending compared with only a 12-percentage point increase from 36% to 48% among those in the authoritarian group.
Attitudes towards the redistribution of income
As well as being asked their attitudes towards taxation and spending, to gauge attitudes towards redistributive economic policies, respondents were also asked whether they agreed or disagreed with the following statement:
'Government should redistribute income from the better-off to those who are less well off'
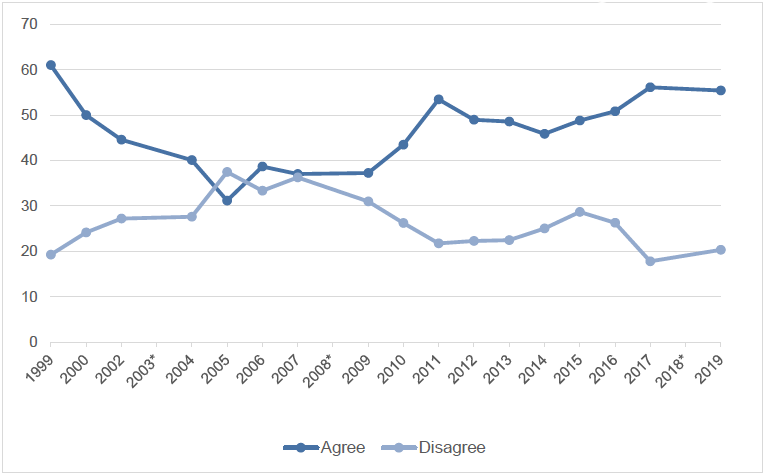
As shown in Table 3.2 below, in 2019 the majority of people in Scotland (55%) agreed that the government should redistribute income from the better off to the less well off, with one-fifth (20%) disagreeing that they should and just under a quarter (24%) neither agreeing nor disagreeing.
|
|
% |
|---|---|
| Agree strongly | 26 |
| Agree | 30 |
| Neither | 24 |
| Disagree | 13 |
| Disagree strongly | 7 |
| Unweighted base | 1022 |
Base: all respondents
The question on redistribution has been asked frequently since SSA started in 1999. Figure 3.2 shows how views on the issue have changed over time. Agreement with the statement was at its highest level when the question was first asked in 1999 then steadily declined until 2005, when for the first time the proportion disagreeing (37%) that the government should redistribute income to the less well-off was higher than the proportion agreeing (31%). Views remained stable up to 2009 but following the UK General Election in 2010 there was an increase until 2011 followed by a stabilisation in the proportions agreeing with the statement at around half of the population. This was matched by a roughly equal decline in the numbers disagreeing that the government should redistribute income to the less well off, with a fall of 20 percentage points between 2005 and 2017 from 37% to 18%.
Base: all respondents
*Data not collected in these years
Have particular subgroups driven changes over time in attitudes to whether government should redistribute income?
If these changes are examined in more detail, it is evident that certain groups are associated with these changes in attitudes over time. Between 2000 and 2005 there was an increase in the proportion of people disagreeing that the government should redistribute income to the less well-off and this increase was greater among those on the right of the political spectrum compared with those on the left.[3] In 2000, 50% of those on the right disagreed compared with 67% in 2005, the equivalent figures for those on the left were 3% and 7% respectively. Similar relationships were seen in the steady decrease in the proportion disagreeing between 2005 and 2019. The level of change in disagreement among those on the right and the centre of the political spectrum was greater in this period than for those on the left. As such, it appears that those on the left of the political spectrum have been more consistent in their views on redistribution over time, and it is fluctuations in others' opinions that were driving the overall change.
Interestingly, between 2005 and 2019 there were no clear differences in the level of change in disagreement by household income or whether someone felt they were struggling on their current income, although in 2019 there were significant differences by household income and whether someone was comfortable or struggling on their present income. Those in the lowest income group (61%) and those struggling on their present income (71%) were more likely to say that the government should redistribute income to the less well off than those in the highest income group (53%) and those who said they were living comfortably (54%).
Priorities for government action
Respondents were asked what they think should be the Scottish Government's highest priority, that is the most important thing it should try and do. Multiple response options were given across a variety of areas, including the option to write in a priority that had not been listed. Table 3.2 below shows that in 2019 'help the economy grow' topped the list of priorities at 23%, followed by 'improve standards of education' at 18% and 'improve people's health' at 17%.
|
|
% |
|---|---|
| Help the economy grow | 23 |
| Improve standards of education | 18 |
| Improve people's health | 17 |
| Improve housing | 11 |
| Reduce inequality | 10 |
| Reduce environmental problems | 8 |
| Cut crime | 7 |
| Improve public transport | 3 |
| Other (Write in) | 4 |
| Unweighted base | 1022 |
Base: all respondents
How did attitudes differ between subgroups in 2019?
There were interesting differences in the order of priorities between certain subgroups in 2019. There was a difference between the views of men and women in relation to the top overall priority of helping the economy grow, as 27% of men chose this as the highest priority compared with only 19% of women. Those in the lowest income group were more likely to select cutting crime as a government priority than those on higher incomes, 13% of the former selected this compared with between 4% and 6% of those with higher household incomes. This was also the case for Conservative supporters – 16% of whom placed cutting crime as their first priority compared with fewer than 1 in 10 of those identifying with other political parties.
As might be expected, there were some noticeable differences between how people ranked government priorities and their position on the liberal-authoritarian scale. These were evident in the less commonly chosen responses. Although the top three priorities of both groups were the same as the wider population, those with the most liberal views were much more likely than authoritarians to select 'reduce environmental problems', with 13% of them choosing it as a priority compared with less than 5% of those in the authoritarian group. This contrasts with 'cutting crime', where 12% of authoritarians selected this compared with only 1% of liberals.
Table 3.3 shows responses to this question since it was first asked on SSA in 2004. It should be noted that any comparisons with previous years must be caveated as the wording of one answer option changed in 2019 (from 'improve the environment' to 'reduce environmental problems') and a new answer option (reduce inequality) was introduced from 2015. However, while keeping this in mind, there are noticeable changes in how people have ordered government priorities both from the last time this question was asked in 2017 and since it was first asked in 2004.
|
|
2004 | 2005 | 2006 | 2007 | 2009 | 2010 | 2011 | 2013 | 2015 | 2017 | 2019 |
|---|---|---|---|---|---|---|---|---|---|---|---|
|
|
% | % | % | % | % | % | % | % | % | % | % |
| Help the economy to grow faster | 16 | 18 | 14 | 16 | 33 | 37 | 36 | 35 | 32 | 22 | 23 |
| Cut crime | 22 | 23 | 24 | 27 | 17 | 18 | 17 | 10 | 4 | 5 | 7 |
| Improve people's health | 27 | 26 | 24 | 17 | 13 | 15 | 16 | 18 | 17 | 19 | 17 |
| Improve standards of education | 17 | 15 | 16 | 12 | 15 | 12 | 15 | 18 | 22 | 26 | 18 |
| Improve housing | 12 | 10 | 12 | 16 | 13 | 9 | 11 | 13 | 15 | 15 | 11 |
| Improve the environment* | 4 | 4 | 6 | 5 | 3 | 3 | 2 | 1 | 1 | 2 | 8* |
| Improve public transport | 1 | 1 | 2 | 1 | 1 | 1 | * | 1 | 2 | 1 | 3 |
| Reduce inequality | n/a | n/a | n/a | n/a | n/a | n/a | n/a | n/a | 4 | 7 | 10 |
| Unweighted base | 1637 | 1549 | 1594 | 1508 | 1482 | 1495 | 1197 | 1497 | 1288 | 1234 | 1022 |
Base: all respondents
*Prior to 2019 the answer option was 'improve the environment', in 2019 the wording changed to 'reduce environmental problems'
As would be expected, there was a change in the ordering of priorities after the financial crisis of 2008. 'Helping the economy grow' became the top priority for people in Scotland in 2009 and has remained so, apart from in 2017 where it was second priority. While 'cutting crime' was consistently one of the top two priorities before 2009 the proportion choosing it has steadily decreased since then and remains low in 2019 at 7%. Since 'reduce inequality' was introduced as an answer option in 2015 the numbers selecting it as a priority have steadily increased by 3 percentage points each year the question has been asked: 1 in 10 (10%) chose it in 2019 compared with 4% in 2015.
'Improving standards of education' did appear to be on a steady upward trajectory from only 12% selecting it as a priority in 2010 to it being the top priority at 26% in 2017. However, this steady rise has not continued into 2019, as the proportion of those selecting education fell by 8 percentage points between 2017 and 2019 to 18%, returning to the level recorded between 2004 and 2013. One priority that has increased markedly is 'reduce environmental problems', increasing 6 percentage points to 8% between 2017 and 2019. This is the highest it has been since the question was first asked in 2004, and contrasts with the low proportion of people prioritising the environment from 2009 onwards. However, it is not possible to say whether this is associated with the change of wording in 2019 from 'improve the environment' to 'reduce environmental problems'.
Level of satisfaction with the health service
To determine people's attitudes towards the health service in Scotland, respondents were asked both whether they were satisfied with the way the NHS runs and whether they thought the standard of the health service had increased or fallen from this time last year. As can be seen in Table 3.4 below, in general, people in Scotland in 2019 were satisfied with the way the NHS is running.
|
|
% |
|---|---|
| Very satisfied | 16 |
| Quite satisfied | 48 |
| Neither satisfied nor dissatisfied | 14 |
| Quite dissatisfied | 14 |
| Very dissatisfied | 6 |
| Unweighted base | 1022 |
Base: all respondents
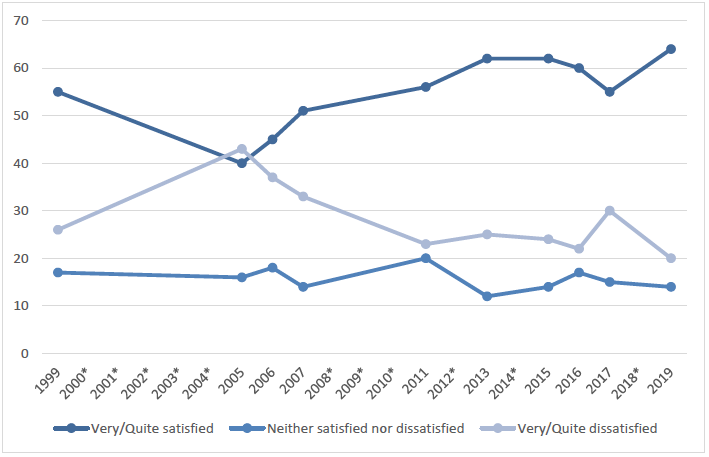
In 2019, over three times as many people were satisfied (65%) with the way the health service is run than were dissatisfied (20%). Satisfaction with the NHS was associated with whether people were struggling or comfortable on their present income. Those who reported that they were 'struggling' or 'really struggling' on their present income were more likely to say they were 'very' or 'quite dissatisfied' with the NHS compared with those who were living comfortably on their present income, 28% of the former reported being 'very' or 'quite dissatisfied' compared with 18% of the latter.[5]
Figure 3.3 shows changes in the responses to this question since it was first asked in 1999. Between 1999 and 2005, levels of satisfaction declined from 55% to 40%, while at the same time levels of dissatisfaction increased from 26% to 43%. Satisfaction with the health service then steadily increased from 2006 and in 2019 the gap between those saying they were 'very' or 'quite satisfied' with the health service and those saying they were 'very' or 'quite dissatisfied' stood at 45 percentage points, the widest it has ever been. The only year where people have been more dissatisfied than satisfied with the health service was 2005, since then there has been a steady increase in satisfaction up to 2013 when it plateaued. The difference between satisfaction and dissatisfaction increased markedly between 2006 and 2011 from 8 to 33 percentage points and has remained fairly high since then. In 2017 levels of satisfaction with the NHS declined, but this reversed in 2019 when satisfaction levels returned to a similar level to that recorded from 2013 to 2016.
Base: all respondents
*Data not collected in these years
Have particular subgroups driven attitudinal changes over time in levels of satisfaction with the way the NHS is run?
Exploring the increase in levels of satisfaction between 2005 and 2019 shows that the increase was similar across groups although there were two noticeable differences. Levels of satisfaction with the health service did increase more among men than women between 2005 and 2011: a 20-percentage point increase among men (from 40% to 60%) compared with a 13 percentage point increase among women (from 40% to 52%). However between 2011 and 2019 this trend was reversed and levels of satisfaction increased by 14 percentage points among women (from 52% to 67%) and by 2 percentage points among men (from 60% to 62%). There was also a party-political difference in the increase in the levels of satisfaction with the NHS from 2011 onwards. Between 2011 and 2019 the level of increase in satisfaction among those identifying with a political party was greatest among SNP supporters at 12 percentage points (from 57% to 69%), while the proportion of Conservatives' stating they were satisfied with the health service remained consistent during the same period (65% in 2011 and 64% in 2019).
Standards in the health service
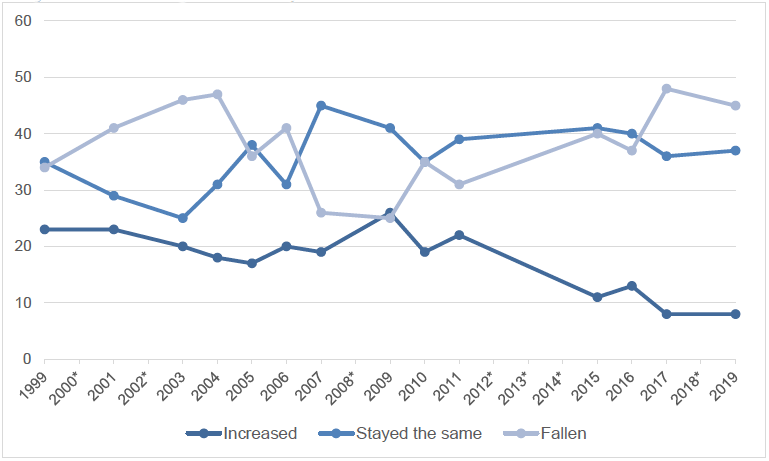
As well as asking about their satisfaction with the health service, respondents were also asked whether they thought the standard of the health service had increased or fallen in the past year. The most common response (see Table 3.5 below) was that the standard of the health service had stayed the same (37%), but people were more likely to say the standard had fallen 'a little' or 'a lot' (45%) than to say that it had increased 'a little' or 'a lot' (9%).
|
|
% |
|---|---|
| Increased a lot | 1 |
| Increased a little | 7 |
| Stayed the same | 37 |
| Fallen a little | 31 |
| Fallen a lot | 14 |
| Unweighted base | 1022 |
Base: all respondents
As Figure 3.4 demonstrates, 2009 was something of a turning point regarding attitudes in this area: it was the only year in which the proportion stating that the standard of the health service had increased 'a little' or 'a lot' (26%) was higher than the proportion stating that it had fallen 'a little' or 'a lot' (25%). Since 2009 there has been a steady increase in the proportion stating that the standard of the health service has fallen in the past year and a steady decrease in the proportion stating that it has increased, while the proportion saying it has stayed the same has been fairly consistent after peaking in 2007. 'Stayed the same' was the most popular response from 2007 to 2016, after which it was overtaken by fallen 'a little' or 'a lot'. In general, between 1999 and 2011 the proportion stating that the standard of the health service had increased was around 20%, but since 2015 this has declined steadily over time and since 2015 has been closer to 10%, a trend which the 2019 figure continues.
Base: all respondents
*Data not collected in these years
A person's satisfaction with the health service was related to whether they felt the standard of the health service increased or fell in the previous year, as shown in Table 3.7 below. Over 8 in 10 (82%) who said that the standard of the health service had increased in the past year were either 'very' or 'quite satisfied' with the NHS. However, even among those who said that the standard had fallen, 51% were still either 'very' or 'quite satisfied' with the NHS. Around a third (32%) of those who felt that the standard of the NHS had fallen in the past year were 'quite' or 'very dissatisfied' with the NHS, this compares with only 8% who thought that the standard of the NHS had increased in the past year. The majority (78%) of those who felt that the standard of the NHS had 'stayed the same' were also satisfied with it, compared with only 9% who were dissatisfied.
|
|
Increased a lot/little % | Stayed the same % | Fallen a little/lot % |
|---|---|---|---|
| Very satisfied | 36 | 23 | 8 |
| Quite satisfied | 47 | 55 | 43 |
| Neither satisfied/dissatisfied | 10 | 12 | 16 |
| Quite dissatisfied | 5 | 8 | 21 |
| Very dissatisfied | 3 | 1 | 12 |
| Weighted base | 88 | 381 | 464 |
| Unweighted base | 81 | 371 | 483 |
Base: all respondents
Have particular subgroups driven changes over time in attitudes to the standard of the health service?
Since 2009, the proportion of people saying that the standard of the health service increased has fallen from 26% to 8% in 2019. There was a clear relationship between this decline and age, with the decrease in the proportion of people saying that the health service has improved falling further among older people compared with younger people. In 2009 a third (33%) of those aged 65 and over stated that the standard of the health service had increased compared with 21% of those aged 18 to 34 years old, whereas in 2019 this attitudinal gap has narrowed so that there was very little difference by age group in the proportions saying that the standard of the health service had increased.
Perceived responsibility for changes in standards in the health service in Scotland?
As well as being asked what they thought had happened to the standard of the health service in the past year, respondents were also asked:
What do you think this has been mainly the result of?
Mainly the result of the UK Government's policies at Westminster
Mainly the result of the Scottish Government's policies
For some other reason
These findings show the extent to which the public holds the Scottish Government responsible for the performance of the health service. In 2019, around 3 in 10 (29%) thought that the changes in standards in the health service in Scotland were 'mainly the result of the UK Government's policies' and a similar proportion thought they were 'mainly the result of the Scottish Government's policies' (31%).
Examining the views of people who think standards are improving and those who think standards are falling separately reveals a 'reverse symmetry' in views with the Scottish Government's policies appearing to get most of 'the credit' from people who say standards are increasing, and the UK Government's policies appearing to get most of 'the blame' from those who think standards have fallen. Just over half (51%) of those who thought the standard of the health service had increased in the past year said this was mainly the result of Scottish Government policies, compared with just over 1 in 10 (11%) who said this was mainly the result of UK Government policies (see Table 3.7 below). This contrasts with which administration's policies people 'blame' for a fall in standards in the health service with over 4 in 10 (44%) who thought standards in the health service had fallen in the past year believing this was mainly the result of UK Government policies compared with just under a fifth (19%) who believed this was mainly the result of Scottish Government policies.
|
|
Credit for increased standards in the NHS % | Blame for decreased standards in the NHS % |
|---|---|---|
| Scottish Government policies | 51 | 19 |
| UK Government policies | 11 | 44 |
| Some other reason | 26 | 18 |
| (Both UK Government and Scottish Government policies)^ | 7 | 15 |
| Weighted bases | 88 | 464 |
| Unweighted bases | 81 | 483 |
^ This answer option was not shown to respondents but was recorded where respondents gave this as a spontaneous response.
Base: all those who said the standard of health service had either increased or fallen
Figure 3.5 shows the changes over time in the views of those who thought standards in the health service had increased in the past year and whether they thought this was mainly the result of UK Government or Scottish Government policies (2006 to 2019). The proportion who thought that the Scottish Government's policies were mainly responsible for the increase in standards in the health service steadily increased from 2006 to 2011. Since 2011, consistently over half of those who thought the standard of the health service had increased have 'credited' the Scottish Government's policies for this increase. The proportion 'crediting' the UK Government's policies fluctuated from 2006 to 2011 before stabilising in the low to mid-teens (11% to 16%) after 2011.
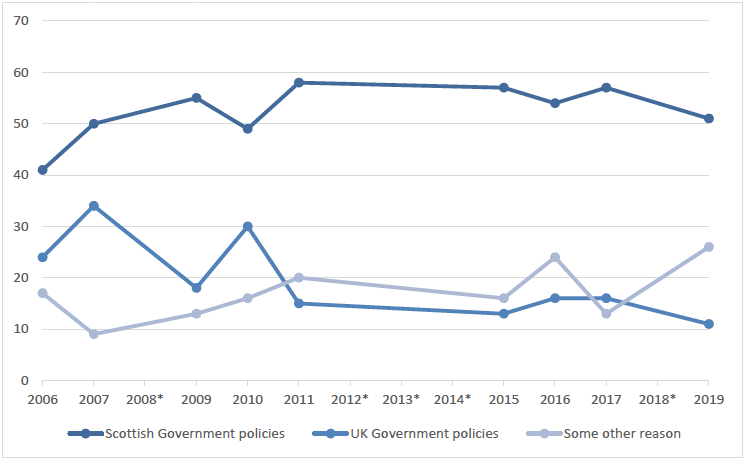
Base: all who said the standard of the health service had increased
*Data not collected in these years
Figure 3.6 shows changes among those who thought that standards had fallen in the health service by who believed this was due to UK Government or Scottish Government policies from when the questions were first asked in 2006. Just as the proportion who thought that the Scottish Government's policies were responsible for an increase in standards in the health service reached a peak in 2011, so did the proportion who thought that the UK Government's policies were responsible for a fall in standards in the health service. With the exception of this peak in 2011, the proportions believing that the UK Government's policies were responsible for a fall in standards have been between 40% and 50%, and the 44% figure recorded in 2019 was in line with these previous results. There was an increase in the proportion of people in Scotland who believed that Scottish Government policies were responsible for a fall in standards between 2015 (19%) and 2017 (27%) but at 19% the proportion believing that the Scottish Government's policies were responsible for a fall in standards in 2019 has returned to the 2015 level. With the exception of 2016 and 2017, the proportion believing that Scottish Government policies were responsible for a fall in standards has been 20% or below each year the question has been asked.
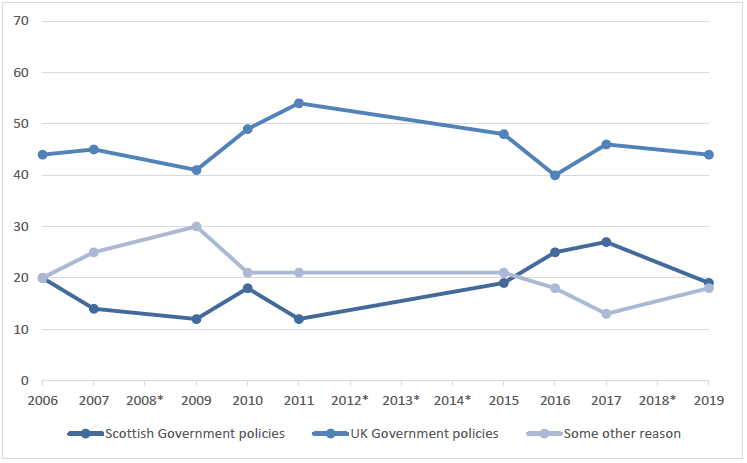
Base: all who said the standard of the health service had fallen
*Data not collected in these years
Views on the economy and standard of living
Respondents were asked both whether Scotland's economy had become stronger or weaker in the previous year and if their standard of living had increased or fallen in the same period. More people (42%) thought the Scottish economy was weaker than at the same time last year than thought it was stronger (17%), though 28% thought it had stayed the same (see Table 3.8).
|
|
% |
|---|---|
| A lot stronger | 2 |
| A little stronger | 15 |
| Stayed the same | 28 |
| A little weaker | 34 |
| A lot weaker | 8 |
| Unweighted base | 1022 |
Base: all respondents
Respondents were also asked whether the standard of living in Scotland had increased or fallen in the previous year. Table 3.9 below shows that around half (49%) of people in Scotland felt the general standard of living had fallen 'a little' or 'a lot' in the past year compared with 16% who thought it had increased.
|
|
% |
|---|---|
| Increased a lot | 3 |
| Increased a little | 13 |
| Stayed the same | 30 |
| Fallen a little | 35 |
| Fallen a lot | 15 |
| Unweighted base | 1022 |
Base: all respondents
Figures 3.7 and 3.8 show changes over time in responses to the questions on the strength of the economy (since 2004) and the standard of living (since 1999). As would be expected, after the financial crisis of 2008 the proportion of people who said that the economy had grown weaker and that the standard of living had fallen in Scotland grew markedly.
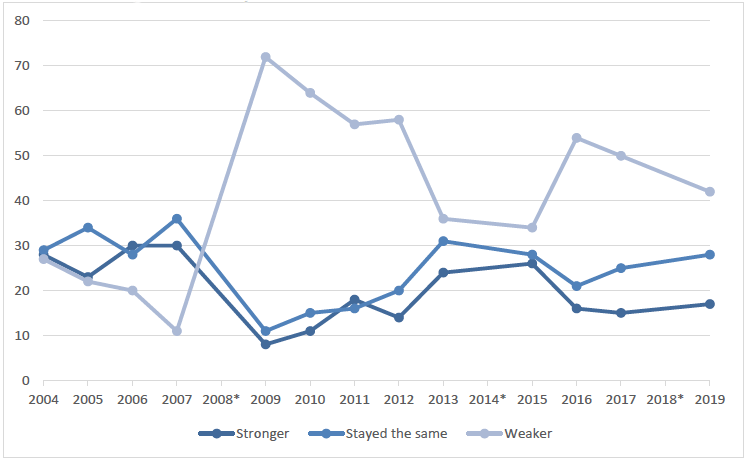
Base: all respondents
*Question was not asked in 2008, 2014 and 2018
The proportion saying that the economy had grown weaker peaked in 2009 (72%), slightly earlier than the peak in the proportion saying the standard of living had fallen in 2011 (68%). Since these peaks the proportion saying that the economy had grown weaker steadily fell up until 2015, then rose 20 percentage points between 2015 and 2016 from 34% to 54%, which may be explained by the economic uncertainty in the wake of the Brexit referendum. The proportion saying that the economy has grown weaker has steadily declined from 54% in 2016 to 42% in 2019. Between 2011 and 2016, the proportion saying that the standard of living had fallen steadily decreased to 36% in 2016. There was then an increase of 19 percentage points to 55% in 2017 with levels staying at a similar level in 2019 (50%).
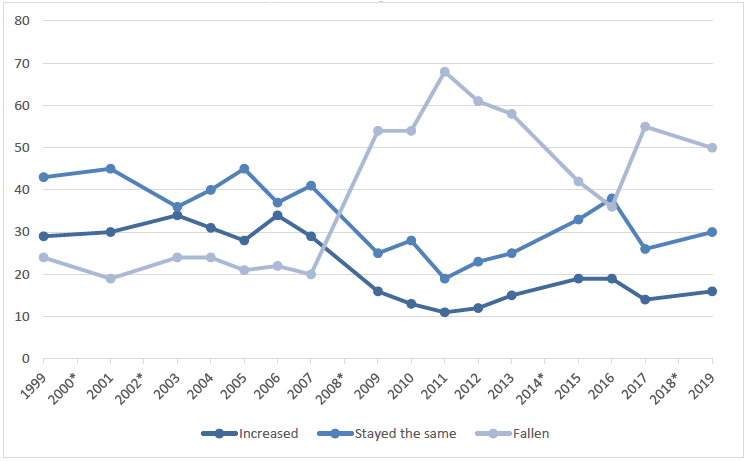
Base: all respondents
*Question was not asked in 2000, 2002, 2008, 2014 and 2018
Have particular subgroups driven changes over time in attitudes to the economy and standard of living?
Exploring the changes in the proportion saying that the economy had grown weaker or the standard of living had fallen up until 2009, certain demographic relationships in the change are evident. For both questions the higher the household income the greater the increase in the proportion saying that either the economy had grown weaker or that the standard of living had fallen. For example, there was a 47-percentage point increase between 2001 and 2009 in the proportion of those in the highest income group who thought the standard of living had fallen compared with only a 29-percentage point increase among those in the lowest income group.
There was a relationship between age and views on whether the economy had grown stronger or weaker, with the younger age groups showing a greater change over time in the proportion thinking the economy had grown weaker. There was no similar relationship found between age and the proportion saying the standard of living had fallen in the same period. In 2004, 20% of those aged 18 to 34 years old compared with 29% of those aged 65 and over thought the economy had grown weaker in the previous 12 months. These proportions increased by 54 percentage points among the youngest age group compared with a 30-percentage point increase among the oldest age group between 2004 and 2009.
Just as the increase between 2004 and 2009 in the proportion thinking the economy had got weaker in the past year was greater among younger people, so was the decline in the proportion thinking it had got weaker between 2009 and 2019. The proportion of the youngest age group who thought the economy had weakened declined from 75% in 2009 to 36% in 2019, a 39-percentage point drop, compared with a 15-percentage point drop among those aged 65 and over. The decline was also greater among those in the highest income group (a 41-percentage point decline) compared with those in the lowest income group (a 23 percentage point decline). There was a 45-percentage point decline in the proportion of those with degree-level qualifications who thought the economy had got weaker, compared with only an 11-percentage point drop among those with no formal qualifications. In 2009, a similar proportion of people who were struggling on their present income and those who were comfortable said that the economy had grown weaker, whereas in 2019, 53% of those struggling on their current income thought the economy had grown weaker in the past year compared with 40% of those who were living comfortably. There was no great difference in the change by political party affiliation, though there was something of a right-left split. The proportion of those on the right of the political spectrum who said that the economy had grown weaker in the past year fell by a greater amount (39 percentage points) than for those on the left (24 percentage points).
Between 2009 and 2019, although the proportion of people who felt that the standard of living had fallen remained relatively stable (54% in 2009 compared with 49% in 2019), there was, however, noticeable differences in the change in the proportion of people who identified with different political parties. The proportion of SNP supporters who felt the standard of living had fallen decreased between 2009 and 2019 by 8 percentage points, whereas for Conservatives the proportion fell by 16 percentage points.
Perceived responsibility for changes to the economy and living standards?
SSA 2019 also asked respondents whether perceived changes in the economy and standard of living were mainly the result of the UK Government's policies, the Scottish Government's policies or for some other reason. In 2019, the same proportion thought that recent economic performance was 'mainly the result of the UK Government's policies' as thought it was 'mainly the result of the Scottish Government's policies' (31%). Whereas nearly 4 in 10 (38%) thought that changes in living standards were 'mainly the result of the UK Government's policies' compared with a quarter (25%) who thought they were 'mainly the result of Scottish Government's policies'.
SSA findings from 2006 onwards have shown that those who believed that the economy is getting stronger and the standard of living is increasing were more likely to 'credit' this to Scottish Government than to UK Government policies. However, among those who thought things were getting worse, the reverse was the case, with relatively few people 'blaming' the Scottish Government's policies. This pattern was also observed in SSA 2019 with a stronger economy and an increased standard of living being viewed as more likely to be the result of Scottish Government policies than UK Government policies.
Table 3.10 below shows that the distribution of responses was broadly similar among those who thought the economy had become weaker or the standard of living had decreased, with over half of people in Scotland believing they were the result of UK Government policies. However, there was a divergence in whose policies people 'credited' for a stronger economy compared with who they 'credited' for an increased standard of living. The Scottish Government's policies were more likely to be viewed as responsible for a stronger economy (68%) than an increased standard of living (44%), and people were more likely to say that an increase in the standard of living was mainly the result of 'some another reason' (28%) besides Scottish or UK Government policies than they were when it came to a stronger economy (15%).
|
|
Credit for stronger economy % | Credit for increased standard of living % | Blamed for weaker economy % | Blamed for decreased standard of living % |
|---|---|---|---|---|
| Scottish Government policies | 68 | 44 | 19 | 17 |
| UK Government policies | 11 | 19 | 54 | 57 |
| Some other reason | 15 | 28 | 12 | 12 |
| Both Westminster and SG | 4 | 4 | 14 | 13 |
| Weighted bases | 178 | 159 | 425 | 503 |
| Unweighted bases | 161 | 154 | 441 | 507 |
Base: all who said economy had grown stronger/weaker and all who said standard of living had increased/decreased in last year
Figure 3.9 and Figure 3.10 show whether people believe that UK Government or Scottish Government policies are responsible for the economy growing weaker or the standard of living falling since the questions were first asked in 2006. After the financial crisis of 2008, there was an increase in the proportion of people who believed that the weaker economy or the fall in living standards was mainly the result of UK Government policies. People in Scotland have been consistently more likely to believe that UK Government policies were responsible for a fall in standards of living than they have been to believe that UK Government policies were responsible for a weaker economy. The gap between the proportion who believed that UK Government and Scottish Government policies were responsible for a weaker economy steadily decreased after the Conservative-Liberal Democrat Coalition was elected in 2010, becoming closest in 2017 (39% 'blaming' the UK Government compared with 29% 'blaming' the Scottish Government) before diverging again in 2019, where 54% believed that UK Government policies compared with only 19% who believed Scottish Government policies were responsible for a weaker economy.
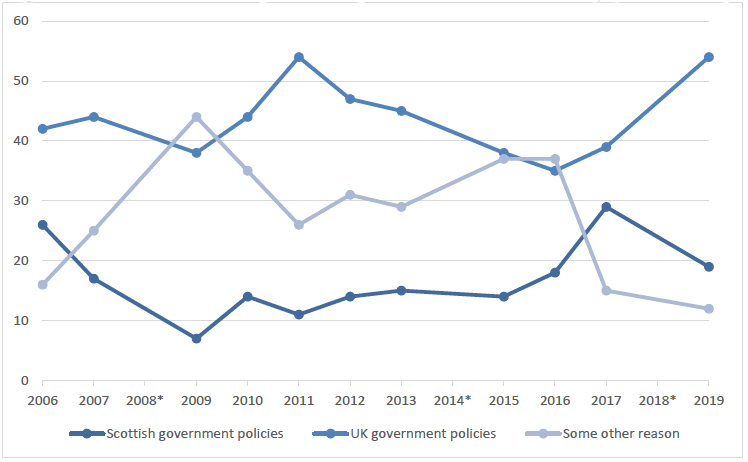
Base: all who said economy had grown weaker
*Question was not asked in 2008, 2014 and 2018
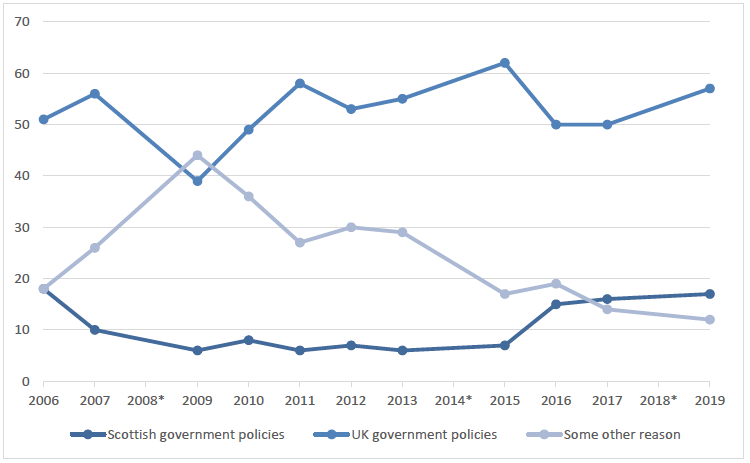
Base: all who said standard of living had fallen
*Question was not asked in 2008, 2014 and 2018
Figures 3.11 and 3.12 show the figures on whether people believe that UK Government or Scottish Government policies are responsible for the economy growing stronger or the standard of living increasing since 2006. A higher proportion of those who believe that the economy has grown stronger believe that this is mainly due to Scottish Government policies than believe this is due to UK Government policies. The proportion of those who believed that the stronger economy is mainly due to UK Government policies was around 1 in 5 between 2006 and 2010, which saw the first Coalition government. Since 2010 there has been a steady decline to around 1 in 10 in more recent years. The proportion of those who believed that the stronger economy was mainly due to Scottish Government policies has fluctuated more often but has increased steadily since 2013, from just under a half (47%) to just over two-thirds (68%) in 2019.
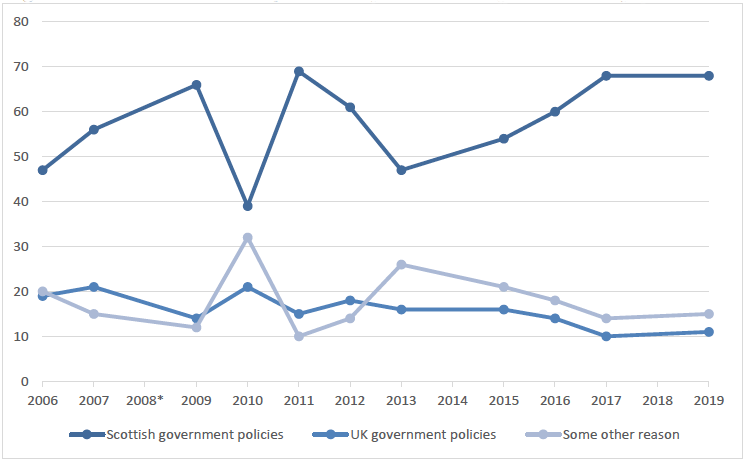
Base: all who said economy had grown stronger
*Question was not asked in 2008, 2014 and 2018
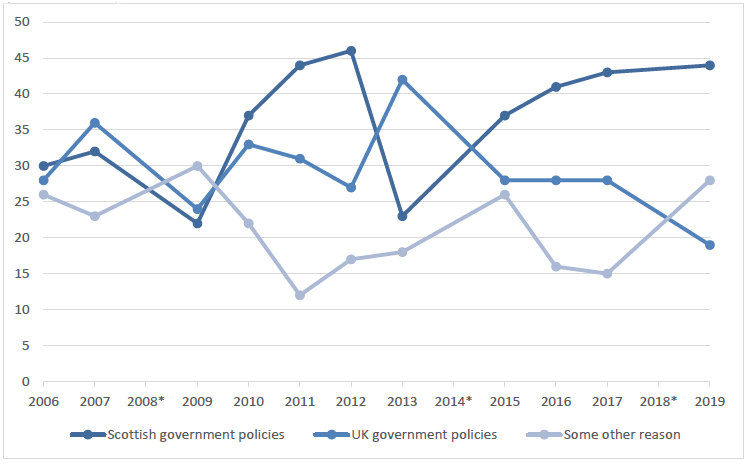
Base: all who said standard of living had increased
*Data not collected in these years
The figures for the standard of living, on the other hand, have generally been much closer. The proportions who believe that an increase in the standard of living is mainly the result of UK Government or Scottish Government policies were similar between 2006 and 2010. However, in 2011 and 2012, a higher proportion believed increases in the standard of living were mainly the result of Scottish Government policies. There was a peak in the proportion who believed that increases in the standard of living were mainly the result of UK Government policies in 2013, when 42% of people 'credited' the UK Government's policies for an increase in the standard of living compared with 23% who 'credited' the Scottish Government. But since 2015, a higher proportion have consistently believed that Scottish Government policies are responsible for increases in the standard of living compared with UK Government policies. The proportion believing that UK Government policies are responsible for an increase in the standard of living has declined from a high of 42% in 2013 to just 19% in 2019 when 44% believed that Scottish Government policies were responsible for an increase in the standard of living.
Contact
Email: social_research@gov.scot
There is a problem
Thanks for your feedback