Scottish Social Attitudes Survey 2023 - Attitudes to Government, the Economy, and the Health Service
Findings from the Scottish Social Attitudes Survey core module 2023.
In 2023, SSAS was run as a push-to-web survey for the first time in its history.
These questions covered attitudes to: government, the standard of living, the health service, and tax, spending, and redistribution.
3. Attitudes towards government
This chapter presents Scottish attitudes towards government and addresses the following questions:
- What level of trust do people have in the Scottish Government and UK Government on acting in Scotland’s best interests;
- Whether people feel that the Scottish Government and UK Government listen to people’s views before taking decisions;
- Whether people think that the Scottish Parliament gives ordinary people more or less say in how Scotland is governed;
- Whether people feel that the Scottish Government, UK Government, Scottish local councils, or the European Union have the most influence over how Scotland is run, and which they think ought to have the most influence.
Trust in government
Respondents were asked to what extent they trust the Scottish and UK Governments to act in Scotland’s best interest “just about always”, “most of the time”, “only some of the time” or “almost never”.
Table 1 - How much do you trust the Scottish Government to work in Scotland's best interests/ the UK Government to work in Scotland's best long-term interest?
- Just about always
- Scottish Government - 11%
- UK Government - 4%
- Most of the time
- Scottish Government - 36%
- UK Government - 17%
- Only some of the time
- Scottish Government - 33%
- UK Government - 32%
- Almost never
- Scottish Government - 19%
- UK Government - 45%
- Don't know/not answered
- Scottish Government - 2%
- UK Government - 2%
- Just about always/most of the time
- Scottish Government - 47%
- UK Government - 21%
- Only some of the time/almost never
- Scottish Government - 52%
- UK Government - 77%
- Unweighted base
- Scottish Government - 1574
- UK Government - 1574
Just under half of people (47%) said they trusted the Scottish Government to work in Scotland’s best interests “just about always” or “most of the time”, compared with 21% who said they trusted the UK Government to do so.
These questions have been asked in every SSAS since it began in 1999.
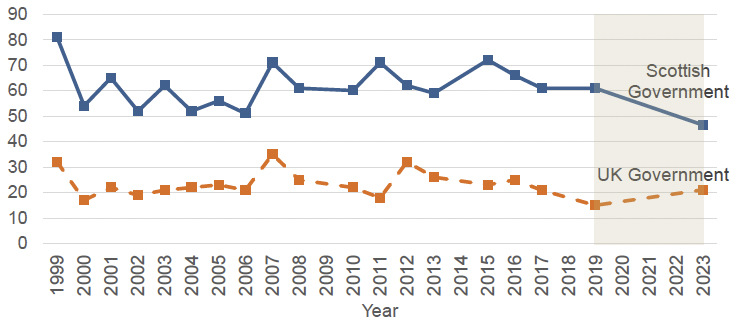
Percentage of people who said they trust the Scottish Government to work in Scotland's best interests/ the UK Government to work in Scotland's best long-term interest, 1999 to 2023. N.B. Shading indicates a change in methodology from face-to-face to push-to-web between 2019 and 2023.
The percentage who said they trust the Scottish Government “just about always” or “most of the time” fell from 61% in 2019 to 47% in 2023. It is now at its lowest level since the survey began and is the first year in which it dropped below 50%. It has declined steadily since 2015 (when it was 72%).
The equivalent figure for trust in the UK Government increased from 15% in 2019 to 21% in 2023.
The percentage who said they trust the Scottish Government “just about always” or “most of the time” has been greater in every year than the percentage who say the same of the UK Government.
Subgroup analysis
In 2023, younger people were more likely to trust the Scottish Government to act in Scotland’s best interest than older people (70% of people aged 16 to 24 compared with 38% of those aged 65 and over).[xiv]
Those on the left of the left-right political scale[xv] (53% of those on the left compared with 25% of those on the right), those in favour of Scottish Independence (69% of people in favour of Independence compared with 27% of those against) and supporters of the SNP were more likely to trust the Scottish Government.
Those on the right of the left-right scale (60% of those on the right compared with 15% of those on the left), those opposed to Scottish Independence (36% of people who oppose Independence compared with 6% of those in favour) and supporters of the Conservatives were more likely to trust the UK Government.[xvi]
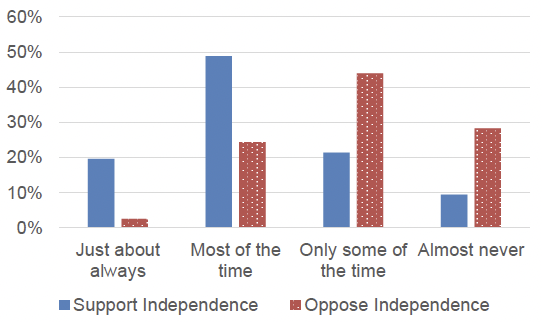
Trust in Scottish Government (percentage who trust/don’t trust) among those who support or oppose Scottish independence, 2023
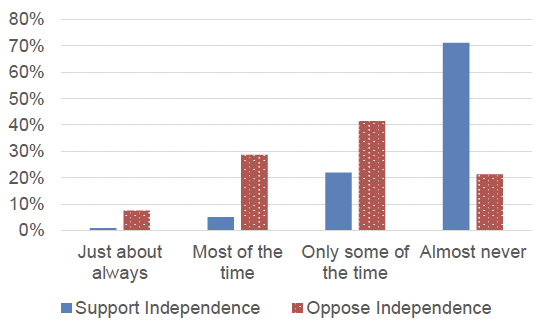
Trust in UK Government (percentage who trust/don’t trust) among those who support or oppose Scottish independence, 2023
How good is government at listening before taking decisions?
Respondents were asked how good they thought the Scottish and UK Governments were at listening to people’s views before taking decisions, choosing between the options “very good”, “quite good”, “not very good” or “not at all good”.
Table 2 - How good would you say the UK Government/Scottish Government is at listening to people’s views before taking decisions?
- Very good
- Scottish Government (%) - 4%
- UK Government (%) - 1%
- Quite good
- Scottish Government (%) - 31%
- UK Government (%) - 11%
- Not very good
- Scottish Government (%) - 40%
- UK Government (%) - 46%
- Not at all good
- Scottish Government (%) - 22%
- UK Government (%) - 40%
- Don't know/not answered
- Scottish Government (%) - 3%
- UK Government (%) - 2%
- Very/quite good
- Scottish Government (%) - 35%
- UK Government (%) - 12%
- Not very/not at all good
- Scottish Government (%) - 62%
- UK Government (%) - 86%
- Unweighted base
- Scottish Government (%) - 1574
- UK Government (%) - 1574
Just over a third (35%) of people thought that the Scottish Government was “very good” or “quite good” at listening to people’s views before taking decisions, compared with 12% for the UK Government.
These questions have been asked since 2004.
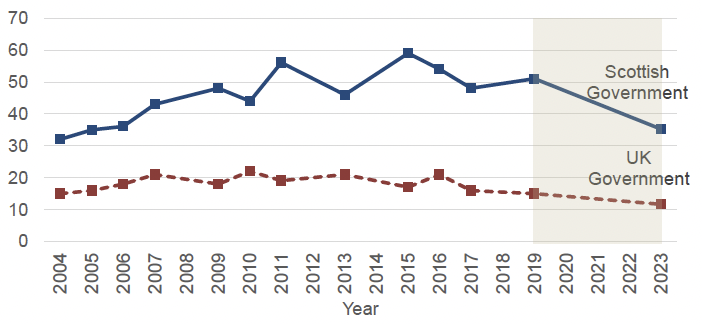
Percentage of people who said the Scottish Government/UK Government is very or quite good at listening to people’s views before it takes decisions, 2004 to 2023. N.B. Shading indicates a change in methodology from face-to-face to push-to-web between 2019 and 2023
The percentage of people who thought that the Scottish Government were “very good” or “quite good” at listening to people’s views before taking decisions fell from 51% in 2019 to 35% in 2023. It has declined from its peak in 2015 (59%).
The equivalent figure for people who thought the UK Government were “very good” or “quite good” at listening to people’s views before taking decisions fell from 15% in 2019 to 12% in 2023.
Subgroup analysis
Supporters of the SNP (66%) and Scottish Greens (55%) were more likely to think that the Scottish Government is very or quite good at listening to people’s views than supporters of the Conservatives (6%) or Labour (23%).[xvii]
People with a physical or mental health condition or illness were more likely to say very or quite good (42% compared with 33% of those without a physical or mental health condition), and less likely to say very or quite bad (55% compared with 64% of those without a physical or mental health condition), than those without.
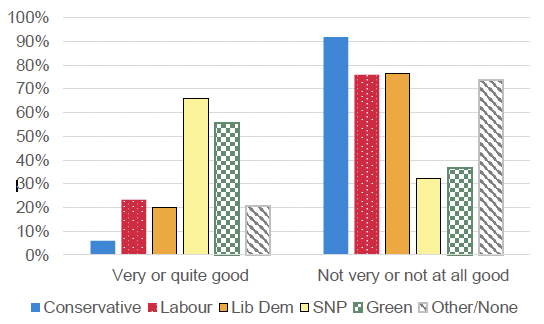
Percentage of people who thought the Scottish Government are very or quite good, or not very or not at all good, at listening to people's views before it takes decisions by political party affiliation, 2023
Supporters of the Conservatives were more likely to think that the UK Government is very or quite good at listening to people’s views – 30%, compared with 9% for both the SNP and Labour, 7% for the Liberal Democrats, and 5% for the Scottish Greens.
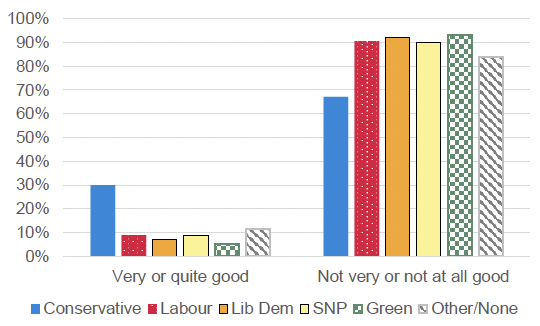
Percentage of people who thought the UK Government are very or quite good, or not very or not at all good, at listening to people's views before it takes decisions by political party affiliation, 2023
Whether the Scottish Parliament is giving ordinary people more or less of a say in how Scotland is governed
Respondents were asked whether they think the Scottish Parliament is giving ordinary people “more say”, “less say”, or “makes no difference” in how Scotland is governed.
Table 3 - Do you think that having a Scottish Parliament is giving ordinary people more or less say in how Scotland is governed?
- More say in how Scotland is governed - 45%
- Less say in how Scotland is governed - 14%
- No difference - 38%
- Don’t know/not answered - 3%
- Unweighted base - 1574
Just under half of people (45%) thought that the Scottish Parliament gives ordinary people more say, 14% thought it gives ordinary people less say, and 38% thought it makes no difference.
This question has been asked since 1999.
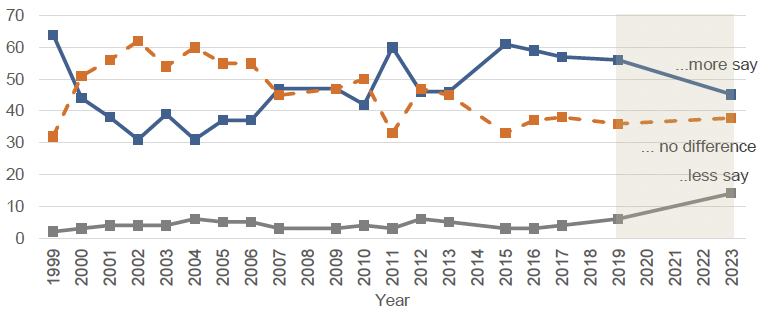
Percentage of people who thought that the Scottish Parliament gives ordinary people more say, or less say, or makes no difference in how Scotland is governed, 1999 to 2023. N.B. Shading indicates a change in methodology from face-to-face to push-to-web between 2019 and 2023.
The percentage of people who thought that the Scottish Parliament gives ordinary people more say has fallen from 56% in 2019 to 45% in 2023. This figure has varied since the survey began, but has seen a consistent decline since 2015 (when it was 61%).
The percentage of people who thought that the Scottish Parliament gives ordinary people less say increased from 6% in 2019 to 14% in 2023, its highest value since the survey began.
Subgroup analysis
Those with higher level of education were more likely to think that the Scottish Parliament gives ordinary people more say in how Scotland is governed (58% for those with degree qualifications or equivalent, compared with 41% of those with no qualifications).[xviii]
Those on the left were more likely to say that the Scottish Parliament gives ordinary people more say (50% compared to 24% of those on the right), as were those on the libertarian side of the libertarian-authoritarian scale[xix] (79% compared with 25% of those on the authoritarian side).
Who has/ought to have most influence over how Scotland is run?
Respondents were asked who they thought has the most influence over how Scotland is run, and who they thought ought to have the most influence.
Table 4 - Which of the following do you think has/ought to have the most influence over the way Scotland is run?
- Scottish Government
- Has most influence - 43%
- Ought to have most influence - 61%
- UK Government at Westminste
- Has most influence - 46%
- Ought to have most influence - 18%
- Local Councils
- Has most influence - 7%
- Ought to have most influence - 17%
- European Union
- Has most influence - 1%
- Ought to have most influence - 1%
- Don't know/not answered
- Has most influence - 3%
- Ought to have most influence - 3%
- Unweighted base
- Has most influence - 1574
- Ought to have most influence - 1574
Just under half (46%) of people thought that the UK Government has the most influence, and fewer than one in five (18%) thought that the UK Government should have the most influence. 43% of people thought that the Scottish Government has the most influence over how Scotland is run, with 61% thinking that the Scottish Government should have the most influence.
The percentage of people who thought that local councils or the European Union have the most influence were small (7% and 1% respectively). 17% of people thought that local councils should have the most influence, and 1% thought that the European Union should have the most influence.
These questions have been asked since 1999.
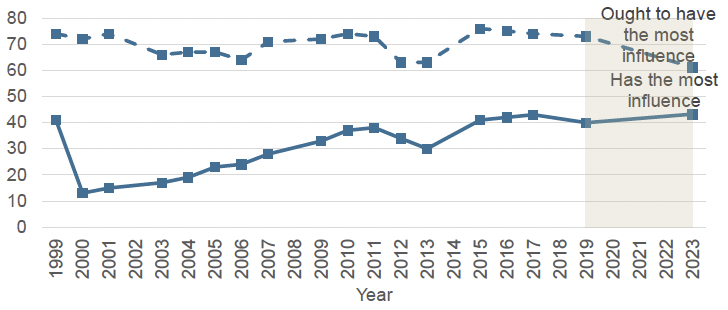
Percentage of people who thought that the Scottish Government has the most influence, or ought to have the most influence, over how Scotland is run, 1999 to 2023. N.B. Shading indicates a change in methodology from face-to-face to push-to-web between 2019 and 2023.
In every year since the survey began, more people have thought the Scottish Government ought to have the most influence over how Scotland is run than thought they do have the most influence. In 2023, this gap was 18 percentage points. The opposite is true for the UK Government, where people are more likely to think the UK does have the most influence, than ought to have the most influence (with a 28 percentage point gap in 2023).
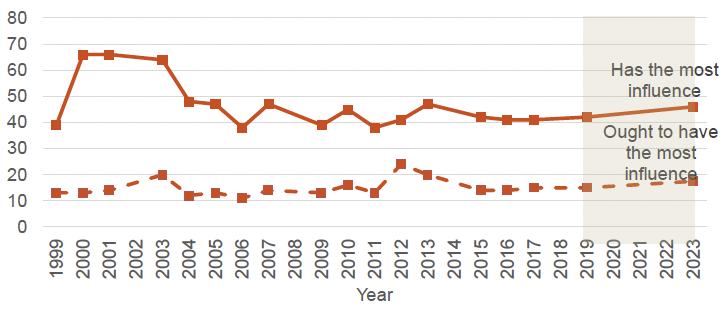
Percentage of people who thought that the UK Government at Westminster has the most influence, or ought to have the most influence, over how Scotland is run,1999 to 2023. N.B. Shading indicates a change in methodology from face-to-face to push-to-web between 2019 and 2023.
The percentage who think the Scottish Government does have the most influence has increased steadily over time.
Subgroup analysis
Older people were more likely to think that the Scottish Government has the most influence (55% for those aged 65 and over compared with 34% for those aged 16 to 24), and they were also more likely to think the UK Government at Westminster should have the most influence (22% for those aged 65 and over compared with 10% for those aged 16 to 24).[xx]
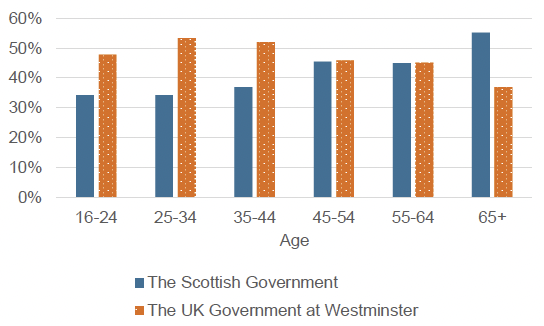
Percentage of people who thought the Scottish Government, or the UK Government, had the most influence over how Scotland is run by age, 2023
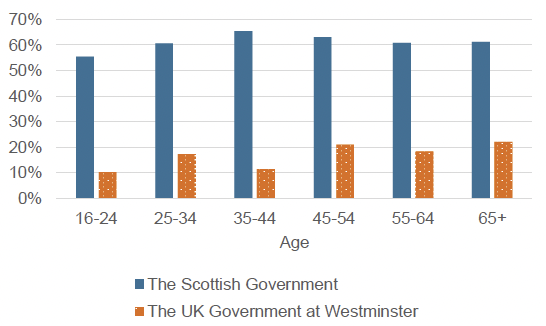
Percentage of people who thought the Scottish Government, or the UK Government, ought to have the most influence over how Scotland is run by age
Supporters of Scottish Independence were less likely (29% compared with 58% of people who oppose Independence) to think that the Scottish Government had the most influence, and were more likely to think (62% to 32% people who oppose Independence) that the UK Government at Westminster does instead.
Supporters of Scottish Independence (77% compared with 47% people who oppose Independence), and those on the left of the left-right scale (68% compared with 35% of those to the right), were more likely to think that the Scottish Government should have the most influence.
Contact
Email: CIMA@gov.scot
There is a problem
Thanks for your feedback