Scottish Social Attitudes Survey 2023 - Attitudes to Government, the Economy, and the Health Service
Findings from the Scottish Social Attitudes Survey core module 2023.
In 2023, SSAS was run as a push-to-web survey for the first time in its history.
These questions covered attitudes to: government, the standard of living, the health service, and tax, spending, and redistribution.
4. Views on government priorities, the health service, and the general standard of living
This chapter presents the findings from the following questions:
- Which do you think should be [the Scottish Government’s] highest priority, that is the most important thing it should try and do?
- How satisfied or dissatisfied are you with the way the National Health Service runs nowadays?
- Thinking back over the last twelve months, would you say that since then the standard of the health service in Scotland has increased or fallen? And what do you think this has mainly been the result of?
- Thinking back over the last 12 months, would you say that since then the general standard of living in Scotland has increased or fallen? And what do you think this has mainly been the result of?
Priorities for the Scottish Government
Respondents were asked to pick from a list of eight options what they thought Scottish Government’s highest priority should be:
- Improve the economy
- cut crime
- improve people’s health
- improve standards of education
- improve housing
- reduce environmental problems
- or reduce inequality.
Table 5 - Which do you think should be Scottish Government’s highest priority, that is, the most important thing it should try and do?
- Improve the economy - 42%
- Improve people’s health - 15%
- Improve housing - 10%
- Improve standards of education - 9%
- Reduce inequality - 8%
- Reduce environmental problems - 5%
- Cut crime - 4%
- Improve public transport - 2%
- Unweighted base - 1574
Over four in ten (42%) thought that improving the economy should be Scottish Government’s highest priority, by far the most frequently chosen option. The next most frequent was “improve people’s health” at 15%, followed by “improve housing” at 10%.
This question has been asked since 1999.
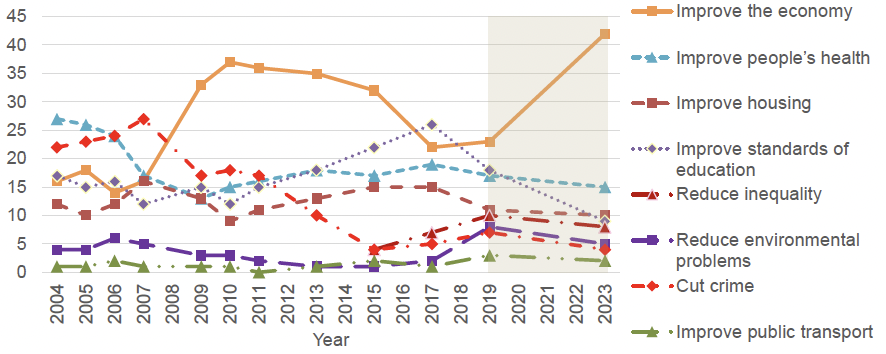
Percentage of people who said this should be Scottish Government’s highest priority, 2004 to 2023. N.B. Shading indicates a change in methodology from face-to-face to push-to-web between 2019 and 2023.
The percentage of people picking “improve the economy” increased from 23% in 2019 to 42% in 2023. It has been the most frequently picked priority since 2009, with the exception of 2017 where “improve standards of education” was more frequently picked. “Improve standards of education” had been increasing in popularity from 2010 until 2017, where it had steadily risen from 12% to 26%, and then fell to 18% in 2019. In 2023 this reached an all-time low at 9%.
Subgroup analysis
Those living in urban areas (according to the Urban Rural Classification 2020) were more likely to think that housing should be the Scottish Government’s top priority (12% compared with 4% for those in rural areas).[xxi]
Those on the left of the left-right scale were more likely to think reducing inequality was a top priority (12% compared with 2% for those on the right). They were also more likely to think health a top priority (15% compared with 9% for those on the right), and less likely to consider education a top priority (8% compared with 23% for those on the right).
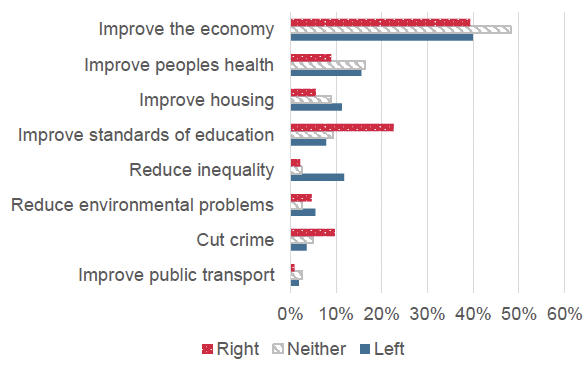
Percentage of people who thought this should be the Scottish Government’s highest priority by position on the left-right scale, 2023
Satisfaction with the National Health Service
Respondents were asked to rate their satisfaction with the way in which the National Health Service is run nowadays – “very satisfied”, “quite satisfied”, “neither satisfied nor dissatisfied”, “quite dissatisfied”, or “very dissatisfied”.
Table 6 - How satisfied or dissatisfied would you say you are with the way in which the National Health Service runs nowadays?
- Very satisfied - 2%
- Quite satisfied - 21%
- Neither satisfied nor dissatisfied - 25%
- Quite dissatisfied - 35%
- Very dissatisfied - 16%
- Very/quite satisfied - 23%
- Quite/very dissatisfied - 52%
- Unweighted base - 1574
Just over two in ten (23%) of people said they were very or quite satisfied with the way in which the NHS runs, compared with 52% who said they were very or quite dissatisfied.
This question has been asked since 1999.
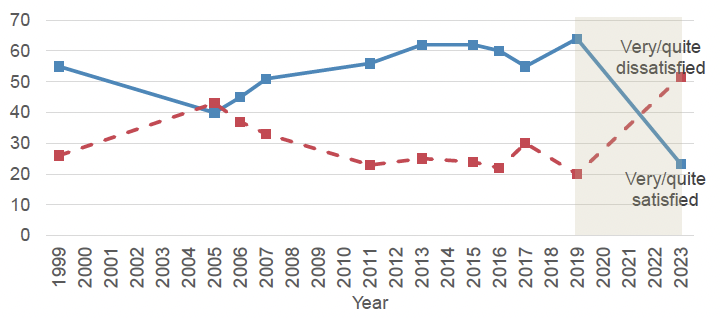
Percentage of people who were satisfied or dissatisfied with the way in which the National Health Service runs, 1999 to 2023. N.B. Shading indicates a change in methodology from face-to-face to push-to-web between 2019 and 2023.
The percentage of people who were very or quite satisfied with the way in which the NHS runs fell from 64% in 2019 to 23% in 2023, with a corresponding increase in those who were very or quite dissatisfied.
This is the first year since 2005 where more people were dissatisfied than satisfied with the way the NHS runs. This represents the lowest level for satisfaction and highest level for dissatisfaction since the timeseries began in 1999.
Subgroup analysis
Older people were more likely to be very or quite dissatisfied with the way the NHS is run (54% for those aged 65 and over, compared with 42% for those aged 16 to 24) and were more polarised (i.e. less likely to have no opinion).[xxii]
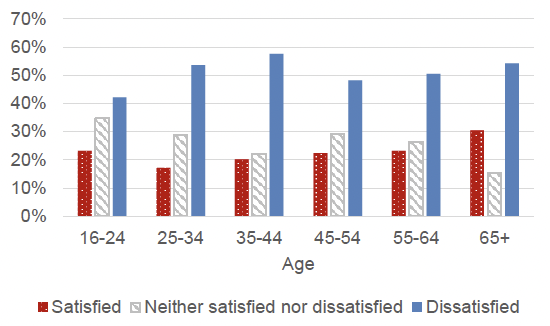
Percentage of people who were satisfied, dissatisfied or neither with the way the NHS is run by age, 2023
Supporters of Scottish Independence were less likely be very or quite dissatisfied, than those opposed (46% compared with 57%) and more likely to have no opinion.
Standard of the health service
Respondents were asked whether they thought the standard of the health service in Scotland had changed over the previous year – “increased a lot”, “increased a little”, “stayed the same”, “fallen a little” or “fallen a lot”.
Table 7 - Thinking back over the last twelve months, would you say that since then the standard of the health service in Scotland has increased or fallen?
- Increased a lot - 0%
- Increased a little - 5%
- Stayed the same - 25%
- Fallen a little - 40%
- Fallen a lot - 29%
- Increased a little/a lot - 6%
- Fallen a little/a lot - 69%
- Unweighted base - 1574
More than two thirds (69%) of people thought that the standard of the health service in Scotland had fallen either a little or a lot. One in four (25%) thought that standards had remained the same, and 6% thought that standards had increased.
This question has been asked since 1999.
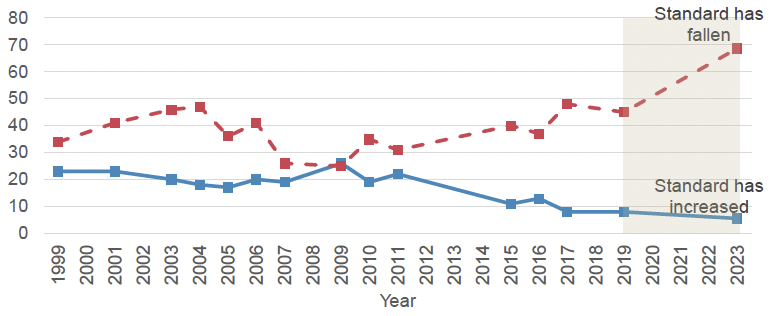
Percentage of people who thought the standard of the health service in Scotland had increased or fallen since previous year, 1999 to 2023. N.B. Shading indicates a change in methodology from face-to-face to push-to-web between 2019 and 2023.
The percentage who thought the standard of the health service had increased fell slightly from 8% in 2019 to 6% in 2023. This figure has declined from 26% in 2009.
The percentage who thought the standard of the health service had fallen increased from 45% in 2019 to 69% in 2023. This is the highest value since the survey began in 1999, and has increased from 25% in 2009.
Respondents were also asked to say whether they thought the change was a result of Scottish Government policies, UK Government policies, for some other reason, or both Westminster and Scottish Government equally. In previous years, this question was asked face-to-face by an interviewer and the “both Westminster and Scottish Government equally” option was not given to respondents – it was only recorded if the respondent suggested it spontaneously.
As the ’spontaneous response’ aspect of this question could not be reproduced online, the 2023 push-to-web survey asked the question in two different ways. Half of respondents were provided with the “both Westminster and Scottish Government equally” response option alongside the other responses (question option A). For the other half of respondents, the “both Westminster and Scottish Government equally” response option was hidden unless they skipped the question (question option B). Question option B more closely resembles the way this question was asked by an interviewer in the face-to-face survey.[xxiii]
Of the 69% of people who thought that the standard of the health service had fallen, for those who were presented with and answered question option A, “Both Westminster and Scottish Government equally” was the most frequenly chosen response for four in ten people (42%). Of those who answered question option B, almost half (47%) said the fall in standards was mainly the result of UK government policies; a third (32%) said mainly the result of Scottish Government policies instead.
Table 8 - Of those who thought the standard of the health service had fallen, what do you think this has been mainly the result of?
- Mainly the result of the Scottish Government’s policies
- Question option A ("Both" option shown) - 19%
- Question option B ("Both" option hidden) - 32%
- Mainly the result of the UK Government’s policies at Westminster
- Question option A ("Both" option shown) - 30%
- Question option B ("Both" option hidden) - 47%
- For some other reason
- Question option A ("Both" option shown) - 7%
- Question option B ("Both" option hidden) - 19%
- Both Westminster and Scottish Government equally
- Question option A ("Both" option shown) - 42%
- Question option B ("Both" option hidden) - 0%
- Unweighted base
- Question option A ("Both" option shown) - 544
- Question option B ("Both" option hidden) - 533
The change in the way this question was asked in the push-to-web survey means that the 2023 data is not comparable with the long-running SSAS timeseries. For more information on the mode change and discussion of the comparability with the timeseries, please see the SSAS 2023 technical report.
Subgroup analysis
Those with lower household income were more likely to think that the standard of the NHS had increased over the previous year, and less likely to think that it hadn’t changed, than those with higher incomes.[xxiv]
Supporters of the SNP and the Scottish Greens were less likely to think that the standard of the health service had fallen, and more likely to think that it had stayed the same, than supporters of other parties.
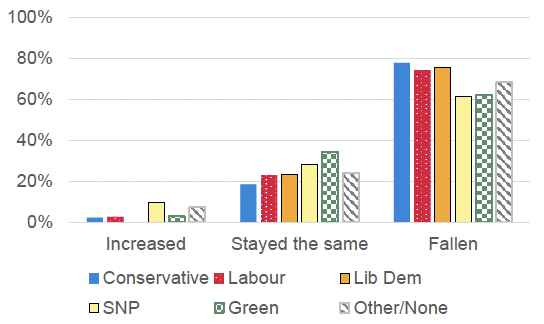
Percentage of people who thought the standard of the health service had increased or fallen in the previous year by political party affiliation, 2023
Standard of living
Respondents were asked whether they thought the general standard of living in Scotland had changed over the previous year – “increased a lot”, “increased a little”, “stayed the same”, “fallen a little” or “fallen a lot”.
Table 9 - Thinking back over the last twelve months, would you say that since then the general standard of living in Scotland has increased or fallen?
- Increased a lot - 4%
- Increased a little - 2%
- Stayed the same - 10%
- Fallen a little - 41%
- Fallen a lot - 42%
- Don't know/not answered - 1%
- Increased a little/a lot - 6%
- Fallen a little/a lot - 83%
- Unweighted base - 1574
More than eight in ten people (83%) thought that the general standard of living had fallen a little or a lot over the previous year. Fewer than one in ten (6%) thought the standard of living had increased a little or a lot, and 10% thought it had stayed the same.
This question has been asked since 1999.
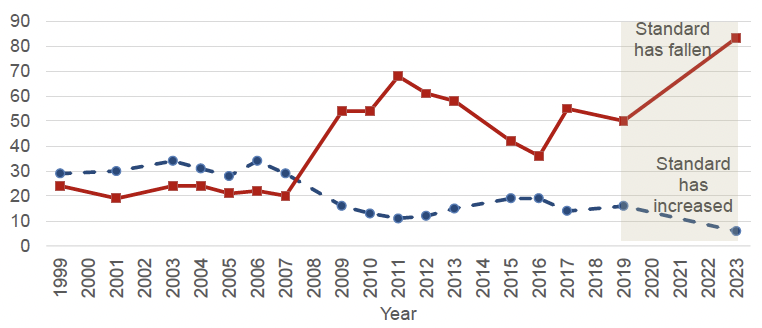
Percentage of people who thought the general standard of living in Scotland had increased or fallen since previous year, 1999 to 2023. N.B. Shading indicates a change in methodology from face-to-face to push-to-web between 2019 and 2023.
The percentage of people who said that the general standard of living had increased over the previous year fell from 16% in 2019 to 6% in 2023. The percentage who thought the standard of living had fallen, increased from 50% in 2019 to 83% in 2023.
In every year since 2007, more people have said that the standard of living has fallen than have said the opposite.
As with the question on standard of the health service, respondents were asked to say whether any change in the standard of living was mainly the result of Scottish Government policies, UK Government policies, some other reason, or both Westminster and Scottish Government equally. Again, due to the change from a face-to-face to an online survey, half of the respondents were presented one version of the question where “both Westminster and Scottish Government equally” was offered alongside the other responses (option A), and the other half of respondents were only shown the “both Westminster and Scottish Government” equally answer option if they tried to skip the question (option B). Option B is most closely aligned with the way this question answer functioned in the face-to-face survey, where interviewers would not present “both Westminster and Scottish Government equally” as an option and would only record this if the respondent offered this spontaneously themselves.[xxv]
Here, of the 83% of people who thought that the standard of living had fallen, for those who were presented with and answered question option A, UK Government policies was the most frequenly chosen response for four in ten people (38%) and almost two in ten (17%) said Scottish Government policies. Of those who answered question option B, more than half (55%) said the fall in standards was mainly the result of UK government policies; just over a quarter (27%) said mainly the result of Scottish Government policies instead.
Table 10 - Of those who thought the standard of living had fallen, what do you think this has been mainly the result of?
- Mainly the result of the Scottish Government’s policies
- Question option A ("Both" option shown) - 17%
- Question option B ("Both" option hidden) - 27%
- Mainly the result of the UK Government’s policies
- Question option A ("Both" option shown) - 38%
- Question option B ("Both" option hidden) - 55%
- For some other reason
- Question option A ("Both" option shown) - 8%
- Question option B ("Both" option hidden) - 17%
- Both Westminster and Scottish Government equally
- Question option A ("Both" option shown) - 36%
- Question option B ("Both" option hidden) - 1%
- Unweighted base
- Question option A ("Both" option shown) - 673
- Question option B ("Both" option hidden) - 662
The change in the way this question was asked in the push-to-web survey means that the 2023 data is not comparable with the long-running SSAS timeseries. For more information on the mode change and discussion of the comparability with the timeseries, please see the SSAS 2023 technical report.
Subgroup analysis
In terms of self-rated hardship, people who identified themselves as “really struggling on present income” were more likely to think the standard of living had increased or stayed the same, and less likely to think that it had fallen, compared with groups who were more comfortable.[xxvi]
Those on the left of the left-right political scale were more likely to think that the standard of living had fallen, than those on the right.
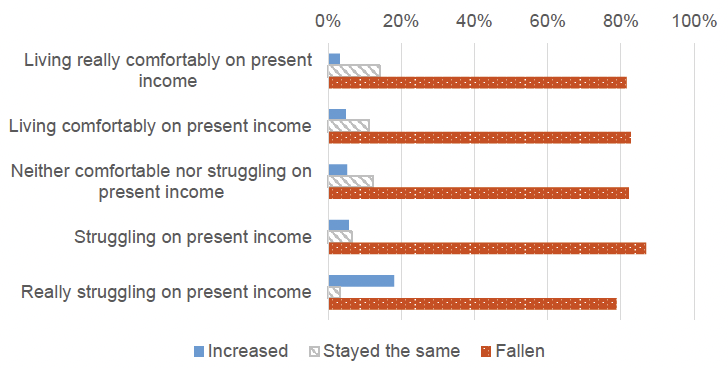
Percentage of people who thought the general standard of living had increased or fallen in the previous year by self-rated hardship, 2023
Contact
Email: CIMA@gov.scot
There is a problem
Thanks for your feedback