Scottish Social Attitudes Survey 2023 - Attitudes to Government, the Economy, and the Health Service
Findings from the Scottish Social Attitudes Survey core module 2023.
In 2023, SSAS was run as a push-to-web survey for the first time in its history.
These questions covered attitudes to: government, the standard of living, the health service, and tax, spending, and redistribution.
5. Tax, spending and redistribution
This chapter presents views on tax, spending and redistribution of income.
Taxes and spending
Respondents were presented with three options and asked to pick which one they thought government should choose – whether to “reduce taxes and spend less on health, education and social benefits”, “keep taxes and spending on these services at the same level” or “increase taxes and spend more on health, education and social benefits”.
Table 11 - Suppose the government had to choose between the three options on this card. Which do you think it should choose?
- Reduce taxes and spend less on health, education and social benefits - 12%
- Keep taxes and spending on these services at the same level - 38%
- Increase taxes and spend more on health, education and social benefits - 47%
- None of these - 1%
- Unweighted base - 1574
Just under half (47%) of people thought government should increase taxes and spending; under four in ten (38%) thought government should keep taxes and spending the same, and 12% thought government should reduce taxes and spending.
This question has been asked since 1999.
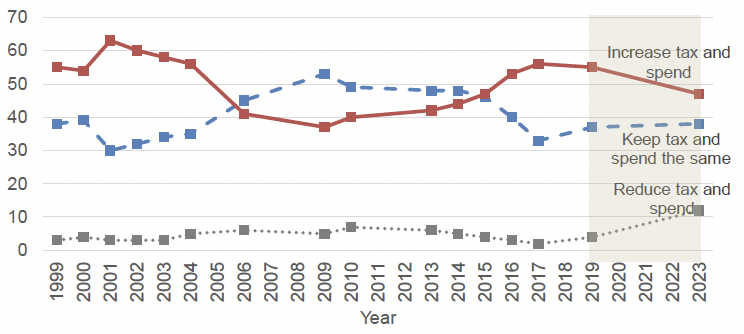
Percentage of people who thought the government should increase, reduce or keep the same tax and spending on health, education and social benefits, 1999 to 2023. N.B. Shading indicates a change in methodology from face-to-face to push-to-web between 2019 and 2023.
The percentage who thought government should increase tax and spending decreased from 55% in 2019 to 47% in 2023. The percentage who thought government should keep them the same increased slightly from 37% in 2019 to 38% in 2023, and the percentage who thought government should reduce tax and spending increased from 4% in 2019 to 12% in 2023.
Although the percentage who say government should reduce tax and spending is generally low, its value of 12% in 2023 is the highest since the survey began.
Between 2006 and 2014, more people said government should keep tax and spend the same than said they should be increased. Outwith these years, more people said to increase tax and spend than to keep them the same.
Subgroup analysis
Older people (60% of those aged 65 and over compared with 42% of those aged 16 to 24) were more likely to think that taxes and spending should be increased, as were disabled people (57% compared with 44% people who were not disabled), those on the left (55% to 26% of those on the right) and supporters of Scottish Independence (54% to 41% of those who oppose Scottish Independence).[xxvii]
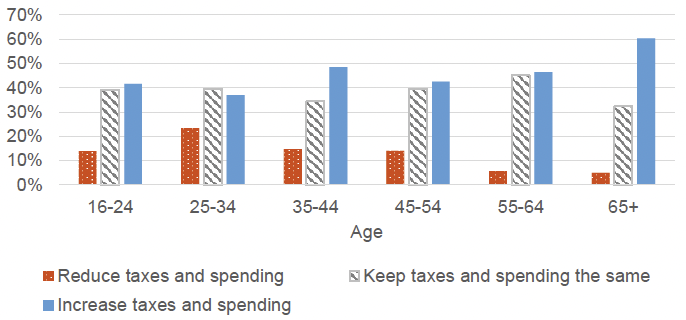
Percentage of people who thought that taxes and spending should be increased, kept the same or reduced, by age, 2023
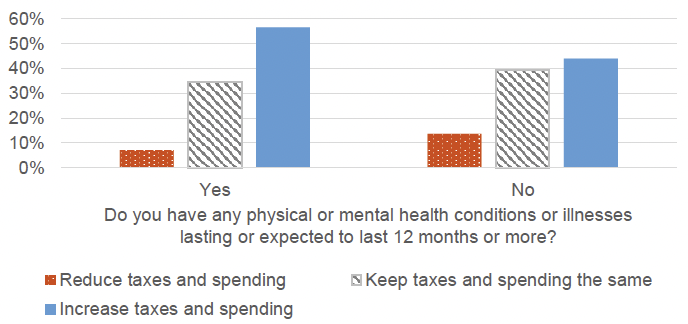
Percentage of people who thought that taxes and spending should be increased, kept the same or reduced, by disability, 2023
Redistribution of income
Respondents were asked to what extent they agreed with the statement “Government should redistribute income from the better-off to those who are less well off”.
Table 12 - Whether agree or disagree with the statement ‘Government should redistribute income from the better-off to those who are less well-off
- Agree strongly - 20%
- Agree - 30%
- Neither agree nor disagree - 25%
- Disagree - 15%
- Disagree strongly - 8%
- Agree strongly/agree - 50%
- Disagree/disagree strongly - 23%
- Unweighted base - 1574
Half of people (50%) agreed that Government should redistribute income from the better-off to those who are less well-off; just under a quarter (23%) disagreed and just over a quarter (27%) either didn’t agree or disagree, or didn’t know or answer.
This question has been asked since 1999.
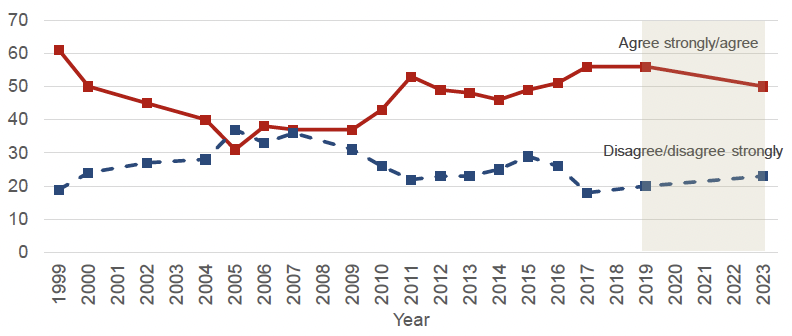
Percentage of people who agree or disagree with the statement ‘Government should redistribute income from the better-off to those who are less well-off’, 1999 to 2023. N.B. Shading indicates a change in methodology from face-to-face to push-to-web between 2019 and 2023.
In every year since 2005, there has been more support for redistribution than there has been opposition.
Subgroup analysis
Those on the left (of the Left-Right Scale)[xxviii] were more likely to support redistribution of income than those on the right (70% compared with 4%).
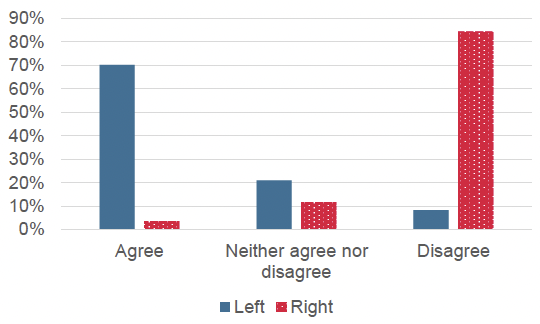
Percentage of people who agreed or disagreed with redistribution of income from the better-off to the less well-off, by position on the left-right scale, 2023
Contact
Email: CIMA@gov.scot
There is a problem
Thanks for your feedback