Scottish Study of Early Learning and Childcare: phase 4 report
This report outlines findings from the 4th phase of the Scottish Study of Early Learning and Childcare (SSELC), focusing on two-year-olds who are accessing funded ELC. The SSELC forms a major part of the strategy for the evaluation of the expansion of funded early learning and childcare in Scotland.
4. Child health and development
This chapter focuses on data relating to children's development. Child outcomes explored in the text are:
- social, emotional and behavioural development
- cognitive and language development
- physical and mental health and wellbeing.
At the time of the data collection, the participating Eligible 2s would have been in receipt of the funded ELC entitlement for a maximum of six months, but in most cases no more than four.
The chapter examines parent-report information on the presence of developmental risk factors, such as sleep patterns and breastfeeding, and on the child's general health and long-term illnesses. Development outcomes are discussed using ELC keyworker observations utilising the Ages and Stages (ASQ) and Strengths and Difficulties (SDQ) Questionnaires[21] along with additional parent-report data on speech and language specifically.
4.1 Child general health and long-term conditions
The parent questionnaire included a question asking parents to assess the health of their child in general. Over half (55%) of parents assessed the general health of their child to be "very good", and a further 36% viewed it as being "good". No parents assessed their child's general health as "bad" or "very bad".
Perceptions of the child's general health did vary according to sex of the child, with girls more likely to be described as in "very good" or "good" health in general (94%, compared with 88% of boys). Parents living in the most deprived areas were significantly less likely than those living elsewhere to assess their child's general health as "very good".
Parents were also asked if their child had any long-term illnesses. Around one in six (16%) children were described by a parent as having a physical or mental condition or illness lasting or expected to last for 12 months or more. Of those children with a longstanding illness, 19% of parents said the illness limited the child "a lot", 50% said it limited them "a little". This equates to 11% of all Eligible 2s attending an ELC setting having a limiting longstanding illness.
Longstanding illnesses were most associated with social or behavioural issues (37% of those children with a long-term condition). A third (33%) of parents said the longstanding illness affected the child's learning, understanding or concentrating, while 25% said it affected the child's stamina or breathing. A complete summary of responses is presented in Table 4.1.
% |
|
|---|---|
Other impairment(s) |
43 |
Socially or behaviourally (for example associated with autism spectrum disorder (ASD), or attention deficit hyperactivity disorder (ADHD)) |
37 |
Learning or understanding or concentrating |
33 |
Stamina or breathing or fatigue |
25 |
Mobility, such as difficulty moving around |
23 |
Mental health |
4 |
Hearing (e.g. due to deafness or partial hearing) |
3 |
Unweighted base |
50 |
Base: All children with a long-term condition (parent questionnaire, Phase 4, weighted)
4.2 Developmental risk factors
When asked if their child had ever been breastfed, 43% of parents reported that their child had been.[22] Breastfeeding rates varied by area deprivation, with 36% of children in the most deprived areas having been breastfed, compared with 47% living elsewhere.
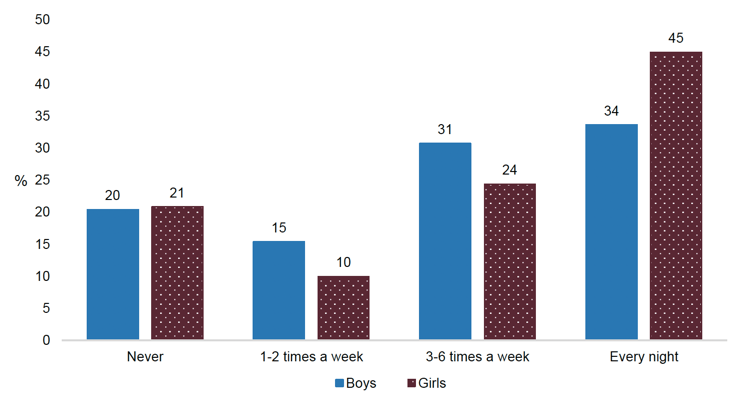
Parents were asked how many hours their child typically slept over a 24-hour period (including daytime naps), and whether their child slept through the night. Not getting enough sleep is recognised as a risk factor related to the child's development.[23] Over half (57%) of children were reported as sleeping 12 hours or more in a typical 24-hour period, while 12% had under 10 hours sleep. Over the course of a typical week, four in ten (40%) children slept through "every night" without waking or needing to be comforted. In contrast, 21% of children were reported as never sleeping right through the night.
Boys were more likely than girls to get 13 or more hours sleep (25% and 16%, respectively). Whereas girls were more likely than boys to sleep through every night (45%, compared with 34%). Children living in less deprived areas were more likely to never sleep through the night compared with children living in the most deprived areas.
Base: All respondents (parent questionnaire, Phase 4, weighted)
4.3 Speech and language development
The majority of parents reported having no concerns about their child's speech and language development. Three-quarters (74%) had no worries about how their child talks in words or sentences and 81% had no concerns about what their child understands. The remainder were evenly split between those reporting they were concerned or worried about their child's speech (13%) and understanding of what others say (10%) and those feeling "a little" concerned or worried (13% and 10% respectively).
Parents of boys were more likely than parents of girls to report being concerned or a little concerned about their child's speech (41% compared with 16%) and about how their child understands what they or others say (29% compared with 12%).
There was a notable difference in parental concern about child speech and language development by area deprivation, with those living in the most deprived areas most likely to report concerns or worries. While 36% of parents living in the most deprived areas were either concerned or a little concerned about how their child talks, 20% of those living in other areas reported similar levels of concern.
Base: All respondents (parent questionnaire, Phase 4, weighted)
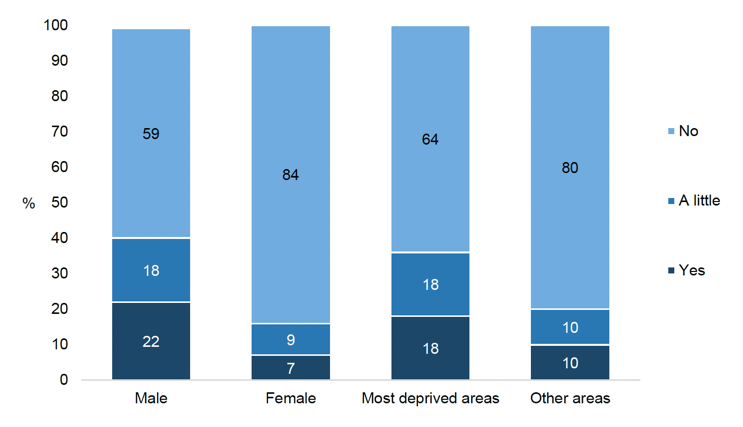
Parents were also asked if their child received any specific support for speech and language development from their ELC setting. In line with the fact that most parents did not have speech and language concerns, the majority (85%) of children were not receiving specific speech and language development support, according to parents. Five percent of parents reported that their child received "a little" support and 10% said their child did receive specific support.
Parent reports indicated that boys were twice as likely as girls to receive specific speech and language development (22% compared with 10%). There was no notable association between provision of specific speech and language support and area deprivation.
Table 4.3 Specific support for speech and language development by child's sex
Boys |
Girls |
Total |
|
|---|---|---|---|
% |
% |
% |
|
Yes |
15 |
7 |
10 |
A little |
7 |
3 |
5 |
No |
78 |
90 |
85 |
Unweighted base |
153 |
179 |
337 |
Base: All respondents (parent questionnaire, Phase 4, weighted)
The majority of parents with some degree of worry or concern about how their child talked or what they understood indicated that their child was in receipt of specific speech and language support at their ELC setting. However, two in five (42%) of those with concerns about how their child talked were not receiving specific speech and language support.
4.4 Assessments of development
At ELC settings, the children's keyworkers were asked to complete child development observations using the Ages and Stages (ASQ) and Strengths and Difficulties (SDQ) questionnaires.
The ASQ is a structured assessment of a range of developmental domains to identify children at increased risk of developmental difficulties. The instrument includes 30 items split into five different domains: communication, gross motor, fine motor, problem solving and personal-social. Each domain produces a summary score which can be used to indicate whether the child's development is on schedule, needs monitoring or requires further assessment.
The SDQ is a commonly used behavioural screening questionnaire designed for use with children aged between two and 16. The questionnaire includes 25 questions about a child's behaviour. Responses can be combined to form five different measures of the child's development, namely emotional symptoms (e.g. excessive worrying), conduct problems (e.g. often fighting with other children), hyperactivity / inattention (e.g. constantly fidgeting), peer relationship problems (e.g. not having close friends), and prosocial behaviour (e.g. being kind to others). In addition, the first four measures can be combined into a "total difficulties" scale.
Further details of these measures are included in Appendix C.
Ages and Stages Questionnaire
The proportion of children deemed as having development on schedule, needing further monitoring or requiring further assessment is provided in Figure 4.3 for each of the five ASQ domains. Children were most likely to be on schedule in relation to gross motor development (47%). The proportion on schedule was lowest in relation to problem solving (33%).
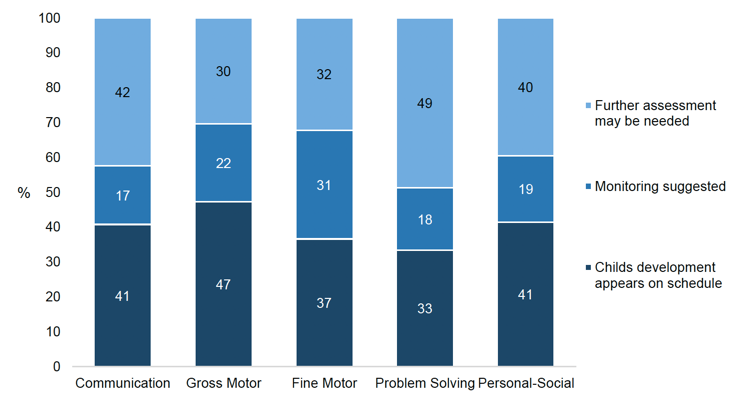
Base: All children (with keyworker observations, Phase 4, weighted)
Differences in ASQ scores by sex, area deprivation and long-term illness
As is commonly seen on a range of different measures throughout childhood,[24] with the exception of gross-motor skills, girls were more likely than boys to be on schedule across the domains (Figure 4.4 to Figure 4.8).
On two of the domains (communication and problem solving), there was an association with area deprivation. For both domains those children living in the areas of greatest deprivation were least likely to be on schedule.
Looking at area deprivation and sex together, differences were particularly pronounced for the communication, fine motor skills and personal-social domains. On all three domains it was boys living in the most deprived areas that were either least likely to be on schedule and/or most likely to be in need of further assessment (Figure 4.4 to Figure 4.8).
Across all the developmental domains, in line with what might be expected, children reported as having a limiting long-standing illness or additional support need were significantly less likely than those with none to be assessed as on schedule developmentally.
ASQ communication domain
Figure 4.4 breaks down scores on the ASQ communication domain by area deprivation and sex. Girls (48%) were more likely than boys (33%) to be on schedule for communication development, with half (54%) of boys classified as "further assessment may be needed". Children living in the most deprived areas (50%) were less likely than children living elsewhere (37%) to be on schedule.
When broken down by area deprivation and sex, the size of the gap between those in the most deprived areas who were on schedule with communication skills, and those living in other areas, was larger for boys than for girls (13 percentage points for boys and 5 percentage points for girls).
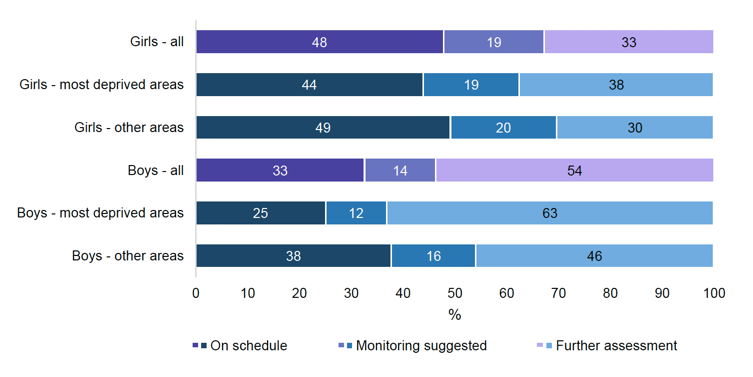
Base: All children (with keyworker observations, Phase 4, weighted)
Examining child ASQ communication domain results together with parental concern about child speech and language development indicated that some parents were aware of, and made similar observations, to the child's keyworker with regards their child's communication skills. However, there was also a substantial group of parents who were not concerned or worried about their child's speech and language, despite the child's ASQ communication domain score indicating there were issues. The parents of half (50%) of those for whom further assessment may be required on the ASQ communication domain had no concerns about how their child talked. Similarly, 60% of this group of parents had no concerns about what their child understood.
The ASQ communication domain score was also related to the provision of specific speech and language support. Children categorised as "further assessment may be required" on the ASQ communication domain were more likely than others to be, according to parent reports, in receipt of specific speech and language development support at the funded ELC setting. That said, two-thirds (66%) of children categorised as "further assessment may be required" were not, according to the participating parent, receiving specific speech and language support at the ELC setting.
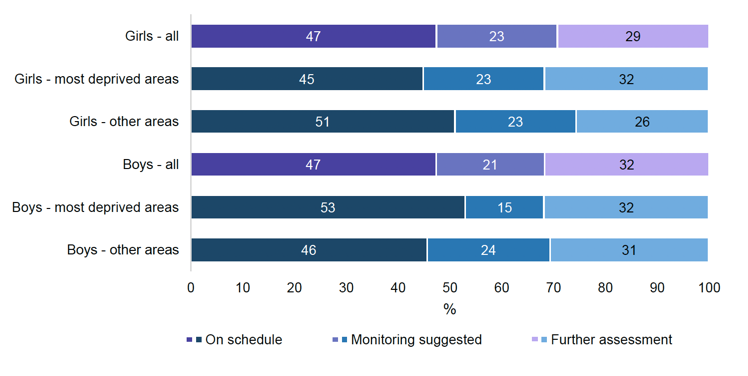
ASQ gross motor domain
Scores in the gross motor domain are summarised in Figure 4.5. Unlike other ASQ domains there were no notable differences in gross motor domain scores for boys and girls. For both, almost half (47%) were assessed as appearing to be on schedule for gross motor development.
Base: All children (with keyworker observations, Phase 4, weighted)
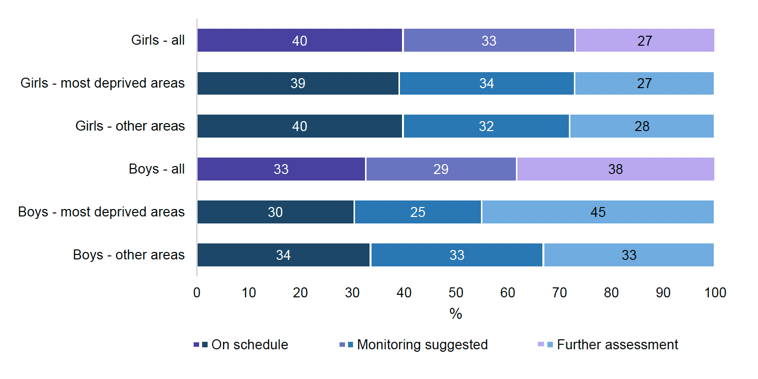
ASQ fine motor domain
The gap between boys and girls for fine motor skills is shown in Figure 4.6, with 38% of boys being assessed as in need of further assessment, compared with 27% of girls. Boys living in the most deprived areas were more likely than boys living in other areas to be categorised as in need of further assessment for fine motor development (45% and 33%, respectively).
Base: All children (with keyworker observations, Phase 4, weighted)
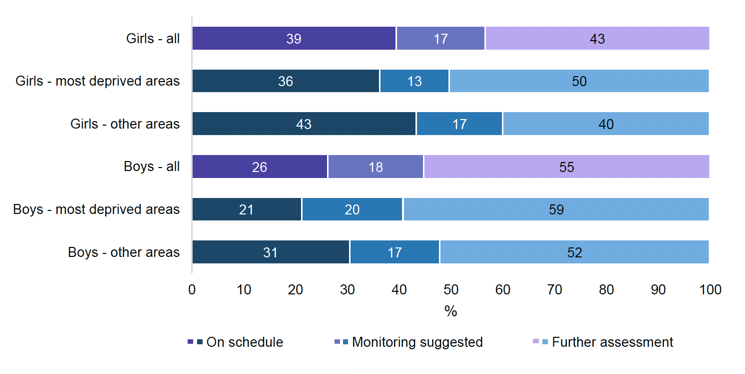
ASQ problem-solving domain
Boys (26%) were less likely than girls (39%) to be on schedule developmentally for the problem-solving domain (Figure 4.7). Again, boys in the most deprived areas appeared to have greater developmental issues.
Base: All children (with keyworker observations, Phase 4, weighted)
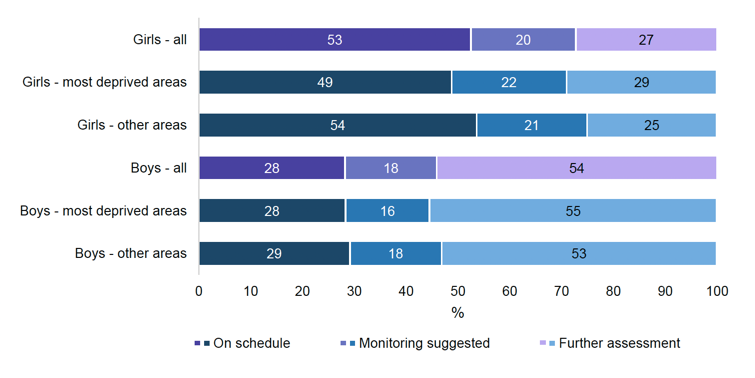
ASQ personal-social domain
Finally, on the personal-social domain, girls were close to twice as likely as boys to be on schedule (53% and 28% respectively).
Base: All children (with keyworker observations, Phase 4, weighted)
Strengths and Difficulties Questionnaire
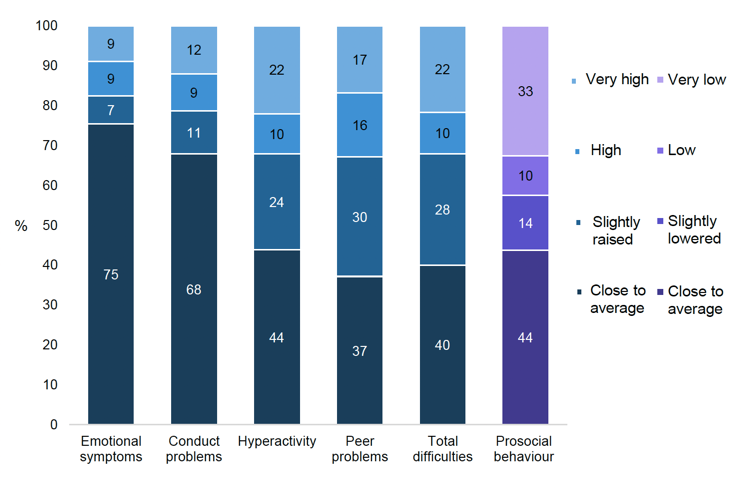
A breakdown for all five of the SDQ domains, as well as the total difficulties score, is provided in Figure 4.9. The prosocial behaviour domain is coloured differently to highlight the different labelling, although the general meaning of the categories are similar. The scales are designed so that most children have a score in the "close to average" range, with around 20% of the population having raised scores (lowered for prosocial behaviour),[25] although some variation is expected according to the age of the children.
Data from the keyworker observations shows that most children had a SDQ total difficulties score in the "close to average" (40%) or "slightly raised" (28%) range. However, 22% had a total score in the "very high" range. Rates varied across the difficulties domains, with the proportion scoring close to average largest on the emotional symptoms domain (75%) and smallest on the peer problems domain (37%). Very high scores were most commonly observed on the hyperactivity domain (22%).
Base: All children (with keyworker observations, Phase 4, weighted)
Differences in SDQ scores by child's sex and area deprivation
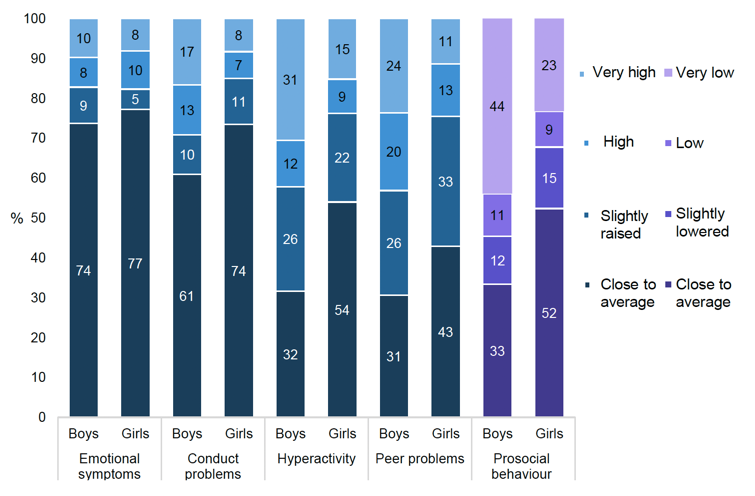
As seen with the ASQ scores, child sex was a significant factor in predicting child outcomes. With the exception of emotional symptoms, across all the SDQ domains, girls tended to have fewer difficulties than boys (Figure 4.10).
The gap between scores for boys and girls was largest for the hyperactivity domain (54% of girls close to average compared with 32% of boys) and the prosocial behaviour domain (52% of girls and 33% of boys close to average). There were no significant differences between boys and girls for the emotional symptoms domain.
On the total difficulties score, 49% of girls were close to average compared with 29% of boys, with 31% of boys scoring very high compared with 14% of girls (see supplementary tables).
Base: All children (with keyworker observations, Phase 4, weighted)
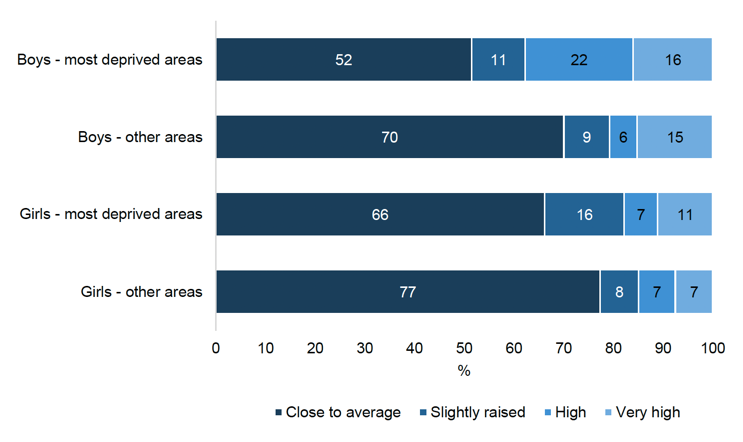
On some domains there was evidence of an association with area deprivation. For conduct problems, children living in the most deprived areas were more likely than those living in other areas to score high or very high (28%, compared with 17% in other areas). The opposite was observed for the emotional symptoms domain with those in the most deprived areas being less likely to score high or very high (12%, compared with 22% in other areas). SDQ total difficulties score did not vary by area deprivation.
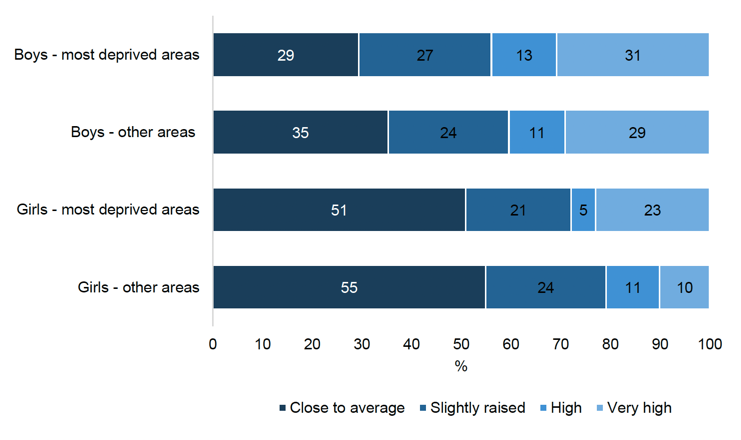
When area deprivation and sex were examined together, further differences in SDQ scores were observed. For SDQ total difficulties score, boys living in the most deprived areas were twice as likely as girls in these areas to have a very high score (33% and 15%, respectively). On the individual domains, the gap between boys and girls living in the most deprived areas compared with those living in other areas was largest for the conduct domain (see Figure 4.11).
Base: All children (with keyworker observations, Phase 4, weighted)
Figure 4.12 illustrates similar issues for boys living in the most deprived areas on the peer problems domain.
Base: All children (with keyworker observations, Phase 4, weighted)
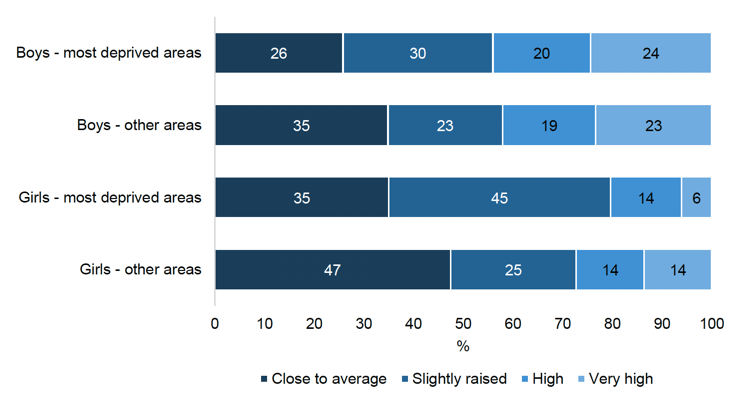
Figure 4.13 shows the large difference in scores between boys and girls on the hyperactivity domain. This difference is further exacerbated by area deprivation.
Base: All children (with keyworker observations, Phase 4, weighted)
Contact
Email: socialresearch@gov.scot
There is a problem
Thanks for your feedback