Scottish Study of Early Learning and Childcare: phase 4 report
This report outlines findings from the 4th phase of the Scottish Study of Early Learning and Childcare (SSELC), focusing on two-year-olds who are accessing funded ELC. The SSELC forms a major part of the strategy for the evaluation of the expansion of funded early learning and childcare in Scotland.
5. Parent outcomes
Data relating to two of the three high level outcomes outlined in the Evaluation Strategy are considered in this chapter:
- Parents' opportunities to take up or sustain work, study or training increase
- Family wellbeing improves
The following intermediate outcome is also considered:
- Increased parental confidence and capacity.
At the time of the data collection, children would have been receiving funded ELC for a maximum of six months, but less in most cases. For some parents this may have provided an opportunity to look for employment. However, it must be remembered that this group of parents with children eligible for funded ELC at the age of two may need more support than other working-age adults to find and sustain employment or education. While this chapter does report on economic activity, it is important to also consider other measures included in the data, such as time use and wellbeing, which are an indicator of whether the expansion has been beneficial to this group in helping them on the journey to employment.
Factors associated with family wellbeing are also examined, including parental confidence in their ability to cope, the home environment, and support from family and friends.
5.1 Economic activity
Parents were asked about their economic activity in the previous seven days. For the first time at Phase 4, data were also collected on the economic activity of the respondent's partner, if the two of them were living together. Most of the respondents to the parent questionnaire were women (91%). Hence when reading the tables, it should be borne in mind that figures provided for the respondent's economic activity are reflective of women, while those for the partner are more reflective of men (90% of partners were male).
Around two in five of respondents (mostly women) were in employment, with the majority of these working fewer than 30 hours a week (31% of all respondents), and only 9% working full-time. Partners (mostly men) were much more likely to be in full-time employment (51%), with a further 13% in part-time employment. Another 10% of respondents were looking for work or waiting to take up paid work they had already obtained, and 9% were in education (full-time or part-time).[26] More than half of the respondents said they were looking after the home or family (57%), while a quarter (26%) said their partner was doing this. Table 5.1 summarises the economic activities of the respondent and their partner.
What were you doing last week, that is the seven days ending last Sunday? |
Respondent |
Partner |
|---|---|---|
% |
% |
|
Working 30 or more hours a week (including if currently on leave or sick) |
9 |
51 |
Working fewer than 30 hours a week (including if currently on leave or sick) |
31 |
13 |
On maternity/parental leave from an employer |
1 |
- |
Looking after home or family |
57 |
26 |
Waiting to take up paid work already obtained |
1 |
1 |
Out of work and looking for a job |
9 |
4 |
Out of work, because of long-term sickness or disability |
13 |
16 |
On a Government training or employment scheme |
1 |
1 |
In full-time education (including on vacation) |
6 |
2 |
In part-time education (including on vacation) |
4 |
2 |
Wholly retired |
1 |
1 |
Not in paid work for some other reason |
15 |
7 |
Unweighted base |
331 |
130 |
Base: All respondents (parent questionnaire, Phase 4, weighted)
Note: respondents were able to choose more than one response. As such, percentages will not total 100%.
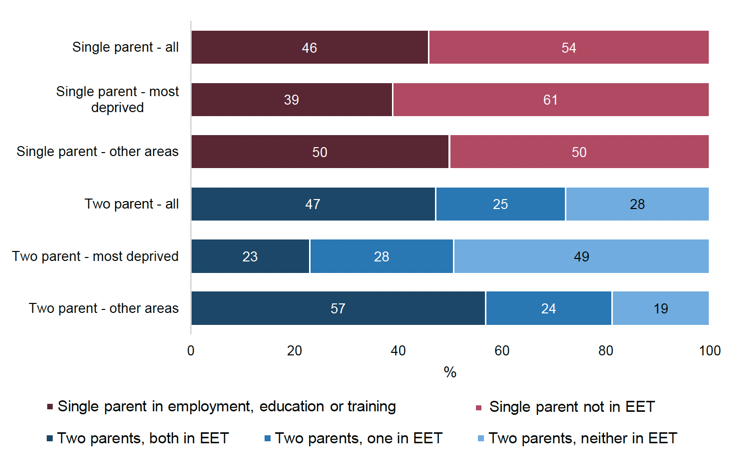
Figure 5.1 shows that nearly half (47%) of two-parent households with an eligible two-year-old had both parents in work, training or full-time education, while a further 25% had one parent undertaking such activities. Just under half (46%) of single parents with an eligible two-year-old at Phase 4 were in work, training or full-time education. Those living in deprived areas were less likely to be active in these ways: 51% of two-parent households with an eligible two-year-old living in the most deprived areas had at least one parent in employment, training or full-time education, compared with 81% in other areas. Differences for single parents were less stark (39% in the most deprived areas and 50% in other areas).
Base: All respondents (parent questionnaire, Phase 4, weighted)
Table 5.2 shows some of the multiple roles parents describe themselves as combining. Of those who said that they were looking after the family or home, only a third (35%) reported doing none of the other activities. Those who said they were in employment were less likely to report combining this with other activities. Two-thirds of those in full-time employment (67%) only mentioned being in work. Similarly, 52% of those in part-time employment only mentioned work, even though looking after children is likely to be a major part of the day-to-day life for nearly all of these parents.
Only looking after home or family |
Also in education |
Also in employment |
Also in both employment and education |
Also looking for work / out of work for some other reason |
Unweighted base |
|---|---|---|---|---|---|
% |
% |
% |
% |
% |
|
35 |
5 |
30 |
1 |
29 |
191 |
Only in FT work |
Also in education |
Also looking after the family |
Also both in education and looking after the family |
Unweighted base |
|
|---|---|---|---|---|---|
% |
% |
% |
% |
||
67 |
3 |
30 |
- |
37 |
Only in PT work |
Also in education |
Also looking after the family |
Also both in education and looking after the family |
Unweighted base |
|
|---|---|---|---|---|---|
% |
% |
% |
% |
||
52 |
5 |
41 |
3 |
97 |
Base: All respondents who reported themselves to be looking after the home or family; to be in full-time employment; or to be in part-time employment (parent questionnaire, Phase 4, weighted)
At Phase 4, parents were asked for the first time whether they, or their partner, had experienced any change in their employment as a result of their child starting funded early learning and childcare. As shown in Table 5.3, nearly half (44%) of the respondents had experienced some form of change in their situation; 15% reported they had entered or re-entered employment, 15% had started looking for work or a change in job, and 11% had entered or re-entered education or training.
Fewer partners (28%) had experienced a change. As noted earlier, partners were already more likely to be in employment or education.
As a result of your child starting funded early learning and childcare, have you or your partner experienced any of the following? |
Respondent |
Partner |
|---|---|---|
% |
% |
|
Entered / re-entered employment |
15 |
5 |
Change of employer |
2 |
5 |
Change of job / role with the same employer |
1 |
5 |
Change of employment status (e.g. from self-employed to employee) |
2 |
- |
Started looking for work / a change of job |
15 |
6 |
Increase in usual hours at work |
7 |
7 |
Decrease in usual hours at work |
3 |
4 |
Increase in income / pay |
5 |
4 |
Decrease in income / pay |
4 |
2 |
Entered / re-entered education or training |
11 |
7 |
None of these |
56 |
72 |
Unweighted base |
316 |
109 |
Base: All respondents (parent questionnaire, Phase 4, weighted)
Note: respondents were able to choose more than one response. As such, percentages will not total 100%.
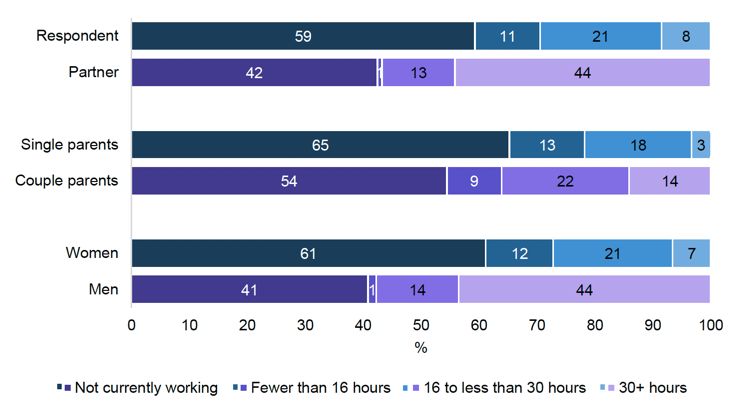
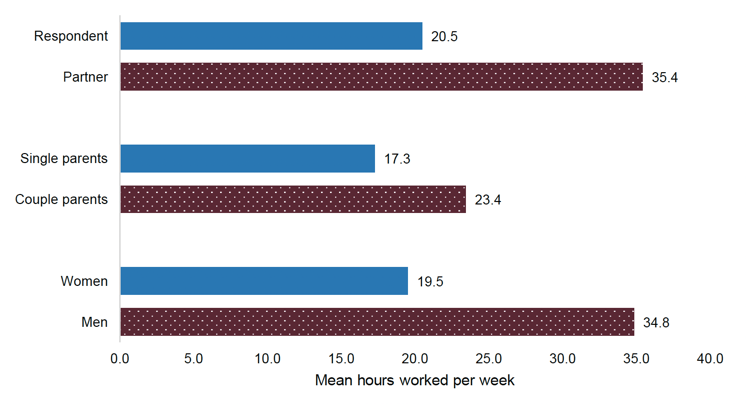
Overall, three in five (59%) respondents were not in work. Respondents from two-parent households were less likely to be out of work (54% not currently working, compared with 65% of single parents). Respondents who were in employment worked for an average of 20.5 hours a week. This was higher in two-parent households (23.4 hours) where childcare might be shared between parents, than in single parent households (17.3 hours).
Respondents in deprived areas were less likely to be in work than those who lived in other areas (69% not currently working in deprived areas, compared with 53% in other areas). There was no notable difference in the average hours worked by level of area deprivation.
Partners, who were mostly male, were more likely to be in work and tended to work longer hours than the respondents, who were mostly female and the main carer in the household. Just over two in five (42%) partners were out of work. The average number of hours worked by partners who were in employment was 35.4.
Combining data about the respondents and their partners, it is possible to obtain estimates for female and male work hours. Figures 5.2 and 5.3 demonstrate that data for respondents very closely matches that for women, and data for partners matches that for men.
Base: All respondents / respondents with a partner.
Base: Working respondents / respondents with a partner in work.
Another question introduced for Phase 4 of the study was about working patterns. More than three-quarters (77%) of the respondents in work had a non-standard pattern, the majority of these with some form of flexible working to suit the employee. The most commonly reported non-standard working patterns were flexitime (31%) and annualised hours[27] (27%). Term-time working was mentioned by 10% of respondents in work and zero-hours contracts[28] were mentioned by 11%. Flexitime (25%) and annualised hours (40%) were also the most commonly reported patterns for partners.
Respondents were asked where they, and their partner if they lived with one, usually worked. The large majority (88%) worked away from their home, but 6% worked entirely at home and a further 6% combined home working and working elsewhere. A similar pattern was seen for partners, with 6% working entirely at home and 10% combining home working with working elsewhere.
Of those who were not working, 38% said they would be able to start work within two weeks if a job became available. Respondents who were not working were asked how much they agreed or disagreed with the statement: "A lack of affordable, convenient, good quality childcare is one of the main reasons I'm not working at the moment". One in five (20%) agreed, while just over half (52%) disagreed. Disagreement was more common in non-deprived areas (61%) than in the most deprived areas (43%).
5.2 Effect of ELC on parental time use
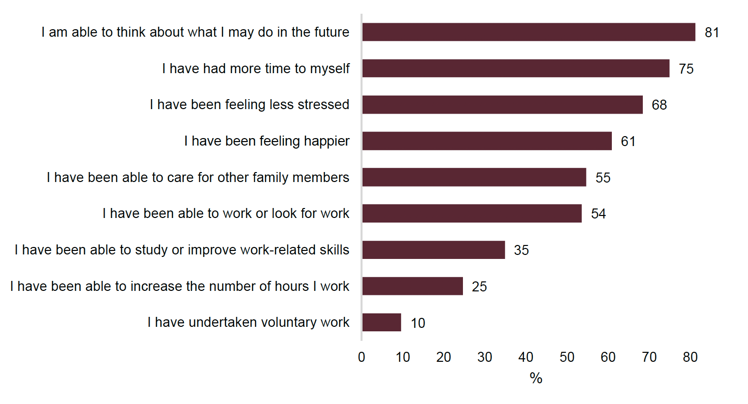
Respondents were asked how much they agreed or disagreed that they had been able to do a number of things because their child is in ELC. Figure 5.4 shows the proportion agreeing with each of the statements. Four in five respondents (81%) agreed they had been able to think about what they may do in the future and three-quarters (75%) agreed they had had more time to themselves. The majority also agreed they were feeling less stressed (68%), were feeling happier (61%), had been able to care for other family members (55%), and had been able to work or look for work (54%).
Base: All respondents (parent questionnaire, Phase 4, weighted)
5.3 Parental general health and wellbeing
One in five respondents (21%) said that their general health was very good, while a further 41% said it was good, 26% fair, and 12% bad or very bad. Those living in deprived areas were less likely to say their health was good or very good than those living in other areas (53%, compared with 67%).
Two in five (40%) respondents had a long-term illness or health condition. Partners were less likely to have a long-term condition (27%) than respondents. At least one person in the household (excluding the eligible two-year-old) had a long-term condition in over half of households (52%).
By far the most common area in which respondents and their partners were affected by a long-term condition was their mental health: 79% of respondents and 60% of their partners with long-term conditions were affected in this way. Between 17% and 23% of respondents were also affected in their stamina or breathing or fatigue, socially or behaviourally, in their learning or understanding or concentrating, in their mobility or in their memory.
Of those respondents with a health condition, 36% said it limited their activities a lot, while a further 46% said it limited their activities a little and 18% said it did not limit their activities. Figures for the partner were similar.
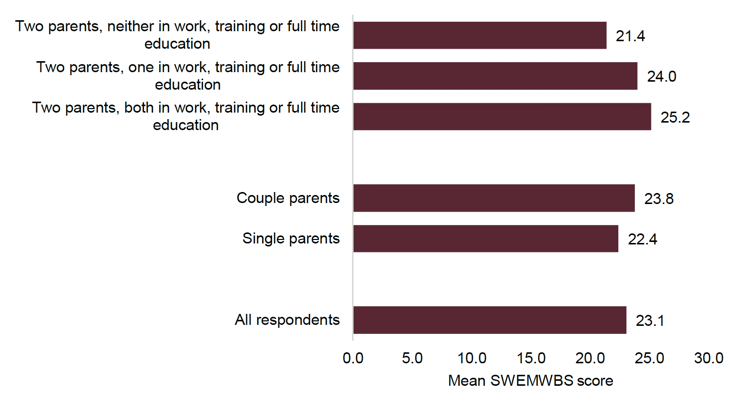
Figure 5.5 shows that mental wellbeing was higher among respondents living in two-parent households than single-parent households. In two-parent households it was also higher if at least one of the parents worked or was in education than if neither was.
Base: All respondents (parent questionnaire, Phase 4, weighted)
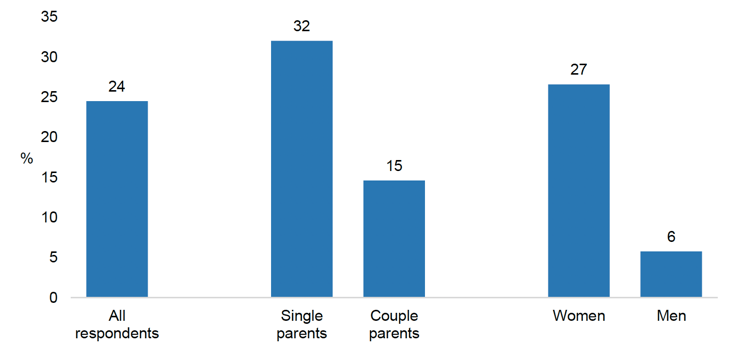
The same pattern with respect to single and couple parents could be seen when looking at low wellbeing rather than mean wellbeing scores – 32% of single parents were in the "low wellbeing" bracket compared with 15% of respondents from two-parent households. Female respondents were also more likely to report low wellbeing than male respondents (27% in the "low wellbeing" bracket, compared with 6% of male respondents) (see Figure 5.6).
Base: All respondents (parent questionnaire, Phase 4, weighted)
Parents were asked, on a scale of 0 to 10, how satisfied they were with their life nowadays. Respondents from two-parent households had a higher mean life satisfaction score than single parents (7.8 in two-parent households, compared with 7.1 for single parents and 7.4 for all respondents).
5.4 Parental confidence and capacity and home environment
The Evaluation Strategy for the expansion of early learning and childcare identifies the improvement of family wellbeing as a key aim of the expansion. "Family wellbeing" is not as simple a concept to pin down as the individual wellbeing discussed above. There are no direct measures of family wellbeing within the SSELC questionnaires. Instead, there are a number of measures of things known to be related to family wellbeing. These include how well a parent feels they are coping, the frequency of activities related to home learning, how calm or chaotic the home environment is, the warmth of the bond between parent and child, and feelings about the level of support from friends and family.
Table 5.4 shows the four items that make up the Home Learning Environment scale. This comprises the number of days per week on which a child does the activity with someone at home. Nearly half (46%) of respondents reported that the child looked at books or stories every day, with no difference between boys and girls (47% and 45% respectively).
Girls were more likely than boys to do painting or drawing every day (26%, compared with 13% of boys), while only 4% of girls did not do painting or drawing at all in the last week, compared with 15% of boys. Girls were also more likely than boys to recite nursery rhymes or sing songs with someone at home every day (69%, compared with 58% of boys). Only 5% of girls did not do this activity at home during the previous week, compared with 14% of boys.
While there was no difference in the proportions of boys and girls playing at recognising letters, words, shapes or numbers in the previous week (36% of girls and 33% of boys), boys were more likely not to have done this at all (22%, compared with 10% of girls).
Looked at books or read stories
Boys |
Girls |
All |
|
|---|---|---|---|
% |
% |
% |
|
| Looked at books or read stories | |||
Not in last 7 days |
4 |
2 |
3 |
1 to 3 days |
20 |
17 |
18 |
4 to 6 days |
29 |
35 |
33 |
7 days |
47 |
45 |
46 |
| Painting or drawing | |||
Not in last 7 days |
15 |
4 |
9 |
1 to 3 days |
36 |
33 |
35 |
4 to 6 days |
35 |
37 |
36 |
7 days |
13 |
26 |
21 |
| Recited nursery rhymes or sung songs | |||
Not in last 7 days |
14 |
5 |
9 |
1 to 3 days |
10 |
7 |
8 |
4 to 6 days |
19 |
19 |
19 |
7 days |
58 |
69 |
64 |
| Recognising letters, words, numbers or shapes | |||
Not in last 7 days |
22 |
10 |
15 |
1 to 3 days |
22 |
24 |
23 |
4 to 6 days |
23 |
30 |
27 |
7 days |
33 |
36 |
34 |
Unweighted base |
150 |
179 |
334 |
Base: All children (parent questionnaire, Phase 4, weighted)
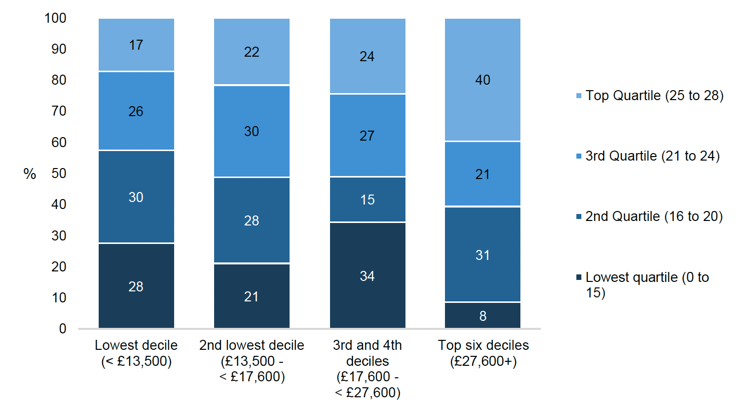
A home learning environment scale was created by summing the number of days on which each of the four activities had occurred in the last week. As Figure 5.7 shows, there was a difference by household income in the proportion of families falling into the lowest quartile of the scale[29], even though this was not evident in the individual items. Only 8% of those in the wealthiest group (the top six equivalised income deciles) were in the lowest quartile for frequency of home learning activities, compared with 21% to 34% in the lower income groups.
Base: All respondents (parent questionnaire, Phase 4, weighted)
Another measure of the home environment is the Confusion, Hubbub and Order Scale[30], designed to assess the level of calmness and order within the household.
The majority of respondents had fairly calm homes: 82% agreed with the statement that "First thing in the day, we have a regular routine at home"; 68% agreed that "The atmosphere in our home is calm"; 71% disagreed that "It's really disorganised in our home" and 59% disagreed that "You can't really hear yourself think in our home".
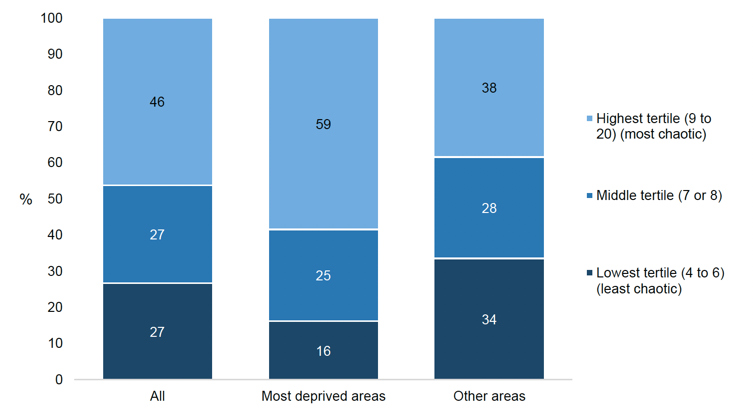
While the individual items of the scale did not vary significantly between subgroups, when the items were summed to form a scale, differences by area deprivation were evident (see Figure 5.8). In the most deprived areas, 59% were in the most chaotic group and 16% in the least chaotic, while in other areas, 38% were in the most chaotic group and 34% in the least chaotic. Differences were also identified by income, with 45% of those in the highest income group (the top 6 deciles) in the least chaotic category, compared with between 18% and 22% in the lower income groups.
Base: All respondents (parent questionnaire, Phase 4, weighted)
The parent-child warmth scale used in the SSELC comprises the seven items that form the warmth dimension of the short form of the Mothers' Object Relations Scale (MORS-SF).[31] See Appendix C for more information.
In general, respondents were very positive about their relationship with their child. For six of the seven items, at least 72% reported the action happening all of the time. When the items were summed to form a scale, 40% fell into the top category, responding "all of the time" to all seven statements, and a further 30% fell into the second category, responding "all of the time" to at least four of the statements. Little variation was observed between subgroups.
The majority of parents (56%) thought they were coping at least pretty well most of the time, with a further 38% reporting that sometimes they were coping, but sometimes things got on top of them. Only 6% felt that most of the time they were not coping very well or at all.
With regards to support or help with childcare from family and friends living outside their household, 62% of respondents said they got enough support, while 9% said they did not need any. The remaining 30% either said they did not get enough (13%) or that they did not get any support (16%).
Contact
Email: socialresearch@gov.scot
There is a problem
Thanks for your feedback