Scottish Survey of Literacy and Numeracy 2015 (Numeracy)
Numeracy results from the 2015 survey which covers assessment of school pupils at stages P4, P7 and S2. Questionnaire results from a pupil and a teacher questionnaire are also provided
Scottish Survey of Literacy and Numeracy 2015 (Numeracy)
We would like to thank the pupils and teachers who took part in SSLN 2015.
The Scottish Survey of Literacy and Numeracy (SSLN) is a sample survey which measures national performance in literacy and numeracy in alternate years. It is aligned to Curriculum for Excellence Levels. First Level (P2 to P4) performance is assessed near the end of P4 (age 8-9), Second Level (P5 to P7) performance is assessed near the end of P7 (age 11-12) and Third Level (S1 to S3) performance is assessed near the end of S2 (age 13-14).
Full results are available from www.gov.scot/ssln
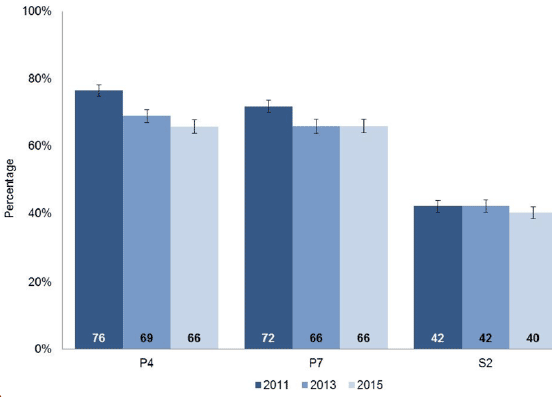
Numeracy attainment - proportion of pupils performing well or very well in 2011, 2013 and 2015, by stage

- The proportion of P4 pupils that performed well or very well decreased between 2011 and 2013, and again, slightly, between 2013 and 2015.
- At P7, performance stabilised between 2013 and 2015, after an initial fall between 2011 and 2013.
- S2 performance remained the same across all three survey years
Numeracy attainment in 2015

- Sixty-six per cent of P4 and P7 pupils performed well or very well in numeracy in 2015.
- Forty per cent of S2 pupils performed well or very well.
- The largest proportion of pupils not yet working within the level was at S2 (36 per cent).
- Boys outperformed girls in numeracy at S2, whereas there was no difference in the proportion of boys and girls performing well or very well at either P4 or P7.
- Pupils from the least deprived areas outperformed more deprived pupils across all stages.
Numeracy attainment over time - gender and deprivation
- The performance of P4 and P7 girls and boys was the same in 2015 as in 2013, after an initial decrease between 2011 and 2013. This resulted in an overall decrease in performance for these groups between 2011 and 2015.
- There was a fall in the performance of S2 girls between 2013 and 2015, which led to an overall fall between 2011 and 2015. The performance of boys in S2 remained the same across all three years.
- Cumulative changes between 2011 and 2013 and between 2013 and 2015 meant that, between 2011 and 2015, numeracy performance decreased for the least deprived P4 pupils, and P4 and P7 pupils from the most deprived and middle categories. Performance of all other groups remained the same.
- Between 2011 and 2015, the performance gap between least and most deprived pupils increased at P4 and remained the same for P7 and S2 pupils.
Pupil questionnaire results

- At P4, nine out of ten pupils agreed they enjoyed working with numbers. In P7, this was over three quarters of all pupils and, at S2, two thirds of all pupils.
- Nearly all pupils in all stages agree that they want to do well in learning and over 80 per cent of pupils can see the usefulness of what they learn in school.
- There has been increased use of ICT in the classroom compared to 2013 and pupils report high levels of confidence in using computers/tablets to carry out research.
Teacher questionnaire results

- The vast majority of primary and secondary Mathematics teachers are confident in teaching numeracy; secondary non-Mathematics teachers reported relatively lower levels of confidence.
- Teachers reported that pupils often talk about what they are learning with their peers and that they also have opportunities to explain how they have solved a problem in their own words.
Contact
There is a problem
Thanks for your feedback