Seasonal migrant workers in Scottish agriculture: research report
Outlines the main findings of research into seasonal migrant workers in Scottish agriculture, including: their number and demographics; the experiences of employers and seasonal migrant workers; and the long-term viability of this sector.
Appendix G: Technical Note on Macroanalysis
This section describes the approaches taken by the Fraser of Allander Institute to model the number of seasonal migrant workers in Scottish agriculture in 2021.
Techniques employed by Zubairi et al. 2020 for non-agricultural seasonal and temporary migrant workers and Thomson et al. (2018a), alongside the wider experience of the Fraser of Allander Institute informed this modelling.
Approaches to modelling the number of seasonal migrant workers
Different approaches can be utilised to estimate the number of seasonal migrant workers. Approaches modelled all utilised data from the Employer Survey (Appendix B) and some utilised data from the Scottish Agricultural Census.
Table G.1 summarises the limitations of two of the approaches, a non-weighting approach and an econometric approach.
Table G.1: Rejected Approaches
Non-weighting
Assumptions and Description:
Assuming that the Employer Survey sample is representative of the whole population of farms, and
Assuming that the proportion of total hours worked by seasonal migrant workers in our sample is the same in the wider population
Results and Robustness:
This would suggest that on average – among all farms – 2.6% of all hours worked are worked by seasonal migrant workers.
However, the size of core sample and non-response to variables in the Employer Survey limits confidence in this estimate.
Econometric
Assumptions and Description:
Econometric modelling utilising
Scottish Government data on hectares of each crop and standard labour input requirements.
This approach has been tried before in a similar analysis (Thomson et al. 2018). It uses regression modelling to estimate the relationship between crop type (measured in hectares) and labour input (total and seasonal) using the Employer Survey.
We arrive at an estimate of the average labour input (total and seasonal) per hectare of each crop (these being the regression coefficient on each crop hectare variable). We can use information on crop hectares (taken from the Scottish Agricultural Census) to establish a measure of labour input (total and seasonal).
Hours workedi
= α+β1Crop1i
+ β2Crop2i +...
+ βnCropni + βjControlsji
+ εi
Where there are n different crops specified in the regression, and j different control variables (in practice these are the number of different types of livestock on the farm). We estimate this model using both ordinary least squares (OLS) and non-negative least squares (NNLS) methods. The latter constrains the β coefficients above to be non-negative. NNLS was the approach taken by Thomson et al (2018), and as we will see the differences relative to using OLS are small in practice.
Assumptions and Description:
The estimates derived using this approach of the number of hours worked by Seasonal migrant workers across each method were very high, indeed implausibly so.
The estimates suggest anywhere between 13.7 million and 14.2 million hours were worked by Seasonal migrant workers.
These were 5 – 10 times larger than the estimates derived from our final approach (see section below) and more than double the hours worked by casual and seasonal estimated in Table 2.4.
This is likely an artefact of the very small and self-selected sample of farms using Seasonal migrant workers who responded to the Employer Survey.
Final approach to estimating the number of seasonal migrant workers
The final approach taken to estimate the number of seasonal migrant workers employed reweighting techniques to derive a range. In summary, reweighting consisted of:
1. Reweighting our estimate of the number of seasonal migrant workers using data on approximate total number of seasonal migrant workers each month (question 16 Appendix B) by the overall scale of casual and seasonal worker use in the Agricultural Census.
2. Reweighting our estimate of the number of seasonal migrant workers using data on approximately what proportion of casual and seasonal workers were Seasonal Workers Pilot or Other seasonal migrant workers (question 11 Appendix B) by the overall scale of casual and seasonal worker use in the Agricultural Census
The Scottish Agricultural Census puts the number of casual and seasonal staff in 2021 at 8,003 (Table G.2).
| Data source | (a) | (b) | (c) | (d) |
|---|---|---|---|---|
| Workers | Weeks worked | Hours per week | Total annual hours worked | |
| Regular full-time staff total | 13,386 | 48 | 46 | 29,826,150 |
| Regular part-time staff total | 7,712 | 48 | 21 | 7,673,008 |
| Casual and seasonal staff | 8,003 | 30 | 27 | 6,483,630 |
| 43,982,788 |
Notes: Data in column (a) are taken from the 2021 Agricultural Census, column (b) reflects a modelling assumption, and data for column (c) are from the Employer Survey.
To give more detail on the first reweighting estimate:
- This suggests that Employer Survey respondents employed 4,908 casual and seasonal workers.
- Applying this weighting factor of (8003/4908) to our estimate of Seasonal migrant workers (1,798), derived from question 15 of the Employer Survey provides an estimate of 2,932 Seasonal migrant workers.
- This assumes that the ratio of seasonal migrant worker to casual seasonal workers in the Employer Survey is 'true' and produces an annual figure of 2,374,778 hours worked by seasonal migrant workers assuming that they work 30 weeks a year on average at 27 hours a week (as in Table G.2), which translate to 296,847 days. This assumes an eight hour day which is corroborated by the 8.6 hour a day working average from the later Worker Survey (see section 5.2).
To give more detail on the second reweighting estimate:
- Utilises question 12 of the Employer Survey. This asked respondents to specify approximately what proportion of their total number of casual and seasonal workers were from different categories, including the Seasonal Workers Pilot and other migrant workers from outside UK and EU.
- Taking these data on proportions and applying them to the number of casual and seasonal workers in the 40 businesses in the core sample provides an estimate of 2,742 seasonal migrant workers.
- Applying the same weighting to this figure as in Approach 2 provides an estimate of 4,471 Seasonal migrant workers.
Including 'EU Settled Status' in this calculation, we arrive at an estimate of 6,570 Seasonal migrant workers.
Seasonal migrant workers as part of the overall workforce and the casual and seasonal workforce
The first step in understanding seasonal migrant worker usage is to understand the scale of casual and seasonal staff employment, which includes both migrant and local workers. There are two ways to understand the presence of casual and seasonal staff. The first is using the Employer Survey question which asks respondents to indicate whether they employ casual and seasonal staff (question 8 Appendix B).
The second uses information from the question asking respondents about the number of staff they have across categories) including casual and seasonal staff (question 9 Appendix B). In theory, these should be aligned, but in practice, they are not perfectly so. There were 27 respondents who said they did not use casual and seasonal staff but said that they did employ more than one casual and seasonal staff in the subsequent question. The decision was taken to recode these as having casual and seasonal staff. This recode resulted in updated descriptive statistics on these two survey questions for the 193 completed responses from farms with casual and seasonal staff (19.7% of the Employer Survey sample).
Respondents with casual and seasonal staff, employed 4 to 5 on average. There was a large standard deviation reflecting the fact that some farms employ a small number of casual and seasonal workers while others employ a much larger number (up to 1,000).
| Mean | Standard Deviation | Min | Max | Count | |
|---|---|---|---|---|---|
| Q8: In 2021, what categories of workforce were working in the agricultural business? (Please select all that apply) [Full-time regular staff, Part-time regular staff, Casual and seasonal staff, None of the above] | 0.197 | 0.398 | 0 | 1 | 1056 |
| Q9: Approximately how many in 2021? [Casual and seasonal staff] | 4.648 | 49.457 | 0 | 1000 | 1056 |
Next the Employer Survey was utilised to disaggregate the subset of seasonal migrant workers from the wider group of casual and seasonal workers (see question 11 Appendix B). There were 40 respondents with casual and seasonal workers and indicated they have seasonal migrant workers, and 153 with casual seasonal workers but not seasonal migrant workers. These 40 respondents with seasonal migrant workers were therefore the core sample of seasonal migrant worker employers for this macroanalysis. Note that this core sample represents under 4% of the overall sample and just over 20% of employers that employ a seasonal and casual workforce.
Volume of work conducted by seasonal migrant workers
Ascertaining the volume of work can be estimated through the number of workers and the number of hours worked.
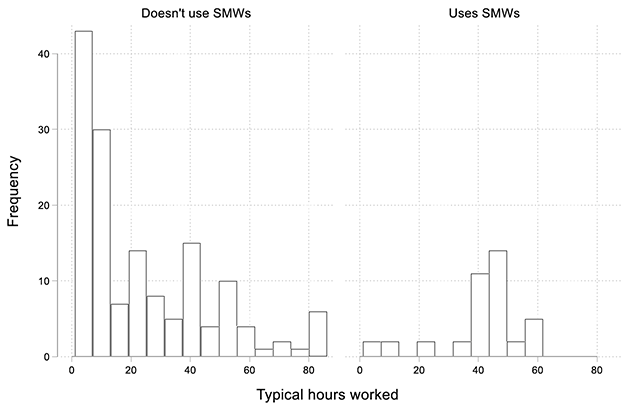
The Employer Survey provided data on the number of hours typically worked by different types of workers in these farms, including regular full-time and part-time staff, and casual and seasonal staff. 190 of the 193 respondents with casual and seasonal staff provide a non-zero estimate of the typical hours worked per week in 2021. See table G.4 broken down by whether the respondent employed seasonal migrant workers.
| Respondent | Mean | Standard Deviation | Min | Max | Count |
|---|---|---|---|---|---|
| Does not employ Seasonal migrant workers | 24.367 | 24.656 | 1 | 150 | 150 |
| Employs Seasonal migrant workers | 40.750 | 14.663 | 1 | 60 | 40 |
Recoding was conducted for reporting of over 80 hours a week to 80 hours per week. This recode affected three responses and led to updated descriptive statistics. The resulting distribution of typical hours worked is reported in Figure G.1. This distribution shows respondents with seasonal migrant workers typically report them working longer hours, and a smaller share of those using seasonal migrant workers having very low hours.
Of the core sample of 40 respondents employing seasonal migrant workers 32 provided a monthly breakdown of the numbers employed and typical weekly hours worked. However, there were data gaps to address before data could be further utilised:
- One respondent employed seasonal migrant workers but did not provide hours information. For this case, the data gap was filled by assuming their seasonal migrant worked the full-time working hours.
- Eight respondents did not report how many seasonal migrant workers they employed each month. For these cases it was assumed that they use seasonal migrant workers the average number of months that the other firms employed seasonal migrant workers (7.5).
Filling these data gaps enable the core sample size of 40 to be maintained.
Average hours worked per week for different categories of workers is reported in Table G.5.
| Mean | Standard Deviation | Min | Max | Count | |
|---|---|---|---|---|---|
| Full-time regular staff | 46.420 | 12.298 | 1 | 90 | 288 |
| Part-time regular staff | 20.728 | 12.190 | 1 | 60 | 206 |
| Casual and seasonal staff | 27.005 | 21.681 | 1 | 80 | 192 |
Next was the calculation of the number of hours that each type of worker undertook for each business. This is done on a 48-week basis for full-time and part-time staff and a 30-week basis for casual and seasonal staff including seasonal migrant workers (based on the average number of months the business employs seasonal migrant workers).
For two cases where the farm records a positive number of casual and seasonal workers, but the hours worked per week for both Full-time and casual seasonal migrant workers were missing, the average hours worked by casual and seasonal migrant workers in those firms that employ them was inserted.
This process results in a value for the hours worked in each farm, per year, by each category of worker. These data are summarised in Table G.6, for the subset of farms that report some positive number of total hours worked (we exclude farms that do not report any hours worked).
For the core sample, the hours worked on these farms by seasonal migrant workers was calculated as follows.
- Take the average number of seasonal migrant workers employed in a month by each business
- Multiply by the hours worked by casual and seasonal migrant workers on these farms.
- This gives us an indication of the average hours worked per week on each farm by Seasonal migrant workers.
- Multiply this by 30 to arrive at the total hours worked on the farm by seasonal migrant workers each year.
- To understand the relative contribution of seasonal migrant workers on these farms the share of labour input they represent was calculated (see Figure G.2 and Table G.7).
| Mean | Standard Deviation | Min | Max | Count | |
|---|---|---|---|---|---|
| Full-time regular staff | 6,924.34 | 22,645 | 0 | 275,424 | 393 |
| Part-time regular staff | 1,054.66 | 2,458 | 0 | 21,600 | 393 |
| Casual and seasonal staff | 16,466.30 | 107,999 | 0 | 1,350,000 | 393 |
| Employ Seasonal migrant workers | 153,639 | 30,9345 | 30 | 1,350,000 | 40 |
| Do not Employ Seasonal migrant workers | 922.66 | 2,525 | 0 | 24,300 | 353 |
| Total | 24,445.30 | 123,771 | 30 | 1,466,400 | 393 |
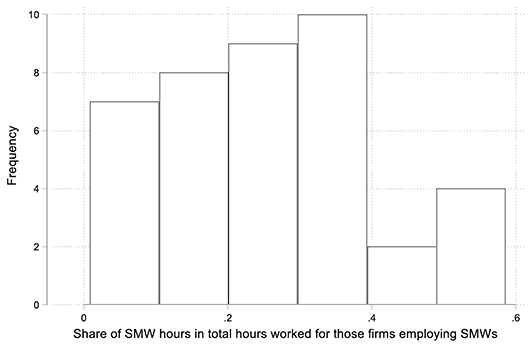
There were some respondents who have a high share over 58% of the total hours worked that are comprised of Seasonal migrant workers, but also some businesses where the share is far lower (the lowest is under 1%).
| Mean | Standard Deviation | Min | Max | Count | |
|---|---|---|---|---|---|
| All respondents | 0.026 | 0.091 | 0.000 | 0.586 | 393 |
| Employs Seasonal migrant workers | 0.256 | 0.153 | 0.008 | 0.586 | 40 |
Comparison between Employer Survey data and Scottish Agricultural Census Data
Table G.8 presents some comparisons between our sample and the 2021 Agricultural Census on key metrics such as crops grown.
| % of Agricultural Census | Agricultural Census | Employer Survey | |||||
|---|---|---|---|---|---|---|---|
| Min | Max | Average | Min | Max | Average | ||
| Total number of farms | 2.1% | ||||||
| Owned area | 4.8% | 0.01 | 38884.37 | 119.82 | 0.01 | 22000.00 | 249.73 |
| Rented area | 15.6% | 0.01 | 26880.00 | 82.87 | 0.01 | 80476.00 | 584.53 |
| Full-time | 9.2% | 1.00 | 257.00 | 2.06 | 0.00 | 151.00 | 1.17 |
| Part-time | 5.6% | 1.00 | 62.00 | 1.58 | 0.00 | 30.00 | 0.41 |
| Casual & seasonal | 61.3% | 1.00 | 603.00 | 3.31 | 0.00 | 1000.00 | 4.65 |
| Total cereal, oilseeds and protein crops | 4.6% | 0.01 | 1420.53 | 57.53 | 0.10 | 1190.00 | 119.81 |
| Total potatoes | 4.4% | 0.01 | 143.82 | 10.89 | 0.001 | 129.00 | 20.69 |
This shows the Employer Survey sampled around 2% of farms. This is a relatively small sample, despite contacting the entire sampling frame of the Agricultural Census.
The Employer Survey sample appears to contain a disproportionate response from farms employing casual and seasonal staff. This likely reflects the focus of the questionnaire (with survey recipients who do not employ casual and seasonal workers perhaps thinking it is not important that they respond given the subject matter).
Employer Survey respondents on average employ fewer full and part-time staff than in the Scottish Agricultural Census sample, but far more casual and seasonal staff than the average in the Scottish Agricultural Census.
The Employer Survey sample comprises around 4.5% of the Cereal etc and Potato crop hectares, the composition of this suggests that we've had responses from farms that on average are larger in terms of hectares of grown of these crops, consistent with our sample comprising a higher average size in terms of total hectares owned and rented.
In short – there are good reasons to believe the Employer Survey is not fully representative of the broader population of farms and agricultural employers in Scotland.
However, given that the Employer Survey contains a significant share of the casual and seasonal employers, weighting these as in the final modelling approach, would seem the most reasonable approach to grossing these survey results up to the broader population.
Contact
Email: socialresearch@gov.scot
There is a problem
Thanks for your feedback