Sexual orientation in Scotland 2017: summary of evidence base
Summary report of statistics and research on sexual orientation in Scotland.
3. Demographics
This section provides an overview of the demographic information available for lesbian, gay, bisexual and other (LGBO) adults. It provides some key statistics from the SSCQ 2015, as well as recent ONS data. There is then a brief overview of the literature on sexual orientation demographics.
i. Summary of Scottish Survey Core Questions 2015 Data
Figure 2: Sexual Orientation by Age - Scotland 2015

Source: Scottish Surveys Core Questions 2015
Figure 2 shows that the LGBO population in Scotland was much younger than the heterosexual population. Around three in ten (29 per cent) of LGBO adults were young adults (aged 16-24) - compared to around a sixth (14 per cent) of heterosexual adults. Only four percent of LGBO adults were aged 75+ compared to a tenth of heterosexual adults. It is important to bear the differing age profiles in mind when interpreting outcome results and where age-standardised results are available we have tried to present these to achieve like-for-like comparisons.
Figure 3: Sexual Orientation by Marital Status - Scotland 2015

Source: SSCQ 2015
Figure 3 shows that LGBO adults were twice as likely to be single and never married, compared with heterosexual adults (72 per cent compared to 34 per cent). LGBO adults were around three times less likely to be married (or in a civil partnership) than heterosexual adults. It should be noted that the LGBO group has a younger age profile.
ii. Summary of ONS Demographic Data
The ONS reports on 'sexual identity', which is a part of the wider concept of 'sexual orientation'. The concept of Sexual Identity excludes sexual attraction and sexual behaviour.
Figure 4: Sexual Identity in the UK Compared with Scotland - 2015

Source: ONS
The Office of National Statistics ( ONS) sexual identity estimates come from the Annual Population Survey ( APS) which includes respondents who are aged 16 and over. Figure 4 shows that Scotland had a similar proportion of LGB adults in comparison to the UK (1.7 per cent in the UK compared with 1.6 per cent in Scotland) in 2015. 2.8 per cent of the Scottish population did not know or refused to disclose their sexual identity, compared with 4.1 per cent of the UK population.
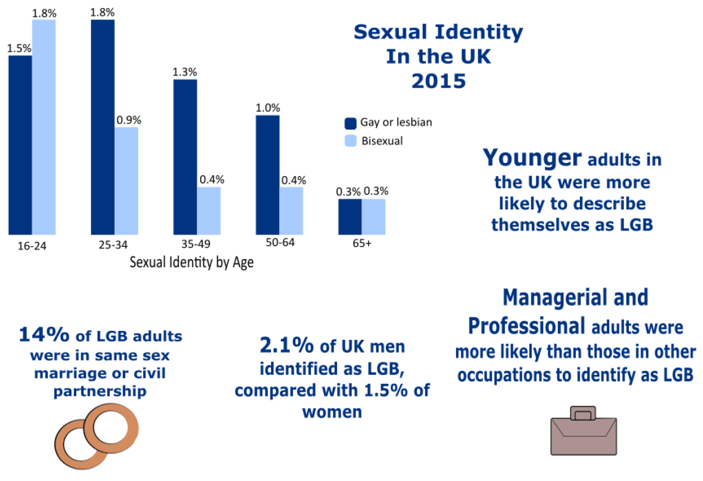
Figure 5: Sexual Identity Statistics - UK 2015

Figure 5 provides a summary of some UK-wide 2015 sexual identity statistics.
- 1.7 per cent of the UK population described themselves as lesbian, gay or bisexual.
- Men were more likely to identify (2.1 per cent) than women (1.5 per cent).
- Younger adults were more likely to self-identify - within the youngest category (16-24) 3.3 per cent of adults identified as LGB compared with only 0.6 per cent of those aged 65 or over.
- 14 per cent of LGB adults were either in a same sex marriage or civil partnership.
- 2.2 per cent of those in 'managerial and professional' occupations identified as LGB, compared to 1.6 per cent of those in 'intermediate' and 1.6 per cent of those in 'routine and manual' professions.
Full information on this data can be found in the Sexual identity, UK: 2015 Bulletin [11]
Figure 6: Sexual Identity by Ethnic Group - UK 2015

Source: ONS
Figure 6 shows that adults in the UK who identified their ethnicity as 'mixed or multiple' were most likely to self-identify as LGB (2.5 per cent). Adults of Asian ethnicity were least likely to identify as LGB (0.8 per cent).
iii. Summary of Literature on Sexual Orientation Demographics
The Annual Review of Human Rights Situation of Lesbian, Gay, Bisexual, Trans and Intersex People in Europe, published by ILGA Europe (2016), ranks the UK as third in Europe for LGBT rights with a score of 81 per cent following Malta (88 per cent) and Belgium (82 per cent) - see the Rainbow Map (Figure 7) [12] for country comparisons. It compares European countries on topics such as same sex marriage, parenting, asylum seekers, civil society and hate speech and homophobic violence.
Figure 7: Rainbow Map (ILGA Europe, 2016)

Source: ILGA
ILGA Europe (2016) cites that in 2015, 71 per cent of respondents to the EU's Eurobarometer agreed that LGB people and heterosexual people should have the same rights. For the UK, the report highlights various legal and institutional positions which have been taken in relation to LGBT people and groups. It cites Eurobarometer 2015 which shows that 58 per cent of UK respondents felt that sexual orientation discrimination was widespread (the same as the EU average) and 93 per cent would be comfortable with an LGB work colleague (compared with 72 per cent for the EU).
The Rainbow Map does not officially rank UK countries individually, however, Scotland met 90 per cent of ILGA's 48-point criteria which made it the most inclusive country for LGBTI equality and human rights legislation in 2016.
Contact
Email: Jon Hunter
There is a problem
Thanks for your feedback