Social capital and community wellbeing in Scotland
This report provides information about the extent and nature of social connections and social capital in Scotland from 2018/2019 - 2022. It draws on a range of data, from both the Scottish Household Survey and qualitative research, to explore social capital in Scotland.
2: What are the levels of social capital in Scotland?
The Scottish Household Survey is an annual, nationally representative survey of Scotland that provides a means of looking at levels of social capital at a national level, across different dimensions.[32]
Several questions (Figure 1) associated with social capital themes have been included in the survey to track change over time. Some of the questions have been asked each year since 2013 and provide a measure of change, and some of them are new (reported for the first time in 2019), and will provide trend data in the future.
Percentages in this report have been rounded to the nearest whole number. As a result of this calculated differences or changes may be out compared to the difference between the stated percentages.
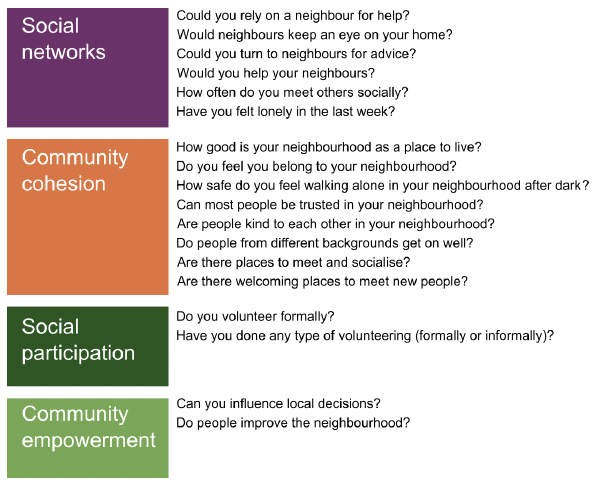
Social Networks
- Could you rely on a neighbour to help?
- Would neighbours keep an eye on your home?
- Could you turn to neighbours for advice?
- Would you help your neighbours in an emergency?
- How often do you meet others socially?
- Have you felt lonely in the last week?
Community Cohesion
- How good is your neighbourhood as a place to live?
- Do you feel you belong to your neighbourhood?
- How safe do you feel walking alone in your neighbourhood after dark?
- Can most people be trusted in your neighbourhood?
- Are people kind to each other in your neighbourhood? Do people from different backgrounds get on well?
- Are there places to meet and socialise?
- Are there welcoming places to meet new people?
Social Participation
- Do you volunteer formally?
- Have you done any type of volunteering (formally or informally)?
Community Empowerment
- Can you influence local decisions?
- Do local people take action to improve the neighbourhood?
High levels of social capital
Latest data from the Scottish Household Survey (SHS 2022) shows strong evidence of positive social connections in communities in Scotland (Figure 2).
Ninety-five per cent of respondents rate their neighbourhood as ‘good’ or ‘very good’, 91% of people say they would help their neighbours, 87% of people say people are kind to each other in their neighbourhood and 46% are involved in some type of volunteering, whether informally or formally.
There is also some less postive evidence. Findings from SHS shows that just under 1 in 4 people in Scotland (23%), said they experienced loneliness ‘in the last week’. If scaled up to a population level this is approximately one million people who routinely experience loneliness.
Eighteen per cent of people agreed that they have influence over local decisions. This means that a large proportion of people in Scotland (4 out of 5 people) do not feel that they can influence decisions about their area.
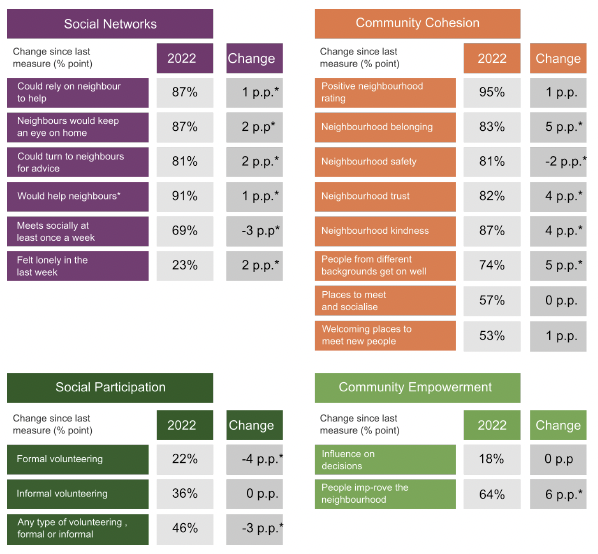
Percentage of people who agreed with the 18 statements within the Social Capital Index, by each of the four themes of Social Networks, Community Cohesion, Social Participation and Community, 2022, Scotland.[33]
| Change since last measure (% point) | 2022 | Change |
|---|---|---|
| Could rely on neighbour to help | 87% | 1 p.p.* |
| Neighbours would keep an eye on home | 87% | 2 p.p.* |
| Could turn to neighbours for advice | 81% | 2 p.p.* |
| Would help neighbours* | 91% | 1 p.p.* |
| Meets socially at least once a week | 69% | -3 p.p.* |
| Felt lonely in the last week | 23% | 2 p.p.* |
| Change since last measure (% point) | 2022 | Change |
|---|---|---|
| Positive neighbourhood rating | 95% | 1 p.p. |
| Neighbourhood belonging | 83% | 5 p.p.* |
| Neighbourhood safety | 81% | -2 p.p.* |
| Neighbourhood trust | 82% | 4 p.p.* |
| Neighbourhood kindness | 87% | 4 p.p.* |
| People from different backgrounds get on well | 74% | 5 p.p.* |
| Places to meet and socialise | 57% | 0 p.p. |
| Welcoming places to meet new people | 53% | 1 p.p. |
| Change since last measure (% point) | 2022 | Change |
|---|---|---|
| Formal volunteering | 22% | -4 p.p.* |
| Informal volunteering | 36% | 0 p.p. |
| Any type of volunteering, formal or informal | 46% | -3 p.p.* |
| Change since last measure (% point) | 2022 | Change |
|---|---|---|
| Influence on decisions | 18% | 0 p.p. |
| People improve the neighbourhood | 64% | 6 p.p.* |
“Even with just a bit of contact, you get to know people’s situations. And then you know, if there is an emergency, they come into your mind and you know they might need some help.” (People’s Panel member, refelcting on what community means to them, 2022)
“I read on my own, but also share that expereince through my book group which is based in my local libary. That group has helpd me to build my local freindships at a time when I feel lonely as I am loosing a freind.” (Respondent from the free text survey reflecting on how taking part in cultural activities makes them feel, 2024)
Social capital has decreased in Scotland since 2013
To show changes in social capital over time, these survey questions have been monitored annually from a base year of 2013, and aggregated into a ‘data index’, that tracks changes in levels.[34]
Values were set at ‘100’ in 2013 and the index shows the percentage change for subsequent years relative to the 2013 position. The trends in each of the variables have been monitored as well as the aggregated four themes (based on an equal weighting of the variables) and an overall trend (based on an equal weighting of the four themes).[35] More detailed information about the method for calculating the index is provided in Annex D.
A main function of the index is to highlight changes at a national Scotland level and from 2019 to 2022, the overall index remained stable.
The social capital index (Figure 3) indicates that since 2013 there has been an overall decline, with the index reducing to 93.4 in 2022, but the overall social capital index has remained stable since 2019.
There are however changes for the underlying four themes. There has been a significant decrease in Social Participation theme since 2019, with a drop of 9.1 points, driven by a large reduction in formal volunteering (down 15.9 points). However, any volunteering (formal or informal) has only decreased by 2.5 points over this period. This is because informal only volunteering (which contributes to the total volunteering figure) has actually increased since 2019.
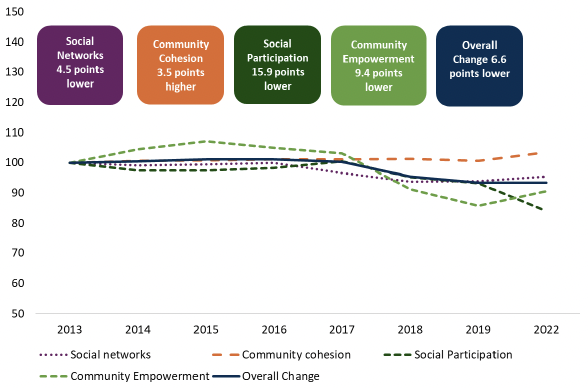
Changes in the social capital index score, and score for each of the four themes of Social Networks, Community Cohesion, Social Participation and Community Empowerment, 2013 to 2022, Scotland.
A decrease in volunteering is a main reason for the decrease in social capital
The overall decline in the social capital index since 2013 was primarily driven by substantial decreases in the Social Participation theme (which measures informal and formal volunteering[36]). This was a drop of 15.9 points, with a significant reduction in the proportion of people who engaged in formal volunteering, (drop of 22.2 points), and the proportion of people who engaged in informal volunteering remained similar.[37]
The Community Empowerment theme also saw a significant drop from 2013 (down 9.4 points), as fewer individuals felt they had influence over local decisions (down 19.2 points).
Additionally, there was a smaller but still notable decline in Social Networks (drop of 4.5 points), as fewer people could turn to someone in a neighbourhood for advice (drop of 6.4 points), could count on a neighbour to keep an eye on their home (drop of 4.7 points), could rely on a neighbour to help (drop of 3.8 points) and would help a neighbour (drop of 3.0 points).
Since 2013, however, there have been improvements in the Community Cohesion theme (an increase of 3.5 points).This has mainly been driven by an increase in neighbourhood belonging (up 6.7 points).
There have been improvements in Social Capital since 2019
Despite reductions in social participation, there were improvements in the other three themes (see Figure 4). The Community Empowerment theme saw the most significant increase since 2019, rising by 4.9 points. This was driven by a substantial increase in the number of people who believe local people take action to improve their communities, which rose by 9.8 points.
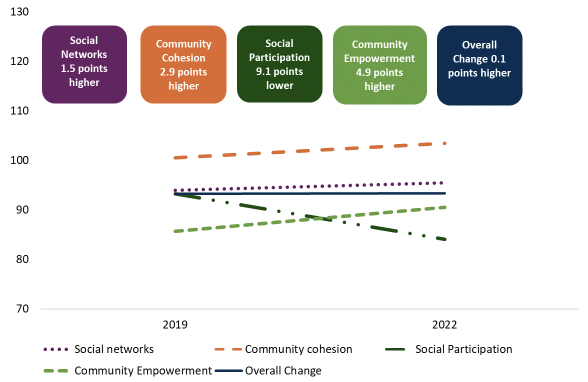
Changes in the social capital index score, and score for each of the four themes of Social Networks, Community Cohesion, Social Participation and Community Empowerment, 2019 to 2022, Scotland
Improvements have also been seen in Community Cohesion (up 2.9 points) and Social Networks (up 1.5 points). Within these two themes, more people feel they live in a neighborhood where people from different backgrounds get on well together (up 6.8 points). There is also a stronger sense of belonging to their communities than before the pandemic (up 5.8 points), as well as increased feelings of neighborhood kindness (up 4.8 points) and neighborhood trust (up 4.7 points).
While there have been many improvements within the Social Networks theme, loneliness has also increased since before the pandemic (up 3.9 points). Additionally, there has been a change in how often people meet socially, with fewer people meeting others at least once a week (down 2.2 points since 2019).
Contact
Email: socialresearch@gov.scot
There is a problem
Thanks for your feedback