Social capital and community wellbeing in Scotland
This report provides information about the extent and nature of social connections and social capital in Scotland from 2018/2019 - 2022. It draws on a range of data, from both the Scottish Household Survey and qualitative research, to explore social capital in Scotland.
Annex B: Further tables showing changes between 2018 / 2019 and 2022 scores for every social capital measure by demographic group
Percentages in the following tables have been rounded to the nearest whole number. As a result of this calculated changes may be out compared to the difference between the stated table percentages.
*Green = Significant positive change Red = Significant negative change
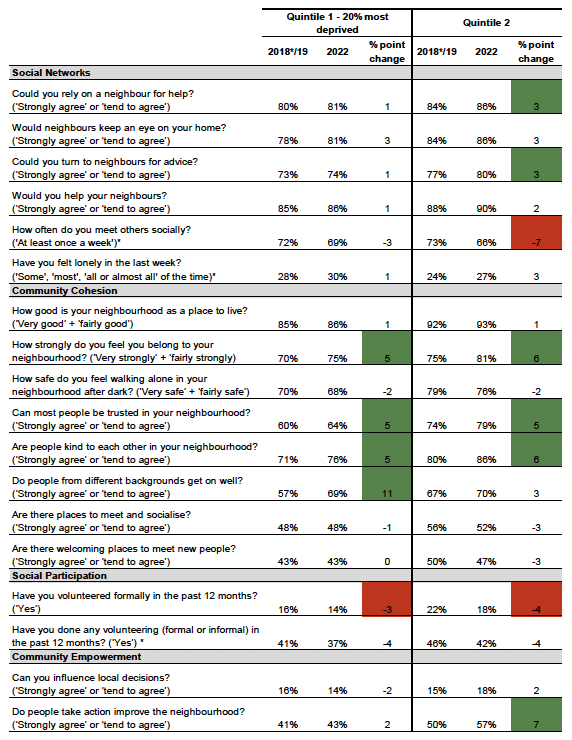
| Quintile 1 - 20% most deprived | Quintile 2 | ||||||
|---|---|---|---|---|---|---|---|
| 2018*/19 | 2022 | % point change | 2018*/19 | 2022 | % point change | ||
| Social Networks | Could you rely on a neighbour for help? (‘Strongly agree’ or ‘tend to agree’) | 80% | 81% | 1 | 84% | 86% | 3 (Green) |
| Would neighbours keep an eye on your home? (‘Strongly agree’ or ‘tend to agree’) | 78% | 81% | 3 | 84% | 86% | 3 | |
| Could you turn to neighbours for advice? (‘Strongly agree’ or ‘tend to agree’) | 73% | 74% | 1 | 77% | 80% | 3 (Green) | |
| Would you help your neighbours? (‘Strongly agree’ or ‘tend to agree’) | 85% | 86% | 1 | 88% | 90% | 2 | |
| How often do you meet others socially? ('At least once a week')* | 72% | 69% | -3 | 73% | 66% | -7 (Red) | |
| Have you felt lonely in the last week? ('Some', 'most', 'all or almost all' of the time)* | 28% | 30% | 1 | 24% | 27% | 3 | |
| Community Cohesion | How good is your neighbourhood as a place to live? (‘Very good’ + ‘fairly good’) | 85% | 86% | 1 | 92% | 93% | 1 |
| How strongly do you feel you belong to your neighbourhood? (‘Very strongly’ + ‘fairly strongly) | 70% | 75% | 5 (Green) | 75% | 81% | 6 (Green) | |
| How safe do you feel walking alone in your neighbourhood after dark? (‘Very safe’ + ‘fairly safe’) | 70% | 68% | -2 | 79% | 76% | -2 | |
| Can most people be trusted in your neighbourhood? (‘Strongly agree’ or ‘tend to agree’) | 60% | 64% | 5 (Green) | 74% | 79% | 5 (Green) | |
| Are people kind to each other in your neighbourhood? (‘Strongly agree’ or ‘tend to agree’) | 71% | 76% | 5 (Green) | 80% | 86% | 6 (Green) | |
| Do people from different backgrounds get on well? (‘Strongly agree’ or ‘tend to agree’) | 57% | 69% | 11 (Green) | 67% | 70% | 3 | |
| Are there places to meet and socialise? (‘Strongly agree’ or ‘tend to agree’) | 48% | 48% | -1 | 56% | 52% | -3 | |
| Are there welcoming places to meet new people? (‘Strongly agree’ or ‘tend to agree’) | 43% | 43% | 0 | 50% | 47% | -3 | |
| Social Participation | Have you volunteered formally in the past 12 months? (‘Yes’) | 16% | 14% | -3 (Red) | 22% | 18% | -4 (Red) |
| Have you done any volunteering (formal or informal) in the past 12 months? (‘Yes’) * | 41% | 37% | -4 | 46% | 42% | -4 | |
| Community Empowerment | Can you influence local decisions? (‘Strongly agree’ or ‘tend to agree’) | 16% | 14% | -2 | 15% | 18% | 2 |
| Do people take action improve the neighbourhood? (‘Strongly agree’ or ‘tend to agree’) | 41% | 43% | 2 | 50% | 57% | 7 (Green) | |
*Green = Significant positive change Red = Significant negative change
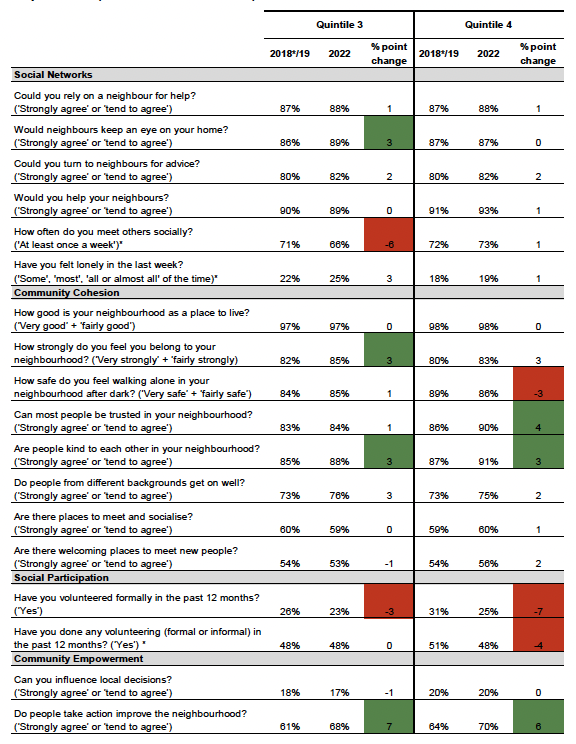
| Quintile 3 | Quintile 4 | ||||||
|---|---|---|---|---|---|---|---|
| 2018*/19 | 2022 | % point change | 2018*/19 | 2022 | % point change | ||
| Social Networks | Could you rely on a neighbour for help? (‘Strongly agree’ or ‘tend to agree’) | 87% | 88% | 1 | 87% | 88% | 1 |
| Would neighbours keep an eye on your home? (‘Strongly agree’ or ‘tend to agree’) | 86% | 89% | 3 (Green) | 87% | 87% | 0 | |
| Could you turn to neighbours for advice? (‘Strongly agree’ or ‘tend to agree’) | 80% | 82% | 2 | 80% | 82% | 2 | |
| Would you help your neighbours? (‘Strongly agree’ or ‘tend to agree’) | 90% | 89% | 0 | 91% | 93% | 1 | |
| How often do you meet others socially? ('At least once a week')* | 71% | 66% | -6 (Red) | 72% | 73% | 1 | |
| Have you felt lonely in the last week? ('Some', 'most', 'all or almost all' of the time)* | 22% | 25% | 3 | 18% | 19% | 1 | |
| Community Cohesion | How good is your neighbourhood as a place to live? (‘Very good’ + ‘fairly good’) | 97% | 97% | 0 | 98% | 98% | 0 |
| How strongly do you feel you belong to your neighbourhood? (‘Very strongly’ + ‘fairly strongly) | 82% | 85% | 3 (Green) | 80% | 83% | 3 | |
| How safe do you feel walking alone in your neighbourhood after dark? (‘Very safe’ + ‘fairly safe’) | 84% | 85% | 1 | 89% | 86% | -3 (Red) | |
| Can most people be trusted in your neighbourhood? (‘Strongly agree’ or ‘tend to agree’) | 83% | 84% | 1 | 86% | 90% | 4 (Green) | |
| Are people kind to each other in your neighbourhood? (‘Strongly agree’ or ‘tend to agree’) | 85% | 88% | 3 (Green) | 87% | 91% | 3 (Green) | |
| Do people from different backgrounds get on well? (‘Strongly agree’ or ‘tend to agree’) | 73% | 76% | 3 | 73% | 75% | 2 | |
| Are there places to meet and socialise? (‘Strongly agree’ or ‘tend to agree’) | 60% | 59% | 0 | 59% | 60% | 1 | |
| Are there welcoming places to meet new people? (‘Strongly agree’ or ‘tend to agree’) | 54% | 53% | -1 | 54% | 56% | 2 | |
| Social Participation | Have you volunteered formally in the past 12 months? (‘Yes’) | 26% | 23% | -3 (Red) | 31% | 25% | -7 (Red) |
| Have you done any volunteering (formal or informal) in the past 12 months? (‘Yes’) * | 48% | 48% | 0 | 51% | 48% | -4 (Red) | |
| Community Empowerment | Can you influence local decisions? (‘Strongly agree’ or ‘tend to agree’) | 18% | 17% | -1 | 20% | 20% | 0 |
| Do people take action improve the neighbourhood? (‘Strongly agree’ or ‘tend to agree’) | 61% | 68% | 7 (Green) | 64% | 70% | 6 (Green) | |
*Green = Significant positive change Red = Significant negative change
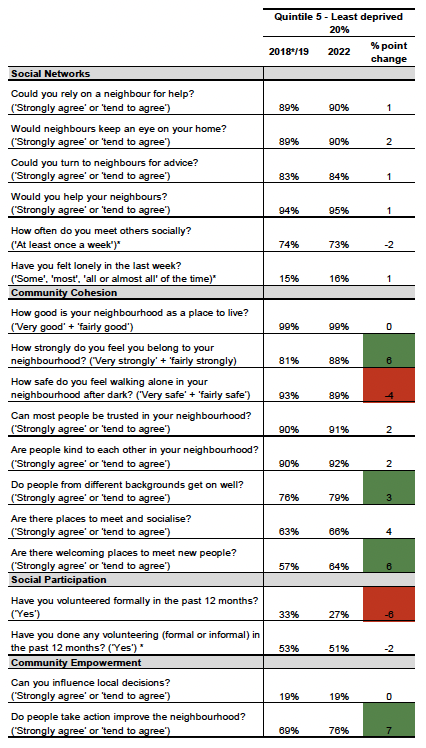
| Quintile 5 - Least deprived 20% | ||||
|---|---|---|---|---|
| 2018*/19 | 2022 | % point change | ||
| Social Networks | Could you rely on a neighbour for help? (‘Strongly agree’ or ‘tend to agree’) | 89% | 90% | 1 |
| Would neighbours keep an eye on your home? (‘Strongly agree’ or ‘tend to agree’) | 89% | 90% | 2 | |
| Could you turn to neighbours for advice? (‘Strongly agree’ or ‘tend to agree’) | 83% | 84% | 1 | |
| Would you help your neighbours? (‘Strongly agree’ or ‘tend to agree’) | 94% | 95% | 1 | |
| How often do you meet others socially? ('At least once a week')* | 74% | 73% | -2 | |
| Have you felt lonely in the last week? ('Some', 'most', 'all or almost all' of the time)* | 15% | 16% | 1 | |
| Community Cohesion | How good is your neighbourhood as a place to live? (‘Very good’ + ‘fairly good’) | 99% | 99% | 0 |
| How strongly do you feel you belong to your neighbourhood? (‘Very strongly’ + ‘fairly strongly) | 81% | 88% | 6 (Green) | |
| How safe do you feel walking alone in your neighbourhood after dark? (‘Very safe’ + ‘fairly safe’) | 93% | 89% | -4 (Red) | |
| Can most people be trusted in your neighbourhood? (‘Strongly agree’ or ‘tend to agree’) | 90% | 91% | 2 | |
| Are people kind to each other in your neighbourhood? (‘Strongly agree’ or ‘tend to agree’) | 90% | 92% | 2 | |
| Do people from different backgrounds get on well? (‘Strongly agree’ or ‘tend to agree’) | 76% | 79% | 3 (Green) | |
| Are there places to meet and socialise? (‘Strongly agree’ or ‘tend to agree’) | 63% | 66% | 4 | |
| Are there welcoming places to meet new people? (‘Strongly agree’ or ‘tend to agree’) | 57% | 64% | 6 (Green) | |
| Social Participation | Have you volunteered formally in the past 12 months? (‘Yes’) | 33% | 27% | -6 (Red) |
| Have you done any volunteering (formal or informal) in the past 12 months? (‘Yes’) * | 53% | 51% | -2 | |
| Community Empowerment | Can you influence local decisions? (‘Strongly agree’ or ‘tend to agree’) | 19% | 19% | 0 |
| Do people take action improve the neighbourhood? (‘Strongly agree’ or ‘tend to agree’) | 69% | 76% | 7 (Green) | |
*Green = Significant positive change Red = Significant negative change
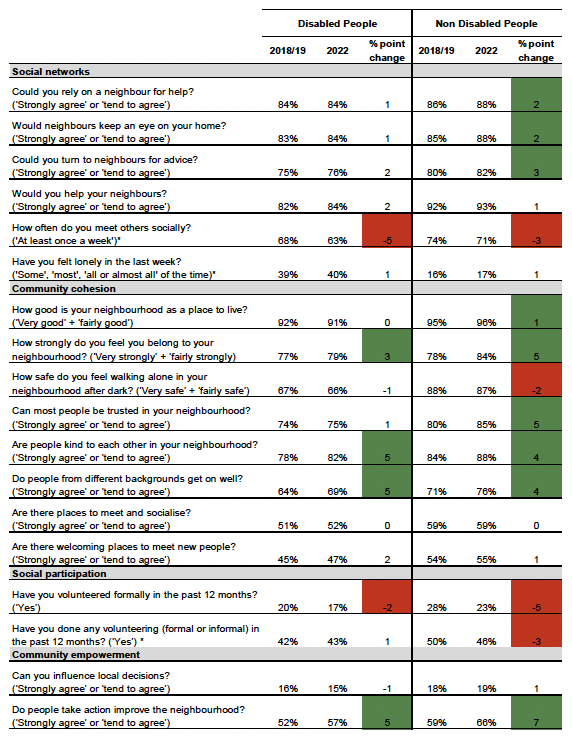
| Disabled People | Non Disabled People | ||||||
|---|---|---|---|---|---|---|---|
| 2018/19 | 2022 | % point change | 2018/19 | 2022 | % point change | ||
| Social networks | Could you rely on a neighbour for help? (‘Strongly agree’ or ‘tend to agree’) | 84% | 84% | 1 | 86% | 88% | 2 (Green) |
| Would neighbours keep an eye on your home? (‘Strongly agree’ or ‘tend to agree’) | 83% | 84% | 1 | 85% | 88% | 2 (Green) | |
| Could you turn to neighbours for advice? (‘Strongly agree’ or ‘tend to agree’) | 75% | 76% | 2 | 80% | 82% | 3 (Green) | |
| Would you help your neighbours? (‘Strongly agree’ or ‘tend to agree’) | 82% | 84% | 2 | 92% | 93% | 1 | |
| How often do you meet others socially? ('At least once a week')* | 68% | 63% | -5 (Red) | 74% | 71% | -3 (Red) | |
| Have you felt lonely in the last week? ('Some', 'most', 'all or almost all' of the time)* | 39% | 40% | 1 | 16% | 17% | 1 | |
| Community cohesion | How good is your neighbourhood as a place to live? (‘Very good’ + ‘fairly good’) | 92% | 91% | 0 | 95% | 96% | 1 (Green) |
| How strongly do you feel you belong to your neighbourhood? (‘Very strongly’ + ‘fairly strongly) | 77% | 79% | 3 (Green) | 78% | 84% | 5 (Green) | |
| How safe do you feel walking alone in your neighbourhood after dark? (‘Very safe’ + ‘fairly safe’) | 67% | 66% | -1 | 88% | 87% | -2 (Red) | |
| Can most people be trusted in your neighbourhood? (‘Strongly agree’ or ‘tend to agree’) | 74% | 75% | 1 | 80% | 85% | 5 (Green) | |
| Are people kind to each other in your neighbourhood? (‘Strongly agree’ or ‘tend to agree’) | 78% | 82% | 5 (Green) | 84% | 88% | 4 (Green) | |
| Do people from different backgrounds get on well? (‘Strongly agree’ or ‘tend to agree’) | 64% | 69% | 5 (Green) | 71% | 76% | 4 (Green) | |
| Are there places to meet and socialise? (‘Strongly agree’ or ‘tend to agree’) | 51% | 52% | 0 | 59% | 59% | 0 | |
| Are there welcoming places to meet new people? (‘Strongly agree’ or ‘tend to agree’) | 45% | 47% | 2 | 54% | 55% | 1 | |
| Social participation | Have you volunteered formally in the past 12 months? (‘Yes’) | 20% | 17% | -2 (Red) | 28% | 23% | -5 (Red) |
| Have you done any volunteering (formal or informal) in the past 12 months? (‘Yes’) * | 42% | 43% | 1 | 50% | 46% | -3 (Red) | |
| Community empowerment | Can you influence local decisions? (‘Strongly agree’ or ‘tend to agree’) | 16% | 15% | -1 | 18% | 19% | 1 |
| Do people take action improve the neighbourhood? (‘Strongly agree’ or ‘tend to agree’) | 52% | 57% | 5 (Green) | 59% | 66% | 7 (Green) | |
*Green = Significant positive change Red = Significant negative
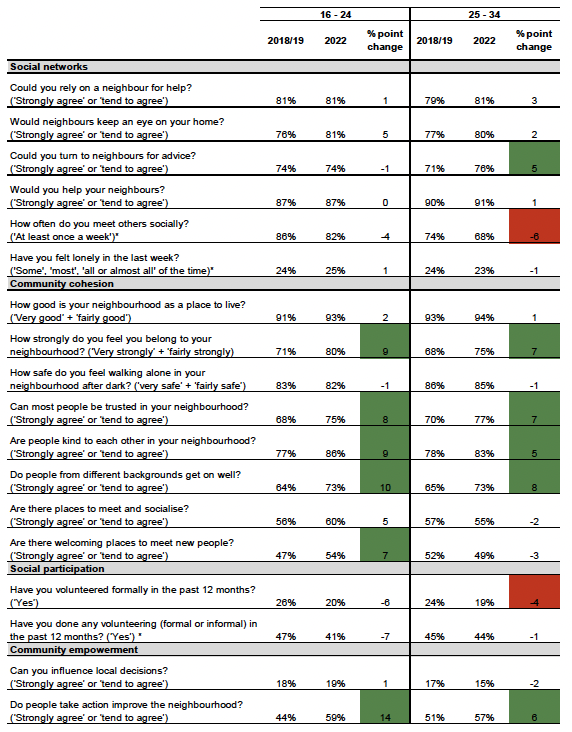
| 16 - 24 | 25 - 34 | ||||||
|---|---|---|---|---|---|---|---|
| 2018/19 | 2022 | % point change | 2018/19 | 2022 | % point change | ||
| Social networks | Could you rely on a neighbour for help? (‘Strongly agree’ or ‘tend to agree’) | 81% | 81% | 1 | 79% | 81% | 3 |
| Would neighbours keep an eye on your home? (‘Strongly agree’ or ‘tend to agree’) | 76% | 81% | 5 | 77% | 80% | 2 | |
| Could you turn to neighbours for advice? (‘Strongly agree’ or ‘tend to agree’) | 74% | 74% | -1 | 71% | 76% | 5 (Green) | |
| Would you help your neighbours? (‘Strongly agree’ or ‘tend to agree’) | 87% | 87% | 0 | 90% | 91% | 1 | |
| How often do you meet others socially? ('At least once a week')* | 86% | 82% | -4 | 74% | 68% | -6 (Red) | |
| Have you felt lonely in the last week? ('Some', 'most', 'all or almost all' of the time)* | 24% | 25% | 1 | 24% | 23% | -1 | |
| Community cohesion | How good is your neighbourhood as a place to live? (‘Very good’ + ‘fairly good’) | 91% | 93% | 2 | 93% | 94% | 1 |
| How strongly do you feel you belong to your neighbourhood? (‘Very strongly’ + ‘fairly strongly) | 71% | 80% | 9 (Green) | 68% | 75% | 7 (Green) | |
| How safe do you feel walking alone in your neighbourhood after dark? (‘very safe’ + ‘fairly safe’) | 83% | 82% | -1 | 86% | 85% | -1 | |
| Can most people be trusted in your neighbourhood? (‘Strongly agree’ or ‘tend to agree’) | 68% | 75% | 8 (Green) | 70% | 77% | 7 (Green) | |
| Are people kind to each other in your neighbourhood? (‘Strongly agree’ or ‘tend to agree’) | 77% | 86% | 9 (Green) | 78% | 83% | 5 (Green) | |
| Do people from different backgrounds get on well? (‘Strongly agree’ or ‘tend to agree’) | 64% | 73% | 10 (Green) | 65% | 73% | 8 (Green) | |
| Are there places to meet and socialise? (‘Strongly agree’ or ‘tend to agree’) | 56% | 60% | 5 | 57% | 55% | -2 | |
| Are there welcoming places to meet new people? (‘Strongly agree’ or ‘tend to agree’) | 47% | 54% | 7 (Green) | 52% | 49% | -3 | |
| Social participation | Have you volunteered formally in the past 12 months? (‘Yes’) | 26% | 20% | -6 | 24% | 19% | -4 (Red) |
| Have you done any volunteering (formal or informal) in the past 12 months? (‘Yes’) * | 47% | 41% | -7 | 45% | 44% | -1 | |
| Community empowerment | Can you influence local decisions? (‘Strongly agree’ or ‘tend to agree’) | 18% | 19% | 1 | 17% | 15% | -2 |
| Do people take action improve the neighbourhood? (‘Strongly agree’ or ‘tend to agree’) | 44% | 59% | 14 (Green) | 51% | 57% | 6 (Green) | |
*Green = Significant positive change Red = Significant negative
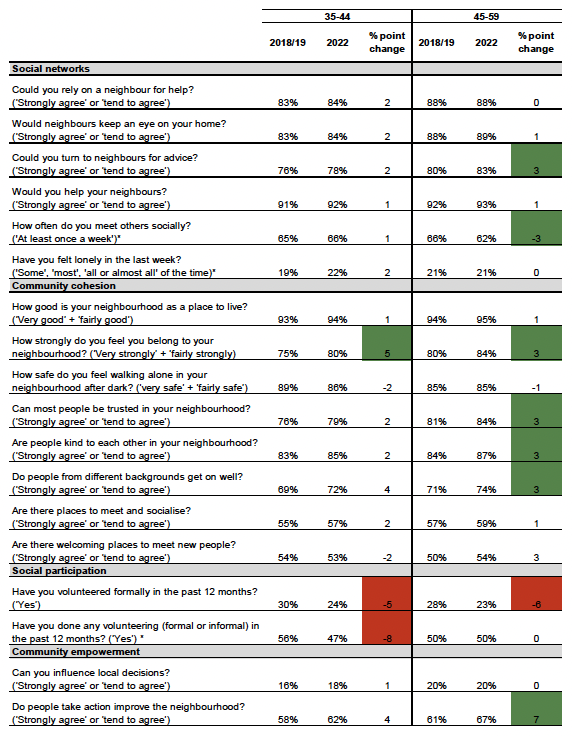
| 35-44 | 45-59 | ||||||
|---|---|---|---|---|---|---|---|
| 2018/19 | 2022 | % point change | 2018/19 | 2022 | % point change | ||
| Social networks | Could you rely on a neighbour for help? (‘Strongly agree’ or ‘tend to agree’) | 83% | 84% | 2 | 88% | 88% | 0 |
| Would neighbours keep an eye on your home? (‘Strongly agree’ or ‘tend to agree’) | 83% | 84% | 2 | 88% | 89% | 1 | |
| Could you turn to neighbours for advice? (‘Strongly agree’ or ‘tend to agree’) | 76% | 78% | 2 | 80% | 83% | 3 (Green) | |
| Would you help your neighbours? (‘Strongly agree’ or ‘tend to agree’) | 91% | 92% | 1 | 92% | 93% | 1 | |
| How often do you meet others socially? ('At least once a week')* | 65% | 66% | 1 | 66% | 62% | -3 (Green) | |
| Have you felt lonely in the last week? ('Some', 'most', 'all or almost all' of the time)* | 19% | 22% | 2 | 21% | 21% | 0 | |
| Community cohesion | How good is your neighbourhood as a place to live? (‘Very good’ + ‘fairly good’) | 93% | 94% | 1 | 94% | 95% | 1 |
| How strongly do you feel you belong to your neighbourhood? (‘Very strongly’ + ‘fairly strongly) | 75% | 80% | 5 (Green) | 80% | 84% | 3 (Green) | |
| How safe do you feel walking alone in your neighbourhood after dark? (‘very safe’ + ‘fairly safe’) | 89% | 86% | -2 | 85% | 85% | -1 | |
| Can most people be trusted in your neighbourhood? (‘Strongly agree’ or ‘tend to agree’) | 76% | 79% | 2 | 81% | 84% | 3 (Green) | |
| Are people kind to each other in your neighbourhood? (‘Strongly agree’ or ‘tend to agree’) | 83% | 85% | 2 | 84% | 87% | 3 (Green) | |
| Do people from different backgrounds get on well? (‘Strongly agree’ or ‘tend to agree’) | 69% | 72% | 4 | 71% | 74% | 3 (Green) | |
| Are there places to meet and socialise? (‘Strongly agree’ or ‘tend to agree’) | 55% | 57% | 2 | 57% | 59% | 1 | |
| Are there welcoming places to meet new people? (‘Strongly agree’ or ‘tend to agree’) | 54% | 53% | -2 | 50% | 54% | 3 | |
| Social participation | Have you volunteered formally in the past 12 months? (‘Yes’) | 30% | 24% | -5 (Red) | 28% | 23% | -6 (Red) |
| Have you done any volunteering (formal or informal) in the past 12 months? (‘Yes’) * | 56% | 47% | -8 (Red) | 50% | 50% | 0 | |
| Community empowerment | Can you influence local decisions? (‘Strongly agree’ or ‘tend to agree’) | 16% | 18% | 1 | 20% | 20% | 0 |
| Do people take action improve the neighbourhood? (‘Strongly agree’ or ‘tend to agree’) | 58% | 62% | 4 | 61% | 67% | 7 (Green) | |
*Green = Significant positive change Red = Significant negative
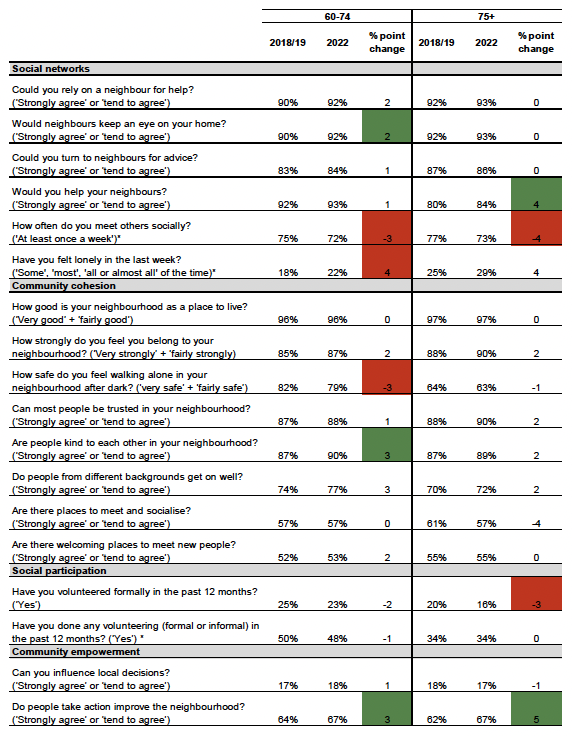
| 60-74 | 75+ | ||||||
|---|---|---|---|---|---|---|---|
| 2018/19 | 2022 | % point change | 2018/19 | 2022 | % point change | ||
| Social networks | Could you rely on a neighbour for help? (‘Strongly agree’ or ‘tend to agree’) | 90% | 92% | 2 | 92% | 93% | 0 |
| Would neighbours keep an eye on your home? (‘Strongly agree’ or ‘tend to agree’) | 90% | 92% | 2 (Green) | 92% | 93% | 0 | |
| Could you turn to neighbours for advice? (‘Strongly agree’ or ‘tend to agree’) | 83% | 84% | 1 | 87% | 86% | 0 | |
| Would you help your neighbours? (‘Strongly agree’ or ‘tend to agree’) | 92% | 93% | 1 | 80% | 84% | 4 (Green) | |
| How often do you meet others socially? ('At least once a week')* | 75% | 72% | -3 (Red) | 77% | 73% | -4 (Red) | |
| Have you felt lonely in the last week? ('Some', 'most', 'all or almost all' of the time)* | 18% | 22% | 4 (Red) | 25% | 29% | 4 | |
| Community cohesion | How good is your neighbourhood as a place to live? (‘Very good’ + ‘fairly good’) | 96% | 96% | 0 | 97% | 97% | 0 |
| How strongly do you feel you belong to your neighbourhood? (‘Very strongly’ + ‘fairly strongly) | 85% | 87% | 2 | 88% | 90% | 2 | |
| How safe do you feel walking alone in your neighbourhood after dark? (‘very safe’ + ‘fairly safe’) | 82% | 79% | -3 (Red) | 64% | 63% | -1 | |
| Can most people be trusted in your neighbourhood? (‘Strongly agree’ or ‘tend to agree’) | 87% | 88% | 1 | 88% | 90% | 2 | |
| Are people kind to each other in your neighbourhood? (‘Strongly agree’ or ‘tend to agree’) | 87% | 90% | 3 (Green) | 87% | 89% | 2 | |
| Do people from different backgrounds get on well? (‘Strongly agree’ or ‘tend to agree’) | 74% | 77% | 3 | 70% | 72% | 2 | |
| Are there places to meet and socialise? (‘Strongly agree’ or ‘tend to agree’) | 57% | 57% | 0 | 61% | 57% | -4 | |
| Are there welcoming places to meet new people? (‘Strongly agree’ or ‘tend to agree’) | 52% | 53% | 2 | 55% | 55% | 0 | |
| Social participation | Have you volunteered formally in the past 12 months? (‘Yes’) | 25% | 23% | -2 | 20% | 16% | -3 (Red) |
| Have you done any volunteering (formal or informal) in the past 12 months? (‘Yes’) * | 50% | 48% | -1 | 34% | 34% | 0 | |
| Community empowerment | Can you influence local decisions? (‘Strongly agree’ or ‘tend to agree’) | 17% | 18% | 1 | 18% | 17% | -1 |
| Do people take action improve the neighbourhood? (‘Strongly agree’ or ‘tend to agree’) | 64% | 67% | 3 (Green) | 62% | 67% | 5 (Green) | |
*Green = Significant positive change Red = Significant negative
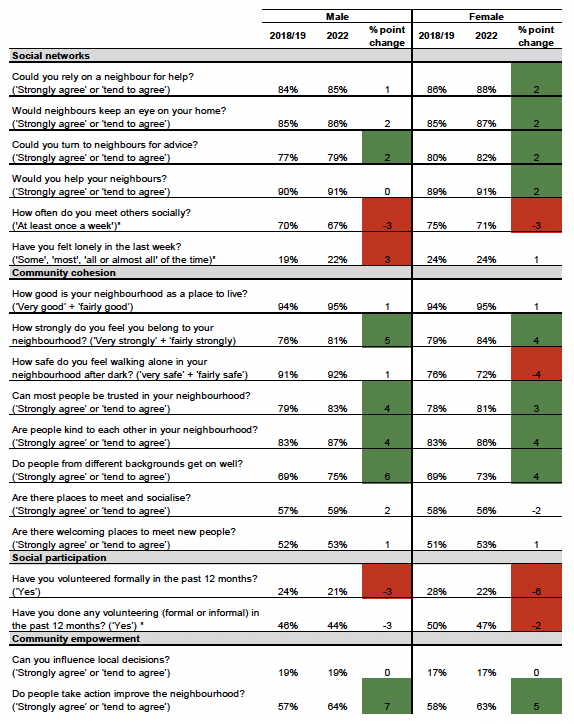
| Male | Female | ||||||
|---|---|---|---|---|---|---|---|
| 2018/19 | 2022 | % point change | 2018/19 | 2022 | % point change | ||
| Social networks | Could you rely on a neighbour for help? (‘Strongly agree’ or ‘tend to agree’) | 84% | 85% | 1 | 86% | 88% | 2 (Green) |
| Would neighbours keep an eye on your home? (‘Strongly agree’ or ‘tend to agree’) | 85% | 86% | 2 | 85% | 87% | 2 (Green) | |
| Could you turn to neighbours for advice? (‘Strongly agree’ or ‘tend to agree’) | 77% | 79% | 2 (Green) | 80% | 82% | 2 (Green) | |
| Would you help your neighbours? (‘Strongly agree’ or ‘tend to agree’) | 90% | 91% | 0 | 89% | 91% | 2 (Green) | |
| How often do you meet others socially? ('At least once a week')* | 70% | 67% | -3 (Red) | 75% | 71% | -3 (Red) | |
| Have you felt lonely in the last week? ('Some', 'most', 'all or almost all' of the time)* | 19% | 22% | 3 (Red) | 24% | 24% | 1 | |
| Community cohesion | How good is your neighbourhood as a place to live? (‘Very good’ + ‘fairly good’) | 94% | 95% | 1 | 94% | 95% | 1 |
| How strongly do you feel you belong to your neighbourhood? (‘Very strongly’ + ‘fairly strongly) | 76% | 81% | 5 (Green) | 79% | 84% | 4 (Green) | |
| How safe do you feel walking alone in your neighbourhood after dark? (‘very safe’ + ‘fairly safe’) | 91% | 92% | 1 | 76% | 72% | -4 (Red) | |
| Can most people be trusted in your neighbourhood? (‘Strongly agree’ or ‘tend to agree’) | 79% | 83% | 4 (Green) | 78% | 81% | 3 (Green) | |
| Are people kind to each other in your neighbourhood? (‘Strongly agree’ or ‘tend to agree’) | 83% | 87% | 4 (Green) | 83% | 86% | 4 (Green) | |
| Do people from different backgrounds get on well? (‘Strongly agree’ or ‘tend to agree’) | 69% | 75% | 6 (Green) | 69% | 73% | 4 (Green) | |
| Are there places to meet and socialise? (‘Strongly agree’ or ‘tend to agree’) | 57% | 59% | 2 | 58% | 56% | -2 | |
| Are there welcoming places to meet new people? (‘Strongly agree’ or ‘tend to agree’) | 52% | 53% | 1 | 51% | 53% | 1 | |
| Social participation | Have you volunteered formally in the past 12 months? (‘Yes’) | 24% | 21% | -3 (Red) | 28% | 22% | -6 (Red) |
| Have you done any volunteering (formal or informal) in the past 12 months? (‘Yes’) * | 46% | 44% | -3 | 50% | 47% | -2 (Red) | |
| Community empowerment | Can you influence local decisions? (‘Strongly agree’ or ‘tend to agree’) | 19% | 19% | 0 | 17% | 17% | 0 |
| Do people take action improve the neighbourhood? (‘Strongly agree’ or ‘tend to agree’) | 57% | 64% | 7 (Green) | 58% | 63% | 5 (Green) | |
Contact
Email: socialresearch@gov.scot
There is a problem
Thanks for your feedback