Social Tenants in Scotland 2015
This is a new statistical publication that presents an overview of social tenants and social rented housing in Scotland for the year 2015.
Section 2 – Number of Social Tenants and Social Housing Stock Provision
2.1 Number of people in social housing and stock levels
Social rented housing in Scotland in 2015 was provided by 26 of the 32 local authorities who owned and ran local authority housing stock, along with 160 housing associations who owned and ran housing association stock. Of the 32 local authorities, 6 did not directly manage social housing stock due to previous stock transfers to housing associations across the years 2003 to 2007, however they still provided some housing services such as homelessness support.
There were an estimated 1.14 million people living social rented housing in 2015, a similar figure to the estimated 1.15 million people in the previous year, and a decrease of 24% from an estimated 1.49 million people in 1999.
Social housing stock totaled 595,052 units in 2015, a slight increase of 86 homes from 594,966 units in 2014, but a decrease of 18% from 726,283 units in 1999.
Chart 2.1: Estimated Number of People in Social Housing, and Stock Levels, 1999 to 2015
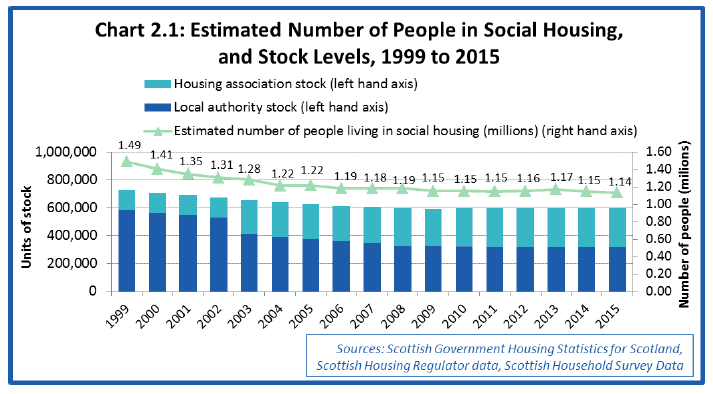
From 1999 to 2009 the number of people living in social housing in Scotland fell by 23% from an estimated 1.49 million people to 1.15 million people. During this time period the amount of social housing stock dropped by 18% from 726,300 to 594,100. The drop in the number of people was greater than the drop in the stock because the average size of a social rented household decreased from 2.1 people in 1999 to 2.0 people in 2009.
Since 2009 social housing stock levels have remained broadly stable at between around 594,000 and 597,000 units per year between 2009 and 2015. The number of people living in social housing between 2009 and 2015 has dropped slightly by an estimated 1% from 1.15 million to 1.14 million, due to a continued reduction in the average number of people per social household across these years.
The drop in levels of social housing stock between 1999 and 2009 can be attributed to the number of sales ( i.e. Right to Buy sales) and demolitions being higher than the number of units of new supply achieved through new build completions and other acquisitions of stock. Social housing stock levels have been broadly stable between 2009 and 2015, which suggests that the number of units lost each year across this time period has largely been balanced out by new supply provision.
Stock transfers in 6 local authority areas between 2003 and 2007 saw dwellings being transferred from local authority control to housing associations. Glasgow, Dumfries and Galloway and Scottish Borders transferred their stock in 2003, followed by Argyll and Bute and Na Eileanan Siar in 2006, and Inverclyde in 2007.
There was an average of 1.9 people per social household in 2015, an average of 1.6 adults and 0.4 children, a slight drop from the average of 2.0 people per social household in the previous year, and a decrease from the 2.1 people per social household in 1999. The drop from 1999 to 2015 has been largely due to a fall in the average number of children per household from 0.5 in 1999 to 0.4 in 2015.
Chart 2.2: Average number of people per household, social rented households
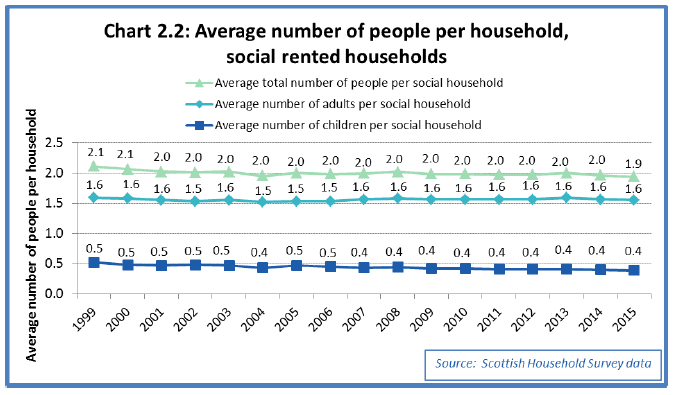
Table 2.1: Social housing stock, average number of people per household, and estimated number of people in social housing, 1999 to 2015
| Year | 1999 | 2000 | 2001 | 2002 | 2003 | 2004 | 2005 | 2006 | 2007 |
|---|---|---|---|---|---|---|---|---|---|
| Local authority stock as at March | 584,375 | 564,783 | 546,962 | 527,454 | 414,256 | 388,160 | 373,554 | 361,876 | 345,744 |
| Housing association stock as at March | 127,894 | 130,925 | 138,709 | 143,188 | 238,472 | 251,074 | 251,475 | 251,100 | 261,447 |
| Total social housing stock as at March | 726,283 | 707,267 | 691,524 | 673,819 | 654,730 | 640,392 | 625,508 | 612,976 | 607,191 |
| Vacant local authority stock as at March | 19,843 | 21,530 | 22,062 | 20,746 | 16,474 | 14,399 | 14,050 | 12,060 | 10,289 |
| Estimated vacant housing assocation stock | 1,226 | 1,255 | 1,330 | 1,373 | 2,286 | 2,407 | 2,411 | 2,407 | 2,506 |
| Total estimated vacant social stock as at March | 21,069 | 22,785 | 23,392 | 22,119 | 18,760 | 16,806 | 16,461 | 14,467 | 12,795 |
| Estimated occupied social stock as at March | 705,214 | 684,482 | 668,132 | 651,700 | 635,970 | 623,586 | 609,047 | 598,509 | 594,396 |
| Average number of adults per social household | 1.6 | 1.6 | 1.6 | 1.5 | 1.6 | 1.5 | 1.5 | 1.5 | 1.6 |
| Average number of children per social household | 0.5 | 0.5 | 0.5 | 0.5 | 0.5 | 0.4 | 0.5 | 0.5 | 0.4 |
| Average total number of people per social household | 2.1 | 2.1 | 2.0 | 2.0 | 2.0 | 2.0 | 2.0 | 2.0 | 2.0 |
| Estimated number of adults in social housing (millions) | 1.12 | 1.08 | 1.04 | 1.00 | 0.99 | 0.95 | 0.93 | 0.92 | 0.93 |
| Estimated number of children in social housing (millions) | 0.37 | 0.33 | 0.31 | 0.31 | 0.30 | 0.27 | 0.29 | 0.27 | 0.26 |
| Estimated total number of people in social housing (millions) | 1.49 | 1.41 | 1.35 | 1.31 | 1.28 | 1.22 | 1.22 | 1.19 | 1.18 |
| Year | 2008 | 2009 | 2010 | 2011 | 2012 | 2013 | 2014 | 2015 | |
| Local authority stock as at March | 329,524 | 325,648 | 323,138 | 319,878 | 319,384 | 318,160 | 317,572 | 317,005 | |
| Housing association stock as at March | 269,398 | 268,427 | 272,401 | 274,996 | 277,484 | 277,379 | 277,394 | 278,047 | |
| Total social housing stock as at March | 598,922 | 594,075 | 595,539 | 594,874 | 596,868 | 595,539 | 594,966 | 595,052 | |
| Local authority vacant stock as at March | 9,269 | 9,120 | 9,756 | 7,667 | 7,847 | 7,013 | 6,556 | 6,515 | |
| Estimated vacant housing assocation stock | 2,583 | 2,573 | 2,710 | 2,605 | 2,576 | 2,855 | 2,470 | 2,676 | |
| Total estimated vacant social stock as at March | 11,852 | 11,693 | 12,466 | 10,272 | 10,423 | 9,868 | 9,026 | 9,191 | |
| Estimated occupied social stock as at March | 587,070 | 582,382 | 583,073 | 584,602 | 586,445 | 585,671 | 585,940 | 585,861 | |
| Average number of adults per social household | 1.6 | 1.6 | 1.6 | 1.6 | 1.6 | 1.6 | 1.6 | 1.6 | |
| Average number of children per social household | 0.4 | 0.4 | 0.4 | 0.4 | 0.4 | 0.4 | 0.4 | 0.4 | |
| Average total number of people per social household | 2.0 | 2.0 | 2.0 | 2.0 | 2.0 | 2.0 | 2.0 | 1.9 | |
| Estimated number of adults in social housing (millions) | 0.93 | 0.91 | 0.91 | 0.91 | 0.91 | 0.93 | 0.91 | 0.91 | |
| Estimated number of children in social housing (millions) | 0.26 | 0.24 | 0.24 | 0.24 | 0.24 | 0.24 | 0.23 | 0.23 | |
| Estimated total number of people in social housing (millions) | 1.19 | 1.15 | 1.15 | 1.15 | 1.16 | 1.17 | 1.15 | 1.14 |
Sources: Scottish Government Housing Statistics for Scotland, Scottish Housing Regulator data, Scottish Household Survey data
Notes: Vacant housing association stock has been estimated for the years 1999 to 2009 by applying a percentage figure 0f 0.96% to the total stock figures for each year, a proportion based on the vacant normal letting stock figures available across the years 2010 to 2015.
The number of people in social housing has been estimated by applying the average number of people per household to the number of social stock units after netting off vacant stock
Further detail on public sector stock figures is available from the 'Housing Statistics for Scotland 2016: Key Trends Summary' [1] and associated web tables [2] .
The introduction of Right to Buy legislation in 1979 had a substantial impact on the profile of Scottish housing, with nearly half a million social housing properties being sold from 1979 to 2015. The provision to end Right to Buy with a two year notice period was included in the Housing (Scotland) Act which received Royal Assent on 1 August 2014, and the scheme subsequently closed to all new applicants on 31 July 2016.
Further detail on Right to Buy sales statistics is available in the 'Housing Statistics for Scotland Key Trends Summary 2016' and associated web tables [3] [4].
Detailed statistics on other factors associated with social housing stock levels, such as new build housing by local authorities and housing associations, are available in the quarterly housing statistics updates [5] .
2.2 Local authorities and housing associations – stock levels and operating areas
Table 2.2 below shows the number and percentage of local authorities and housing associations by the size of their stock as at end March 2015. It can be seen that local authorities generally had a larger size of stock, with almost two-thirds (65%) of the 26 local authorities having stock levels between 5,001 and 20,000 homes, whilst more than eight in ten (83%) housing associations had stock levels of 2,500 homes or less.
Table 2.2: Social housing stock by size, 2015
| Stock size | Number of local authorities | Local authority % | Number of housing associations | Housing association % |
|---|---|---|---|---|
| 0 to 1,000 | 1 | 4% | 88 | 54% |
| Over 1,000 to 2,500 | 1 | 4% | 46 | 28% |
| Over 2,500 to 5,000 | 3 | 12% | 18 | 11% |
| Over 5,000 to 10,000 | 7 | 27% | 8 | 5% |
| Over 10,000 to 20,000 | 10 | 38% | 1 | 1% |
| Over 20,000 | 4 | 15% | 1 | 1% |
Sources: Scottish Government Housing Statistics for Scotland and Scottish Housing Regulator Stock data
Whilst local authorities operate within each of their own specific areas, housing associations can operate across different local authority areas. Table 2.3 below shows the number and percentage of housing associations by the number of different local authority areas that they operated in as at March 2015. It can be seen that 70% operated in a single local authority area; 18% operated in 2 to 5 different local authority areas, whilst the remaining 12% operated across 6 or more local authority areas.
Table 2.3: Housing association operating areas, 2015
| Number of local authority areas operated in | Number of housing associations | Housing association % |
|---|---|---|
| 1 | 113 | 70% |
| 2 to 5 | 29 | 18% |
| 6 to 10 | 10 | 6% |
| 11 to 20 | 4 | 2% |
| 21 or more | 6 | 4% |
Source: Scottish Housing Regulator Stock Data
Table 2.4 below shows the amount of social rented housing stock in each local authority area as at March 2015, split by local authority and housing association stock. The 6 stock transfer authorities had no local authority stock. For the other 26 local authorities, local authority stock as a proportion of all social stock varied from 52% in the City of Edinburgh to 83% in Aberdeen City. At a Scotland level 53% of social rented housing stock was owned by local authorities, with 47% being owned by housing associations.
Table 2.4: Social housing stock in each local authority area, as at 31 March 2015
| Local Authority Area | Local authority stock | Housing association stock | Total social housing stock | % of stock that is Local authority | % of stock that is housing association | Total number of dwellings | Social stock as a proportion of all dwellings |
|---|---|---|---|---|---|---|---|
| Aberdeen City | 22,328 | 4,454 | 26,782 | 83% | 17% | 113,871 | 24% |
| Aberdeenshire | 12,856 | 4,598 | 17,454 | 74% | 26% | 114,655 | 15% |
| Angus | 7,764 | 3,476 | 11,240 | 69% | 31% | 55,443 | 20% |
| Argyll and Bute | - | 8,260 | 8,260 | - | 100% | 47,606 | 17% |
| Clackmannanshire | 4,989 | 1,935 | 6,924 | 72% | 28% | 24,055 | 29% |
| Dumfries and Galloway | - | 13,889 | 13,889 | - | 100% | 74,043 | 19% |
| Dundee City | 12,774 | 8,403 | 21,177 | 60% | 40% | 73,632 | 29% |
| East Ayrshire | 12,724 | 3,416 | 16,140 | 79% | 21% | 57,489 | 28% |
| East Dunbartonshire | 3,604 | 1,898 | 5,502 | 66% | 34% | 45,480 | 12% |
| East Lothian | 8,598 | 2,191 | 10,789 | 80% | 20% | 46,150 | 23% |
| East Renfrewshire | 3,003 | 1,381 | 4,384 | 68% | 32% | 37,957 | 12% |
| Edinburgh, City of | 19,920 | 18,066 | 37,986 | 52% | 48% | 240,479 | 16% |
| Falkirk | 16,328 | 3,465 | 19,793 | 82% | 18% | 72,957 | 27% |
| Fife | 29,902 | 8,854 | 38,756 | 77% | 23% | 172,896 | 22% |
| Glasgow City | - | 106,207 | 106,207 | - | 100% | 302,952 | 35% |
| Highland | 13,799 | 6,794 | 20,593 | 67% | 33% | 115,071 | 18% |
| Inverclyde | - | 10,043 | 10,043 | - | 100% | 38,743 | 26% |
| Midlothian | 6,868 | 3,138 | 10,006 | 69% | 31% | 38,417 | 26% |
| Moray | 5,996 | 2,309 | 8,305 | 72% | 28% | 43,942 | 19% |
| Na h-Eileanan Siar | - | 2,272 | 2,272 | - | 100% | 14,549 | 16% |
| North Ayrshire | 13,148 | 4,806 | 17,954 | 73% | 27% | 67,397 | 27% |
| North Lanarkshire | 36,834 | 9,481 | 46,315 | 80% | 20% | 151,859 | 30% |
| Orkney Islands | 926 | 692 | 1,618 | 57% | 43% | 10,870 | 15% |
| Perth and Kinross | 7,415 | 3,797 | 11,212 | 66% | 34% | 70,570 | 16% |
| Renfrewshire | 12,497 | 7,940 | 20,437 | 61% | 39% | 84,720 | 24% |
| Scottish Borders | - | 11,732 | 11,732 | - | 100% | 57,451 | 20% |
| Shetland Islands | 1,747 | 597 | 2,344 | 75% | 25% | 10,986 | 21% |
| South Ayrshire | 8,125 | 2,160 | 10,285 | 79% | 21% | 54,562 | 19% |
| South Lanarkshire | 25,201 | 6,536 | 31,737 | 79% | 21% | 147,387 | 22% |
| Stirling | 5,618 | 2,075 | 7,693 | 73% | 27% | 40,483 | 19% |
| West Dunbartonshire | 10,766 | 5,853 | 16,619 | 65% | 35% | 44,895 | 37% |
| West Lothian | 13,275 | 7,329 | 20,604 | 64% | 36% | 77,510 | 27% |
| Scotland | 317,005 | 278,047 | 595,052 | 53% | 47% | 2,549,072 | 23% |
Sources: Scottish Government Housing Statistics for Scotland and Scottish Housing Regulator Stock data
Note: Total dwellings for March 2015 are estimated based on an average of NRS dwelling counts from Sept 2014 and Sept 2015.
Total social rented housing stock as a percentage of all dwellings in 2015 varied from 12% in East Dunbartonshire and 12% in East Renfrewshire to 35% in Glasgow and 37% in West Dunbartonshire.
2.3 Stock by tenure, Scotland, England and Wales
Chart 2.3 and Table 2.5 below show stock by tenure for Scotland from 2001 to 2015. In 2015 Scotland had a total of 2.55 million dwellings. Social rented housing stock totalled 595 thousand dwellings, 23% of the total. There were 1.57 million owner occupied dwellings (62% of the total) and 382 thousand private rented dwellings (15% of the total).
From 2014 to 2015, the total number of dwellings in Scotland increased by 1%. The number of social rented properties stayed similar year on year (0% change), the number of private rented dwellings increased by 2%, and the number of owner occupier dwellings stayed similar year on year (0% change).
Over the longer term period from 2001 to 2015, the total number of dwellings in Scotland has increased by 10%. The number of social rented properties has dropped by 14%, whilst the number of private rented dwellings has more than doubled (a 121% increase), and the number of owner occupier dwellings has increased by 8%.
Chart 2.3: Stock by tenure (thousands of units), Scotland, 2001 to 2015
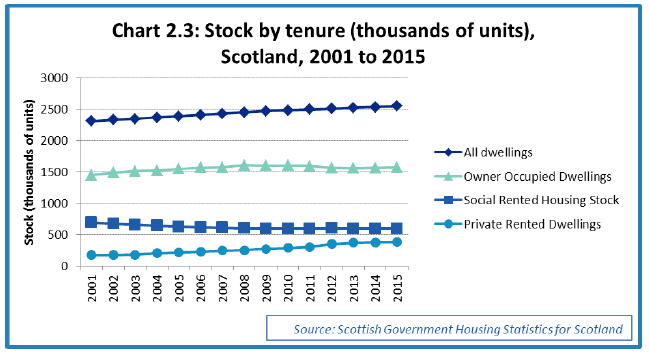
Table 2.5: Stock by tenure, Scotland, 2001 to 2015 (thousands of units)
| All dwellings | Social Rented Housing Stock | Private Rented Dwellings | Owner Occupied Dwellings | Social Rented Housing Stock (%) | Private Rented Dwellings (%) | Owner Occupied Dwellings (%) | |
|---|---|---|---|---|---|---|---|
| 2001 | 2,312 | 692 | 173 | 1,448 | 30% | 7% | 63% |
| 2002 | 2,329 | 674 | 171 | 1,485 | 29% | 7% | 64% |
| 2003 | 2,347 | 655 | 179 | 1,513 | 28% | 8% | 64% |
| 2004 | 2,367 | 640 | 203 | 1,523 | 27% | 9% | 64% |
| 2005 | 2,387 | 626 | 215 | 1,546 | 26% | 9% | 65% |
| 2006 | 2,406 | 613 | 224 | 1,569 | 25% | 9% | 65% |
| 2007 | 2,428 | 607 | 247 | 1,574 | 25% | 10% | 65% |
| 2008 | 2,451 | 599 | 248 | 1,604 | 24% | 10% | 65% |
| 2009 | 2,469 | 594 | 272 | 1,603 | 24% | 11% | 65% |
| 2010 | 2,482 | 596 | 288 | 1,599 | 24% | 12% | 64% |
| 2011 | 2,495 | 595 | 304 | 1,596 | 24% | 12% | 64% |
| 2012 | 2,508 | 597 | 347 | 1,564 | 24% | 14% | 62% |
| 2013 | 2,521 | 596 | 368 | 1,557 | 24% | 15% | 62% |
| 2014 | 2,534 | 594 | 375 | 1,565 | 23% | 15% | 62% |
| 2015 | 2,549 | 595 | 382 | 1,572 | 23% | 15% | 62% |
| change from 2014 to 2015 | 1% | 0% | 2% | 0% | |||
| change from 2001 to 2015 | 10% | -14% | 121% | 9% |
Source: Scottish Government Housing Statistics for Scotland
Note: Private Rented includes accommodation tied to employment and others living rent free. Vacant private dwellings have been apportioned to the owner occupied category
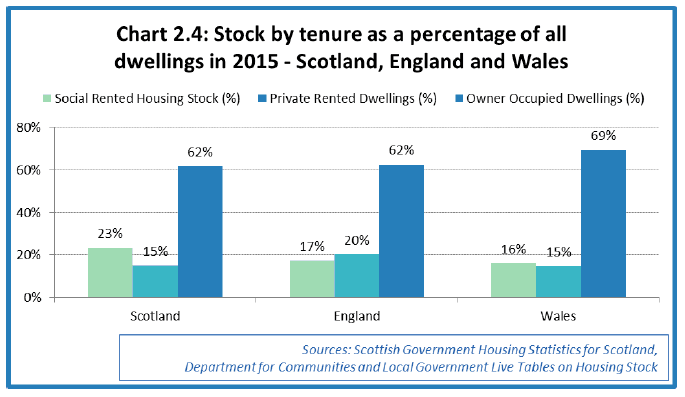
Chart 2.4 below shows stock by tenure as a percentage of all dwellings in 2015 for Scotland, England and Wales. It can be seen that Scotland had the highest proportion of social renting stock (23%) compared to both England (17%) and Wales (16%). England had the highest proportion of private rented dwellings (20%), compared to Scotland and Wales (both 15%), whilst Wales had the highest proportion of owner occupier dwellings (69%) compared to both Scotland (62%) and England (62%).
Chart 2.4: Stock by tenure as a percentage of all dwellings in 2015 - Scotland, England and Wales
Charts 2.5 and 2.6 and Tables 2.6 and 2.7 below provide further detail on changes to stock by tenure for England and Wales. From these, along with the equivalent figures for Scotland, it can be seen that there have been similar increases in the total number of dwellings over the 2001 to 2015 time period in Scotland, England and Wales (10%, 11%, and 10%, respectively).
Social rented stock fell by 14% in Scotland between 2001 and 2015, a higher proportion than the equivalent figures for England (a 6% drop) and Wales (an 8% drop).
Each country has seen a similar increase in the number of private rented dwellings between 2001 and 2015, with increases being 121% in Scotland, 123% in England and 131% in Wales.
The number of owner occupier dwellings in Scotland in 2015 was 9% higher when compared to the numbers in 2001. Wales saw a 4% increase between these two years whilst England saw little change.
Chart 2.5: Stock by tenure (thousands of units), England, 2001 to 2015
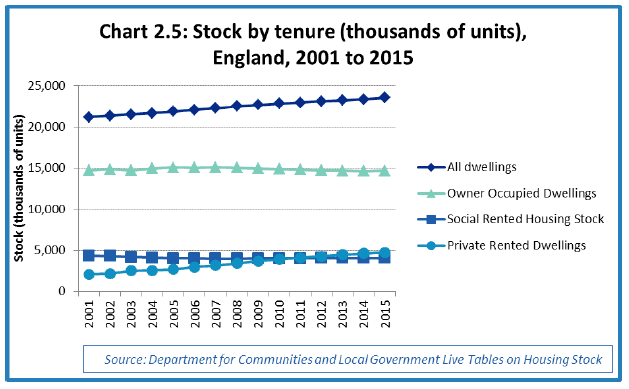
Table 2.6: Stock by tenure, England 2001 to 2015 (thousands of units)
| All dwellings | Social Rented Housing Stock | Private Rented Dwellings | Owner Occupied Dwellings | Social Rented Housing Stock (%) | Private Rented Dwellings (%) | Owner Occupied Dwellings (%) | |
|---|---|---|---|---|---|---|---|
| 2001 | 21,207 | 4,339 | 2,133 | 14,735 | 20% | 10% | 69% |
| 2002 | 21,354 | 4,310 | 2,197 | 14,846 | 20% | 10% | 70% |
| 2003 | 21,513 | 4,212 | 2,549 | 14,752 | 20% | 12% | 69% |
| 2004 | 21,684 | 4,120 | 2,578 | 14,986 | 19% | 12% | 69% |
| 2005 | 21,870 | 4,050 | 2,720 | 15,100 | 19% | 12% | 69% |
| 2006 | 22,073 | 4,034 | 2,987 | 15,052 | 18% | 14% | 68% |
| 2007 | 22,288 | 4,013 | 3,182 | 15,093 | 18% | 14% | 68% |
| 2008 | 22,511 | 4,000 | 3,443 | 15,067 | 18% | 15% | 67% |
| 2009 | 22,694 | 4,022 | 3,705 | 14,968 | 18% | 16% | 66% |
| 2010 | 22,839 | 4,032 | 3,912 | 14,895 | 18% | 17% | 65% |
| 2011 | 22,976 | 4,044 | 4,105 | 14,827 | 18% | 18% | 65% |
| 2012 | 23,111 | 4,072 | 4,286 | 14,754 | 18% | 19% | 64% |
| 2013 | 23,236 | 4,086 | 4,465 | 14,685 | 18% | 19% | 63% |
| 2014 | 23,372 | 4,076 | 4,623 | 14,674 | 17% | 20% | 63% |
| 2015 | 23,543 | 4,085 | 4,747 | 14,710 | 17% | 20% | 62% |
| change from 2014 to 2015 | 1% | 0% | 3% | 0% | |||
| change from 2001 to 2015 | 11% | -6% | 123% | 0% |
Source: Department for Communities and Local Government Live Tables on Housing Stock
Chart 2.6: Stock by tenure (thousands of units), Wales, 2001 to 2015
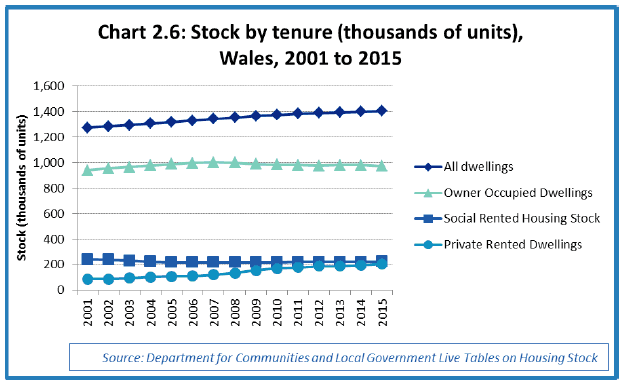
Table 2.7: Stock by tenure, Wales 2001 to 2015 (thousands of units)
| All dwellings | Social Rented Housing Stock | Private Rented Dwellings | Owner Occupied Dwellings | Social Rented Housing Stock (%) | Private Rented Dwellings (%) | Owner Occupied Dwellings (%) | |
|---|---|---|---|---|---|---|---|
| 2001 | 1,275 | 243 | 90 | 941 | 19% | 7% | 74% |
| 2002 | 1,285 | 240 | 89 | 957 | 19% | 7% | 74% |
| 2003 | 1,296 | 233 | 97 | 966 | 18% | 7% | 75% |
| 2004 | 1,307 | 224 | 104 | 979 | 17% | 8% | 75% |
| 2005 | 1,319 | 221 | 109 | 989 | 17% | 8% | 75% |
| 2006 | 1,331 | 220 | 113 | 997 | 17% | 8% | 75% |
| 2007 | 1,343 | 220 | 122 | 1,002 | 16% | 9% | 75% |
| 2008 | 1,355 | 219 | 135 | 1,001 | 16% | 10% | 74% |
| 2009 | 1,366 | 220 | 157 | 989 | 16% | 11% | 72% |
| 2010 | 1,375 | 221 | 170 | 984 | 16% | 12% | 72% |
| 2011 | 1,384 | 223 | 180 | 981 | 16% | 13% | 71% |
| 2012 | 1,389 | 223 | 189 | 977 | 16% | 14% | 70% |
| 2013 | 1,394 | 223 | 188 | 983 | 16% | 13% | 71% |
| 2014 | 1,400 | 223 | 196 | 981 | 16% | 14% | 70% |
| 2015 | 1,406 | 224 | 208 | 974 | 16% | 15% | 69% |
| change from 2014 to 2015 | 0% | 0% | 6% | -1% | |||
| change from 2001 to 2015 | 10% | -8% | 131% | 4% |
Source: Department for Communities and Local Government Live Tables on Housing Stock
2.4 Types of dwellings (houses/flats)
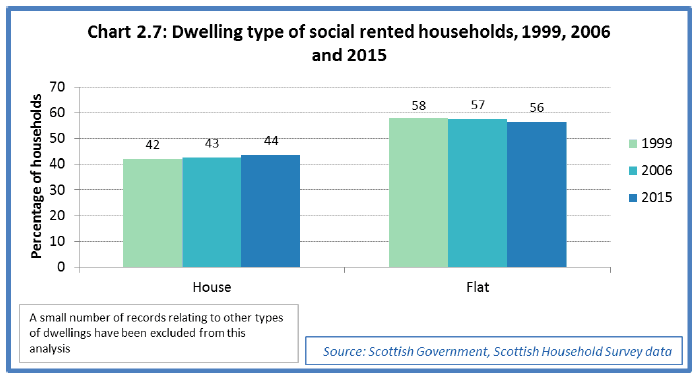
Based on households interviewed as part of the Scottish Household Survey, 44% of social rented households in Scotland in 2015 were living in a house, a similar level to the 42% figure in 1999. Correspondingly, 56% of households were living in a flat in 2015, a similar level to 58% in 1999.
Chart 2.7: Dwelling type of social rented households, 1999, 2006 and 2015
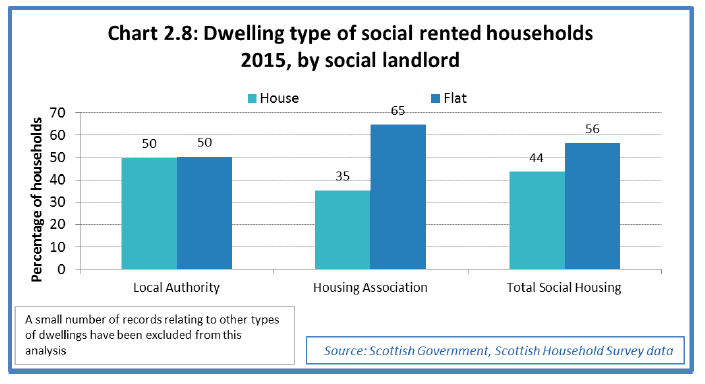
There were however some differences in dwelling types between social landlord providers in 2015, with 50% of local authority households living in houses and 50% living in flats, whilst only 35% of housing association households were living in a house and 65% living in a flat.
Chart 2.8: Dwelling type of social rented households 2015, by social landlord
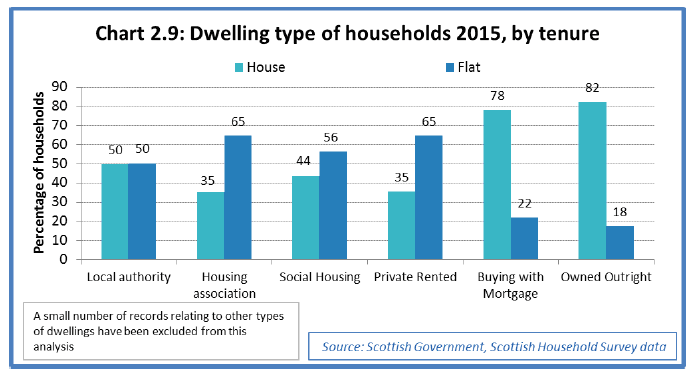
In 2015, 35% of private rented households were living in houses, the same proportion as housing association households. Owner occupied households were much more likely to be living in houses, with 78% of households buying with a mortgage living in a house and 82% of households who own outright living in a house.
Chart 2.9: Dwelling type of households 2015, by tenure
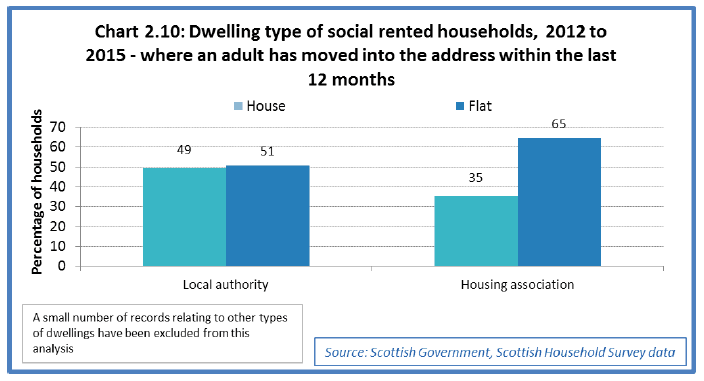
When looking solely at social rented households in which an adult had moved into the property within the last 12 months (which includes new-lets as well as changes to existing household compositions), 49% of local authority and 35% of housing association households were living in a house in 2012 to 2015, figures which are similar to those for all social households in 2015. This would suggest that newly formed social rented households are living in dwelling types (houses/flats) that are similar to more established social households.
Chart 2.10: Dwelling type of social rented households, 2012 to 2015 - where an adult has moved into the address within the last 12 months
2.5 Number of bedrooms
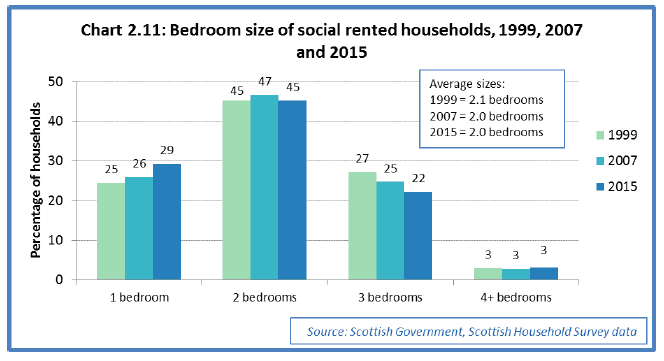
Based on responses from households interviewed for the Scottish Household Survey, Dwellings occupied by social rented households in 2015 contained an average of 2.0 bedrooms, a decrease on the average of 2.1 bedrooms per dwelling in 1999.
The most common size of social rented dwelling in 2015 was 2 bedrooms, with 45% of dwellings being this size, a similar level to 1999 (45%).
In 2015, 29% of social rented dwellings contained 1 bedroom, an increase from 25% in 1999, whilst 22% of dwellings contained 3 bedrooms, a drop from 27% in 1999.
Chart 2.11: Bedroom size of social rented households, 1999, 2007 and 2015
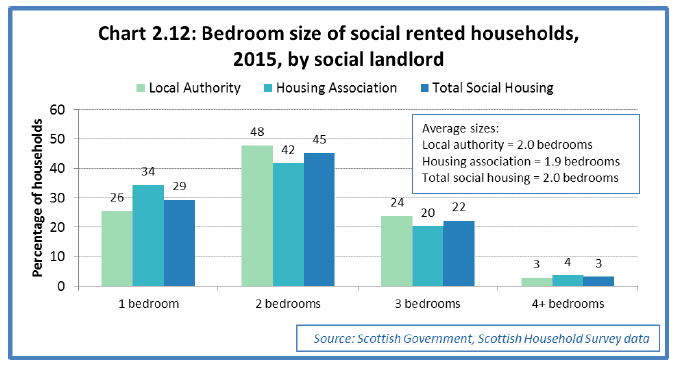
There were similar values for average numbers of bedrooms between social landlord providers in 2015, with local authority dwellings on average containing 2.0 bedrooms compared with 1.9 for housing association dwellings.
Chart 2.12: Bedroom size of social rented households, 2015, by social landlord
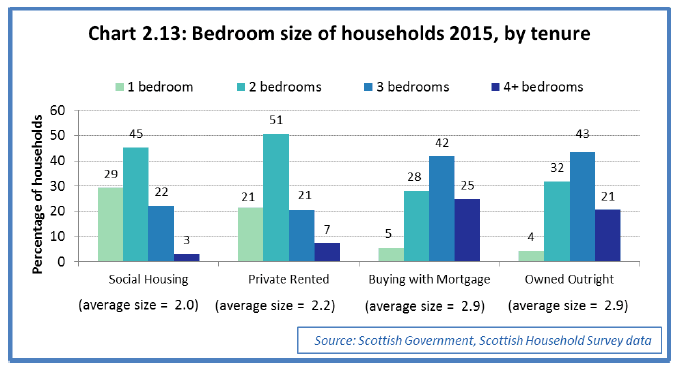
There were some differences in bedroom sizes of dwellings in 2015 by tenure, with social rented dwellings having the smallest average size of 2.0 bedrooms. This compared to an average size of 2.2 bedrooms in private rented dwellings, 2.9 bedrooms in dwellings being bought with a mortgage and 2.9 bedrooms in dwellings owned outright.
Dwellings being bought with a mortgage and owned outright were much more likely to have 4 or more bedrooms (25% and 21% respectively).
Chart 2.13: Bedroom size of households 2015, by tenure
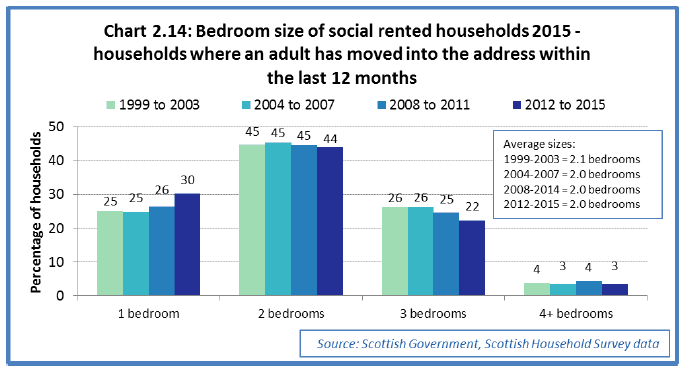
When looking solely at social rented households in which an adult had moved into the property within the last 12 months (which includes new-lets as well as changes to existing household compositions), bedroom sizes of these dwellings have been similar when compared to the figures for all social rented dwellings. Dwellings occupied by households where an adult had moved into the address within the last 12 months in 2012 to 2015 had on average 2.0 bedrooms. This is the same as the figure of 2.0 bedrooms of all social rented dwellings in 2015. This would suggest that newly formed social rented households are on average living in dwellings with a similar number of bedrooms to more established social households.
Chart 2.14: Bedroom size of social rented households 2015 - households where an adult has moved into the address within the last 12 months
2.6 Location of households in Areas of Multiple Deprivation
The Scottish Index of Multiple Deprivation ( SIMD [6] ) is a Scottish Government statistical tool for identifying places in Scotland suffering from deprivation. It incorporates several different aspects of deprivation, combining them into a single index. It divides Scotland into small areas and provides a relative ranking for each area from most deprived to least deprived.
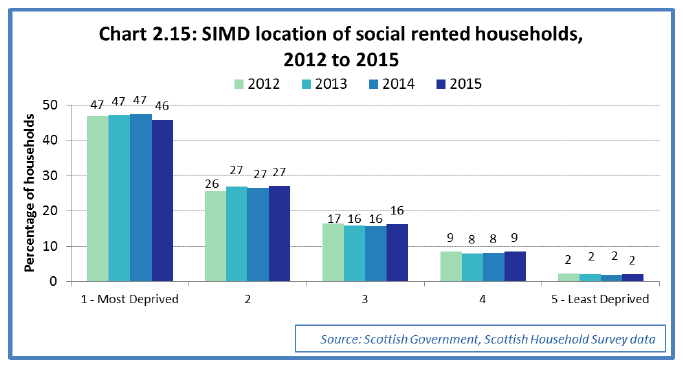
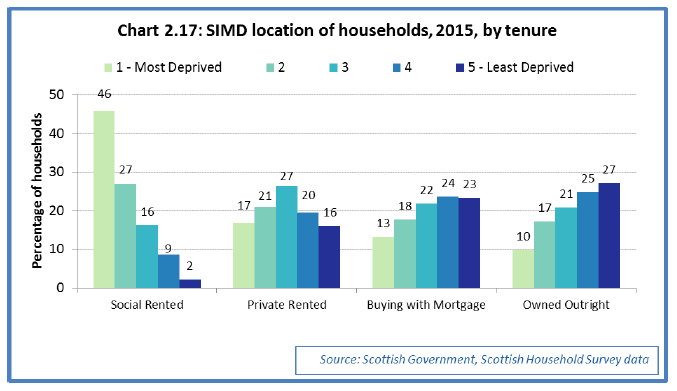
Based on responses from households interviewed for the Scottish Household Survey, 46% of social rented households in 2015 were living in dwellings in the 20% most deprived areas of Scotland (as defined by the SIMD 2012 measure), a similar proportion to the years 2012 to 2014. Only 2% were living in the 20% least deprived areas of the country.
Chart 2.15: SIMD location of social rented households, 2012 to 2015
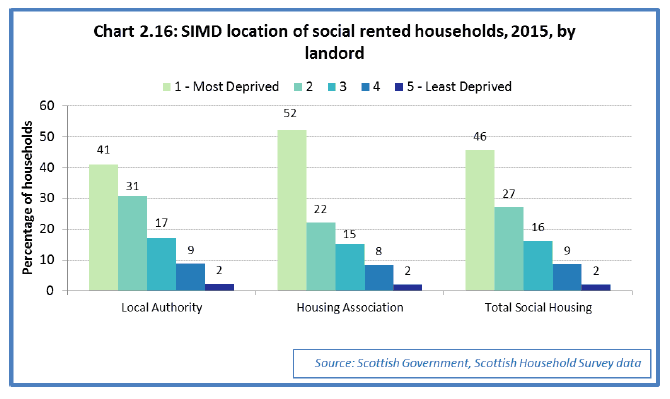
There were some differences in deprivation locations between social landlord providers in 2015, with 52% of housing association households living in dwellings in the 20% most deprived areas, compared to 41% of local authority households.
Chart 2.16: SIMD location of social rented households, 2015, by landord
There were also differences in deprivation locations between social households and other tenures. In 2015, 46% of social rented households were living in the 20% most deprived areas, compared to 17% of private rented households, 13% of households buying with a mortgage and 10% of households owning outright. Only 2% of social rented households were living in the 20% least deprived areas, which compared to 16% for private rented households, 23% for households buying with a mortgage and 27% of households owning outright.
Chart 2.17: SIMD location of households, 2015, by tenure
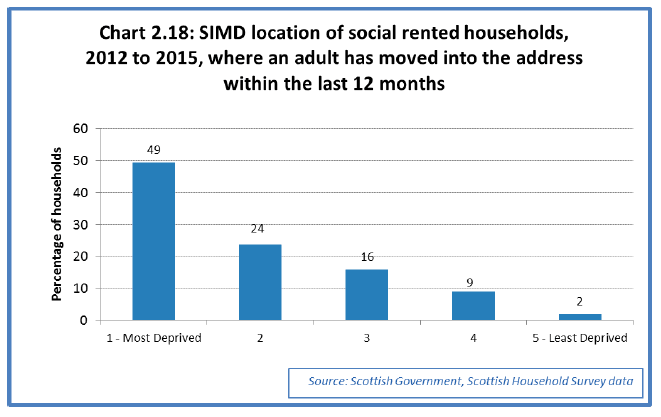
When looking solely at social rented households in which an adult had moved into the property within the last 12 months from 2012 to 2015 (which includes new-lets as well as changes to existing household compositions), 49% of social rented households were living in dwellings in the 20% most deprived areas, a value similar to the equivalent figure for all social households across this time period (46% in 2015). This suggests that newly formed social rented households had a similar likelihood of living in dwellings located in the 20% most deprived areas of the country compared with more established social households.
Chart 2.18: SIMD location of social rented households, 2012 to 2015, where an adult has moved into the address within the last 12 months
2.7 Location of households in rural or urban areas
The Scottish Government Urban Rural Classification 2013/14 [7] provides a standard definition of urban and rural areas in Scotland.
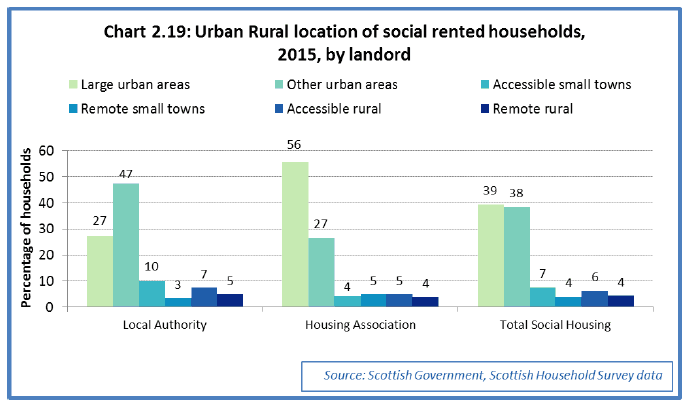
Based on responses from households interviewed for the Scottish Household Survey in 2015, 27% of local authority households were living in dwellings in large urban areas, compared to 56% of housing association households. Also, 47% of local authority households were living in other ( i.e. non-large) urban areas, compared with 27% of housing association households. These differences may be partly explained by stock transfers that have happened, for example all social rented housing in Glasgow is now provided by housing associations, properties which are mostly likely to fall within the large urban area category.
Chart 2.19: Urban Rural location of social rented households, 2015, by landord
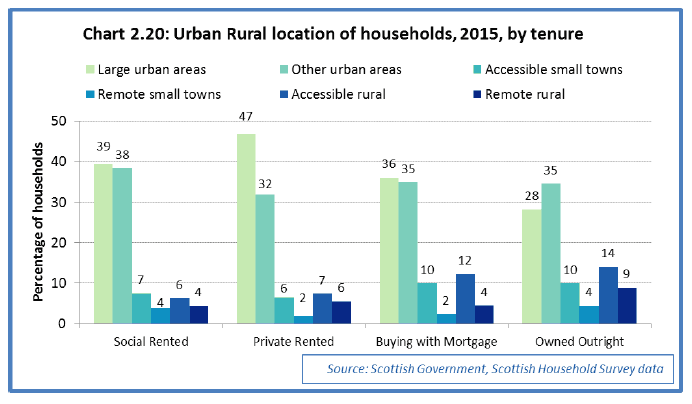
The urban rural location of households in 2015 also varied across other tenures, with households buying with a mortgage or owning outright being more likely to live in accessible small towns or accessible rural areas compared to social households.
Chart 2.20: Urban Rural location of households, 2015, by tenure
2.8 Scottish Housing Quality Standard
The Scottish House Condition Survey ( SHCS) module of the Scottish Household Survey assesses properties under the Scottish Housing Quality Standard ( SHQS), a common standard for assessing the condition of Scottish housing.
The SHQS target for social housing was incorporated into the Scottish Social Housing Charter and the independent Scottish Housing Regulator ( SHR) is responsible for monitoring landlords' performance. Latest figures published by the SHR indicate that 92.8% of social homes met the SHQS in 2015/16. This is higher than the compliance rate estimated through the SHCS. Although both sources have shown substantial improvements in quality standards over time, there are some differences in the methods and the timing for collecting the data that account for the difference in headline rates.
In 2015, SHCS results showed that 38% of social rented dwellings failed the SHQS, a decrease from 52% of dwellings in 2012. Local authority properties were more likely to fail the standard (45%) than housing association properties (30%).
In 2015, social rented dwellings were on average less likely to fail the SHQS (38%) when compared with private housing dwellings (46%), although this difference was only marginally statistically significant.
Table 2.8: Number and proportion of dwellings failing the Scottish Housing Quality Standard ( SHQS), 2012 to 2015
| 2012 | 2013 | 2014 | 2015 | |||||
|---|---|---|---|---|---|---|---|---|
| % fail | Sample Base | % fail | Sample Base | % fail | Sample Base | % fail | Sample Base | |
| All Scotland | 54% | 2,787 | 49% | 2,725 | 47% | 2,680 | 44% | 2,750 |
| Tenure: | ||||||||
| Owned outright | 57% | 900 | 53% | 880 | 48% | 900 | 46% | 930 |
| Owned with a mortgage | 50% | 850 | 47% | 850 | 47% | 790 | 42% | 810 |
| Local Authority | 59% | 420 | 51% | 390 | 47% | 390 | 45% | 380 |
| Housing Association | 42% | 280 | 33% | 280 | 41% | 290 | 30% | 280 |
| Private Rented | 63% | 290 | 55% | 300 | 54% | 320 | 51% | 360 |
| All Private | 55% | 2,050 | 51% | 2,020 | 48% | 2,010 | 46% | 2,100 |
| All Social | 52% | 700 | 43% | 660 | 45% | 670 | 38% | 660 |
Source: Scottish House Condition Survey Key Findings
Note that figures in 2014 and 2015 are not fully comparable with previous years
The most likely reason for social rented properties to fail the SHQS in 2015 was due to not being sufficiently energy efficient (26%). Whilst 10% were assessed as failing due to not being healthy, safe or secure, 8% failed due to lacking modern facilities or services, and 1% failed due to being below tolerable standards.
Table 2.9: Scottish Housing Quality Standard ( SHQS) criteria failure rates by tenure, 2012 to 2015
| 2012 | 2013 | 2014 | 2015 | |
|---|---|---|---|---|
| All tenures: | ||||
| SHQS Overall | 54% | 49% | 47% | 44% |
| Below Tolerable Standard | 4% | 3% | 2% | 2% |
| Serious Disrepair | 0% | 0% | 0% | 0% |
| Not Energy Efficient | 42% | 36% | 35% | 32% |
| Lacking Modern Facilities/Services | 12% | 11% | 11% | 9% |
| Not Healthy, Safe or Secure | 16% | 14% | 14% | 13% |
| Social: | ||||
| SHQS Overall | 52% | 43% | 45% | 38% |
| Below Tolerable Standard | 3% | 3% | 1% | 1% |
| Serious Disrepair | 0% | 0% | 0% | 0% |
| Not Energy Efficient | 39% | 28% | 30% | 26% |
| Lacking Modern Facilities/Services | 15% | 12% | 12% | 8% |
| Not Healthy, Safe or Secure | 13% | 13% | 14% | 10% |
| Private: | ||||
| SHQS Overall | 55% | 51% | 48% | 46% |
| Below Tolerable Standard | 4% | 3% | 2% | 2% |
| Serious Disrepair | 0% | 0% | 0% | 0% |
| Not Energy Efficient | 43% | 39% | 37% | 33% |
| Lacking Modern Facilities/Services | 11% | 11% | 11% | 9% |
| Not Healthy, Safe or Secure | 17% | 14% | 14% | 14% |
Source: Scottish House Condition Survey Key Findings
Note that figures in 2014 and 2015 are not fully comparable with previous years
Contact
Email: Esther Laird
There is a problem
Thanks for your feedback