Social Tenants in Scotland 2015
This is a new statistical publication that presents an overview of social tenants and social rented housing in Scotland for the year 2015.
Section 5 – Housing Costs and Income
5.1 Rent levels in social housing
Data from the Scottish Housing Regulator, as published in their National Report on the Scottish Social Housing Charter Headline Findings 2015/16 [13] , shows that the average rent for a social sector property in Scotland in 2015/16 was £72.99, with housing association properties averaging £81.14 per week, 20% higher than the average rent of £67.57 for a local authority property.
Average housing association rents were higher than local authority rents for each property size category in 2015/16, with average housing association rents ranging from £63.76 per week for a 1 apartment property to £94.94 per week for a 5 apartment property. Local authority average weekly rents ranged from £56.85 for a 1 apartment property to £79.92 for a 5 apartment property.
Note that apartment size categories are based on a count of the number of bedrooms and living/dining rooms. Kitchens, bathrooms, toilets and utility rooms are not included.
Chart 5.1: Average weekly rents, 2015/16, by social landlord type and property size
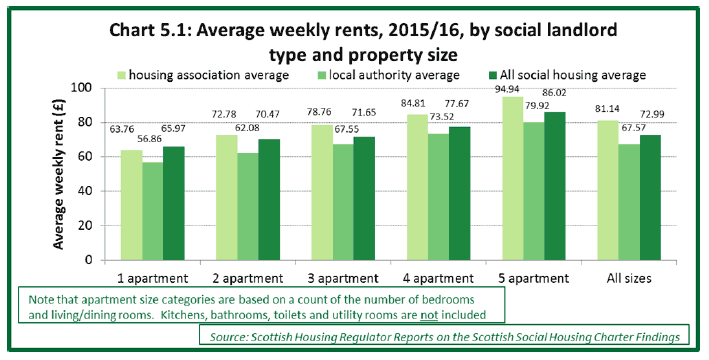
The average rent of £72.99 for a social sector property in Scotland in 2015/16 was an increase of 2.8% on the previous year.
Over the three financial years from 2013/14 to 2015/16, average weekly social sector rents have increased by 4.5% from £67.96 in 2013/14 to £71.00 in 2014/15, following which there has been a 2.8% increase to £72.99 in 2015/16.
This is a cumulative increase of 7.4% between 2013/14 and 2015/16, which equates to a real terms increase of 5.3% ( i.e. an increase of 5.3% over and above the level of CPI inflation over these years).
Average social sector rents have increased over each of the last two financial years for each property size category.
Chart 5.2: Average weekly rents, 2013/14 to 2015/16, for social rented housing
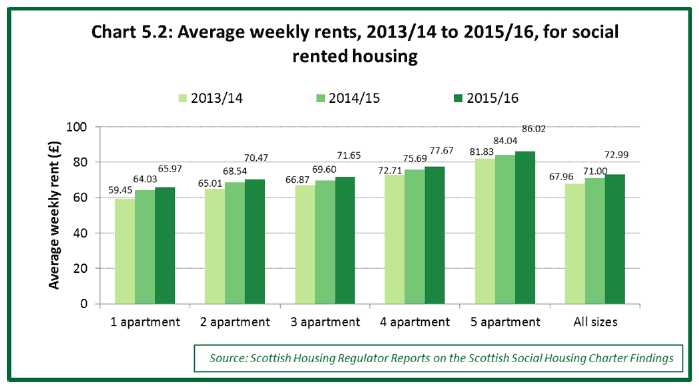
Table 5.1: Average weekly rents 2013/14 to 2015/16, by social landlord type and property size
| 2013/14 | 2014/15 | 2015/16 | |||||||
|---|---|---|---|---|---|---|---|---|---|
| housing association average | local authority average | All social housing average | housing association average | local authority average | All social housing average | housing association average | local authority average | All social housing average | |
| 1 apartment | Split not available | £59.45 | £67.32 | £57.82 | £64.03 | £63.76 | £56.86 | £65.97 | |
| 2 apartment | £65.01 | £74.72 | £61.81 | £68.54 | £72.78 | £62.08 | £70.47 | ||
| 3 apartment | £66.87 | £74.98 | £65.33 | £69.60 | £78.76 | £67.55 | £71.65 | ||
| 4 apartment | £72.71 | £82.98 | £70.08 | £75.69 | £84.81 | £73.52 | £77.67 | ||
| 5 apartment | £81.83 | £92.13 | £75.57 | £84.04 | £94.94 | £79.92 | £86.02 | ||
| All sizes | £67.96 | £76.92 | £65.78 | £71.00 | £81.14 | £67.57 | £72.99 | ||
Source: Scottish Housing Regulator Reports on the Scottish Social Housing Charter Findings
Note that apartment size categories are based on a count of the number of bedrooms and living/dining rooms. Kitchens, bathrooms, toilets and utility rooms are not included
Table 5.2 below shows average weekly social rents 2014/15 and 2015/16, by social rent provider and country. Average social rents in England were £95.89 per week for Private Registered Providers of social housing stock as at 31 March 2015, and £87.93 per week for local authority stock in 2015/16. Average social rents in Scotland in 2015/16 were therefore around 15% lower for housing association stock and 23% lower for local authority stock when compared with figures for England.
Table 5.2: Average weekly social rents, 2014/15 and 2015/16, by social rent provider and country
| 2014/15 | 2015/16 | |
|---|---|---|
| Housing Association Properties | ||
| Scotland | £76.92 | £81.14 |
| England (Private Registered Providers of social housing stock) | £92.30 | £95.89 |
| Wales | £79.16 | £82.05 |
| Northern Ireland (rent gross of service charges) | £97.99 | n/a |
| Local Authority Properties | ||
| Scotland | £65.78 | £67.57 |
| England | £85.89 | £87.93 |
| Wales | £75.19 | £78.44 |
| Northern Ireland (Northern Ireland Housing Executive) | £63.46 | £66.60 |
Sources:
Scottish Housing Regulator Reports on the Scottish Social Housing Charter Findings
DCLG live tables on rents, lettings and tenancies (Table 702 and 704)
StatWales tables on social housing stock and rents
Northern Ireland Housing Statistics 2015/16
Note there may be some differences in the detail of how each set of average rent figures are calculated, therefore comparisons between countries should be seen as indicative rather than highlighting exact differences.
England figures for housing association properties are recorded as at 31st March 2014 for 2014/15 and 31st March 2015 for 2015/16.
Average social rents in Wales were £82.05 per week for housing associations in 2015/16 and £78.44 per week for local authority stock in 2015/16. Average social rents in Scotland in 2015/16 were therefore around 1% lower for housing association stock and 14% lower for local authority stock when compared with the equivalent figures for Wales.
Average social rents in Northern Ireland were £97.99 per week for housing associations in 2014/15 (latest figure available), whilst local authority Northern Ireland Housing Executive rents averaged £66.60 per week in 2015/16. Average local authority rents in Scotland were therefore around 1% higher when compared with the equivalent figures for Northern Ireland. A comparison can't be made in the latest year for housing association rents, but when looking at data for 2014/15 it can be seen that average housing association rents in Scotland were around 22% lower than the equivalent figures for Northern Ireland.
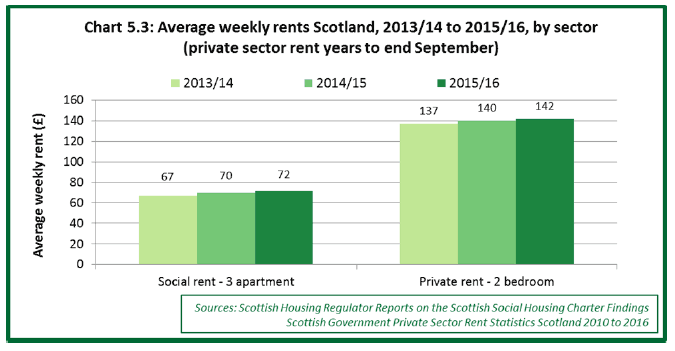
Chart 5.3 below shows a comparison between average social rents in Scotland for a 3 apartment property ( i.e. 2 bedrooms plus 1 living room) and average private rents in Scotland for a 2 bedroom property. It can be seen that social rents in Scotland for this size of property have been around half the level of private sector rents for each of the last three years 2013/14 to 2015/16.
Chart 5.3: Average weekly rents Scotland, 2013/14 to 2015/16, by sector (private sector rent years to end September)
5.2 Household income – banded net income
The Scottish Household Survey collects information on the banded net income of households. In 2015, 32% of social rented households had a net household income of between £10k and £15k, whilst 22% had income of between £15k and £20k and 26% had income of more than £20k.
Chart 5.4: Net income of social rented households, 1999, 2007 and 2015
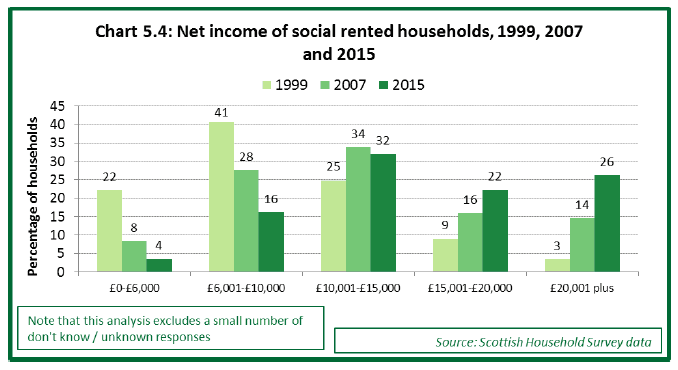
The distribution of income levels appears to have shifted upwards from 1999 to 2015. For example, in 1999 22% of social rented households had a net income of £6k or less, and this has dropped to 4% of households in 2015. Correspondingly only 3% of social rented households had a net income of more than £20k in 1999, and this has increased to 26% of households in 2015. Some of these changes may be due to general inflation levels across the time period 1999 to 2015.
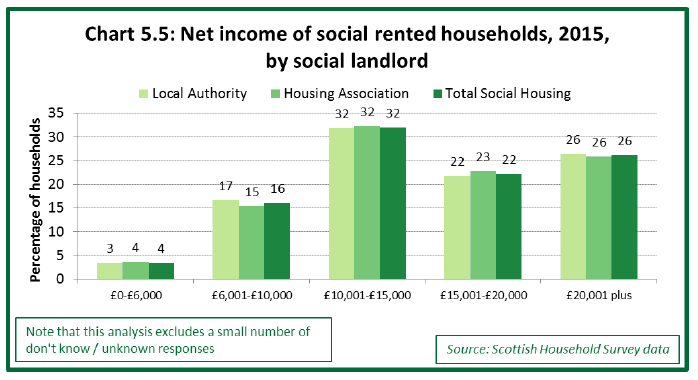
There was little difference in net household income between local authority and housing association households in 2015, as shown in Chart 5.5 below.
Chart 5.5: Net income of social rented households, 2015, by social landlord
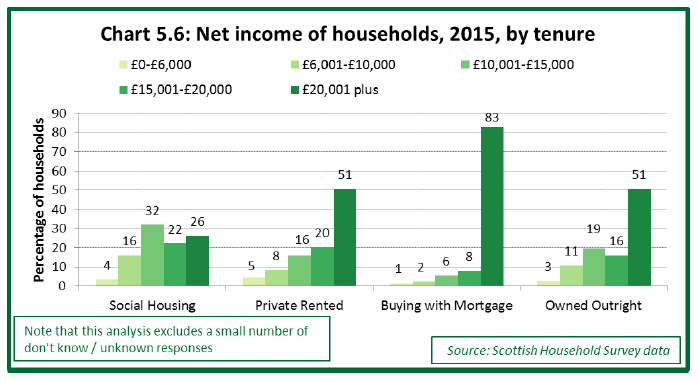
There were differences in net income levels in 2015 between different tenures. In 2015, 74% of social rented households had a net income of £20k or less, which compares to 49% of private rented households, 49% of households owned outright and 17% of households buying with a mortgage.
Chart 5.6: Net income of households, 2015, by tenure
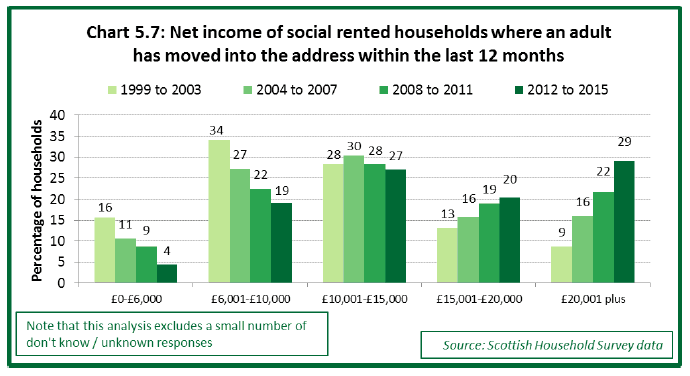
When looking at social rented households in Scotland in which an adult had moved into the address within the last 12 months (which includes new-lets as well as changes to existing household compositions), 29% had a net income of over £20k, a figure similar to the equivalent percentage of 26% for all social households in 2015; 27% had a net income between £10k and £15k, a figure similar than the equivalent percentage of 32% for all social households in 2015.
Chart 5.7: Net income of social rented households where an adult has moved into the address within the last 12 months
5.3 Households in the lowest income quintile
Income quintiles divide households into 5 equally sized groups to reflect their net household income. For the purposes of this analysis, household responses to the Family Resources Survey have been ranked by their net unequivalised income, from lowest to highest [14] . The ranked dataset has then been divided into 5 equally sized groups, where households with the lowest incomes are in the first quintile, right through to the households with the highest income, which are in the fifth quintile. In this section, the lowest income quintile refers to the 1 in 5 (20%) of households in each of Scotland, England, or Wales, that have the lowest net household income in each of these countries.
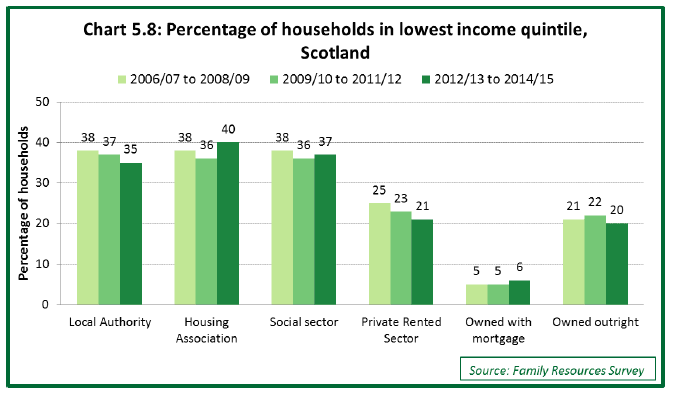
Chart 5.8 below shows that a greater percentage of social rented households are in the lowest income quintile. In 2012/13 to 2014/15, 37% of social rented households were in the lowest income quintile group in Scotland, including 35% of local authority and 40% of housing association households. These figures compare to 21% of private rented households, 20% of households who own outright and 6% of households who own with a mortgage.
The category of households owned outright is likely to include some retired people who have already bought their houses and who are now on relatively low incomes, who could be described as "asset rich and cash poor".
Patterns of change over time are not particularly clear. Whilst the survey data presented suggests decreases in the proportion of local authority and private rented households that are in the lowest income quintile, due to sampling variation there is insufficient evidence to say whether or not these decreases are genuine.
Chart 5.8: Percentage of households in lowest income quintile, Scotland
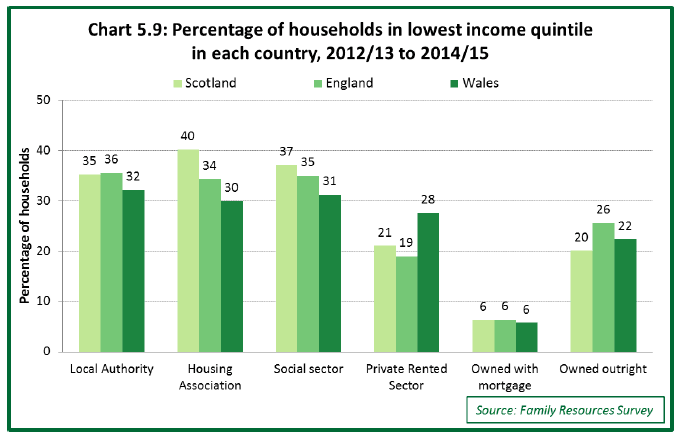
The chart below provides a comparison of Scotland with other countries in the UK for the period 2012/13 to 2014/15. There was little difference between countries. For local authority housing, Scotland (35%) and England (36%) and Wales (32%) showed similar proportions of households in the lowest income quintile. In the housing association sector, the percentages ranged from 30% in Wales to 34% in England and 40% in Scotland. In the private rented sector, 21% of households in Scotland were in the lowest income quintile, 19% in England and 28% in Wales. However due to sampling variation there is insufficient evidence to say whether any of these country comparisons reflect genuine differences.
Chart 5.9: Percentage of households in lowest income quintile in each country, 2012/13 to 2014/15
5.4 Housing costs as a proportion of income
Chart 5.10 and Table 5.3 below show the median ratio of housing costs as a proportion of net household income from 2006/07 to 2014/15 for each tenure category. This analysis is based on the 'ratio of housing costs to income' which is also used as an indicator in the Scottish Government Housing and Regeneration Outcome Indicators Framework [15] , with additional analysis to split out social rented into the constituent categories of local authority and housing association households. In this analysis housing benefit payments are included in the net household income. Net income is the total income received by the households excluding taxes such as income tax and council tax. Net income has not been adjusted ("equivalised") for family size. Housing costs include rent gross of housing benefit, as well as water rates and service charges where applicable.
For the analysis presented in this report, 3 year grouped samples have been used to improve statistical reliability. Across the 3-year period from 2012/13 to 2014/15, local authority households in Scotland spent on average 22% of their net household income on housing costs, a figure similar to the equivalent percentage of 25% for housing association households. The social sector combined ratio over 2012/13 to 2014/15 was 24%. These figures compare to equivalent figures of 25% for private rented households, 9% for households owned with a mortgage and 3% for households owned outright. The similar ratio figures between social households and private rented households is likely to reflect those in the private rented sector having higher average rental costs but also having higher average income levels to those in social housing.
Table 5.3: Median ratio housing costs to net unequivalised by tenure, Scotland only
| 2006/07 to 2008/09 | 2009/10 to 2011/12 | 2012/13 to 2014/15 | ||||
|---|---|---|---|---|---|---|
| Ratio | Base | Ratio | Base | Ratio | Base | |
| Local Authority | 22% | 1,990 | 22% | 1,610 | 22% | 1,320 |
| Housing Associations | 25% | 1,310 | 24% | 1,130 | 25% | 830 |
| Social sector | 23% | 3,300 | 23% | 2,740 | 24% | 2,150 |
| Private rented | 25% | 1,090 | 28% | 1,330 | 25% | 1,210 |
| Owned with mortgage | 13% | 4,370 | 10% | 3,560 | 9% | 2,540 |
| Owned outright | 3% | 3,710 | 3% | 3,750 | 3% | 2,960 |
Source: Family Resources Survey
Housing costs as a proportion of income for those owning with a mortgage or who own outright are lower than each of the rented sectors, which may reflect either higher average household incomes or lower housing costs. In particular, households who own their properties outright have no rental or mortgage costs.
In Scotland, average ratios of housing costs to net household income have remained relatively stable over time within each tenure category. Patterns of change over time are unclear and due to sampling variability there is insufficient evidence to say whether or not changes over time reflects genuine change or sampling error.
Chart 5.10: Median ratio of Housing costs to net unequivalised household income, by tenure and year, Scotland
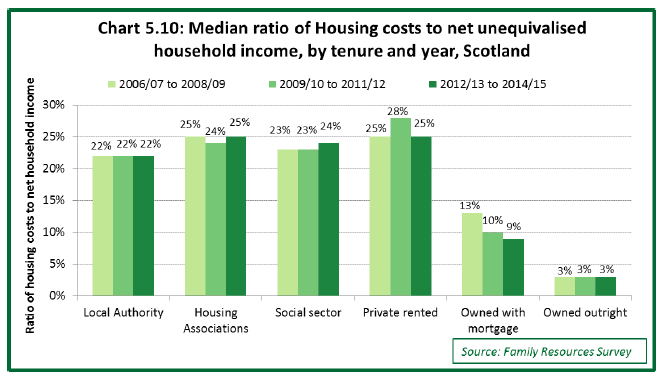
Chart 5.11 below illustrates how the average ratios of housing costs to income have differed for each GB country over the 3-year period from 2012/13 to 2014/15. Social rented households in Scotland were on average paying less on housing costs as a proportion of income (24%) than households in England (29%) and a similar ratio to Wales (27%).
Chart 5.11: Median ratio of housing costs to net unequivalised household income, by country, 2012/13 to 2014/15
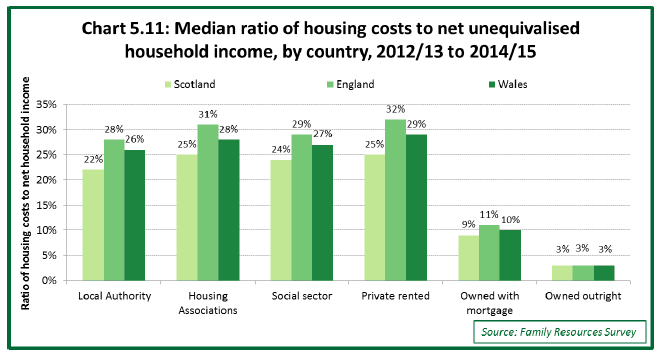
Table 5.4: Median ratio housing costs to net unequivalised, 2012/13 to 2014/15, by tenure and country
| Scotland | England | Wales | ||||
|---|---|---|---|---|---|---|
| Ratio | Base | Ratio | Base | Ratio | Base | |
| Local Authority | 22% | 1,320 | 28% | 3,700 | 26% | 260 |
| Housing Associations | 25% | 830 | 31% | 4,090 | 28% | 180 |
| Social sector | 24% | 2,150 | 29% | 7,790 | 27% | 440 |
| Private rented | 25% | 1,210 | 32% | 6,680 | 29% | 370 |
| Owned with mortgage | 9% | 2,540 | 11% | 12,750 | 10% | 690 |
| Owned outright | 3% | 2,960 | 3% | 14,920 | 3% | 1,040 |
Source: Family Resources Survey
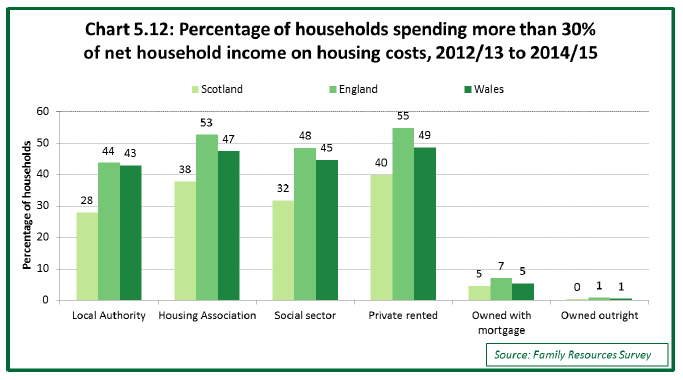
Using these ratios, it is also possible to estimate how many households are spending more than 30% of the income on housing costs, as shown in Chart 5.12 below which covers the 3 year period from 2012/13 to 2014/15. In the social sector, 32% of households in Scotland were spending more than 30% of their net income on housing costs, lower than the 48% seen in England and 45% seen in Wales. Findings for local authority and housing associations are also presented, however caution is required when comparing countries due to smaller sample sizes. In the private rented sector, 40% of households in Scotland were spending more than 30% of their net income on housing costs, compared to 49% in Wales and 55% in England.
Chart 5.12: Percentage of households spending more than 30% of net household income on housing costs, 2012/13 to 2014/15
5.5 Financial support - Housing Benefit and Discretionary Housing Payments
Housing Benefit is available to support eligible low income households with the cost of renting their home. It cannot be used to pay for other costs, such as food or heating, and households that do not pay rent ( e.g. because they are owned with the help of a mortgage) are not eligible. The award can cover the whole cost of rent or part of it, depending on income, circumstances, and other factors such as the type of landlord and local housing allowance rates.
Universal Credit is being introduced in stages across the UK. It will eventually replace housing benefit, income support, income-based employment and support allowance, income-based jobseeker's allowance, child tax credits, and working tax credit. Some Universal Credit claimants will receive the Housing element, which will provide help with rent costs. As at March 2015, Universal Credit had been introduced in the Inverness council area and for selected claimants, but not any other areas of Scotland. Figures on claimants in Scotland receiving the housing element at March 2015 are not available, however at May 2016, there were 5,900 Universal Credit awards with housing elements paid to claimants with a Social Landlord and 2,600 to claimants with a private landlord [16] .
Chart 5.13 below shows the percentage of households receiving housing benefit from 2011 to 2015 for each tenure, for Scotland, England and Wales, based on data from DWP StatXplore and DCLG stock by tenure figures.
In Scotland, the percentage of households receiving Housing Benefit has decreased across all of the rented housing sectors between 2011 and 2015, now standing at 62% of local authority households, 63% of housing association households, and 25% of private rented sector households.
The percentage of households receiving Housing Benefit in Scotland is slightly lower than England or Wales across all three rented tenure categories. For example, in 2015, 62% of local authority households in Scotland received Housing Benefit, compared to 68% in England and 71% in Wales.
Chart 5.13: Housing Benefit claimants as a percentage of dwellings by tenure and country
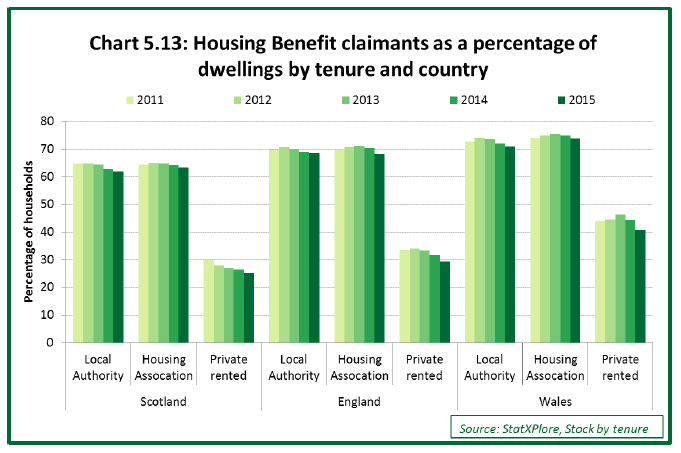
Table 5.5: Number of households and percentage of households in receipt of Housing Benefit by tenure at end March each year, Scotland
| 2011 | 2012 | 2013 | 2014 | 2015 | |
|---|---|---|---|---|---|
| Local Authority | |||||
| Number of households | 320,000 | 319,000 | 318,000 | 318,000 | 317,000 |
| Received HB | 207,123 | 206,940 | 205,016 | 199,597 | 196,183 |
| % receiving HB | 65% | 65% | 64% | 63% | 62% |
| Housing Association | |||||
| Number of households | 275,000 | 277,000 | 277,000 | 277,000 | 278,000 |
| Received HB | 177,286 | 179,886 | 179,743 | 177,854 | 175,939 |
| % receiving HB | 64% | 65% | 65% | 64% | 63% |
| Social Sector | |||||
| Number of households | 595,000 | 596,000 | 595,000 | 595,000 | 595,000 |
| Received HB | 384,409 | 386,826 | 384,759 | 377,451 | 372,122 |
| % receiving HB | 65% | 65% | 65% | 63% | 63% |
| Private rented | |||||
| Number of households | 303,505 | 347,324 | 368,468 | 374,748 | 381,929 |
| Received HB | 90,265 | 96,729 | 99,627 | 98,708 | 96,188 |
| % receiving HB | 30% | 28% | 27% | 26% | 25% |
Sources: DWP StatXplore, Stock by tenure figures from DCLG Live Tables and Housing Statistics for Scotland
Table 5.6: Number of households and percentage of households in receipt of Housing Benefit by tenure at end March each year, England
| 2011 | 2012 | 2013 | 2014 | 2015 | |
|---|---|---|---|---|---|
| Local Authority | |||||
| Number of households | 1,726,000 | 1,693,000 | 1,682,000 | 1,669,000 | 1,643,000 |
| Received HB | 1,203,712 | 1,196,157 | 1,175,644 | 1,150,258 | 1,125,037 |
| % receiving HB | 70% | 71% | 70% | 69% | 68% |
| Housing Association | |||||
| Number of households | 2,255,000 | 2,304,000 | 2,331,000 | 2,343,000 | 2,387,000 |
| Received HB | 1,568,109 | 1,626,129 | 1,656,813 | 1,644,300 | 1,627,275 |
| % receiving HB | 70% | 71% | 71% | 70% | 68% |
| Social Sector | |||||
| Number of households | 3,981,000 | 3,997,000 | 4,013,000 | 4,012,000 | 4,030,000 |
| Received HB | 2,771,821 | 2,822,286 | 2,832,457 | 2,794,558 | 2,752,312 |
| % receiving HB | 70% | 71% | 71% | 70% | 68% |
| Private rented | |||||
| Number of households | 4,105,000 | 4,286,000 | 4,465,000 | 4,623,000 | 4,747,000 |
| Received HB | 1,376,310 | 1,455,043 | 1,485,417 | 1,466,121 | 1,395,098 |
| % receiving HB | 34% | 34% | 33% | 32% | 29% |
Sources: DWP StatXplore, Stock by tenure figures from DCLG Live Tables.
Table 5.7: Number of households and percentage of households in receipt of Housing Benefit by tenure at end March each year, Wales
| 2011 | 2012 | 2013 | 2014 | 2015 | |
|---|---|---|---|---|---|
| Local Authority | |||||
| Number of households | 89,000 | 88,000 | 88,000 | 88,000 | 88,000 |
| Received HB | 64,833 | 65,127 | 64,712 | 63,267 | 62,317 |
| % receiving HB | 73% | 74% | 74% | 72% | 71% |
| Housing Association | |||||
| Number of households | 134,000 | 135,000 | 135,000 | 135,000 | 136,000 |
| Received HB | 99,286 | 101,142 | 101,789 | 100,940 | 100,389 |
| % receiving HB | 74% | 75% | 75% | 75% | 74% |
| Social Sector | |||||
| Number of households | 223,000 | 223,000 | 223,000 | 223,000 | 224,000 |
| Received HB | 164,119 | 166,269 | 166,501 | 164,207 | 162,706 |
| % receiving HB | 74% | 75% | 75% | 74% | 73% |
| Private rented | |||||
| Number of households | 180,000 | 189,000 | 188,000 | 196,000 | 208,000 |
| Received HB | 79,135 | 84,206 | 87,288 | 86,688 | 84,630 |
| % receiving HB | 44% | 45% | 46% | 44% | 41% |
Sources: DWP StatXplore, Stock by tenure figures from DCLG Live Tables.
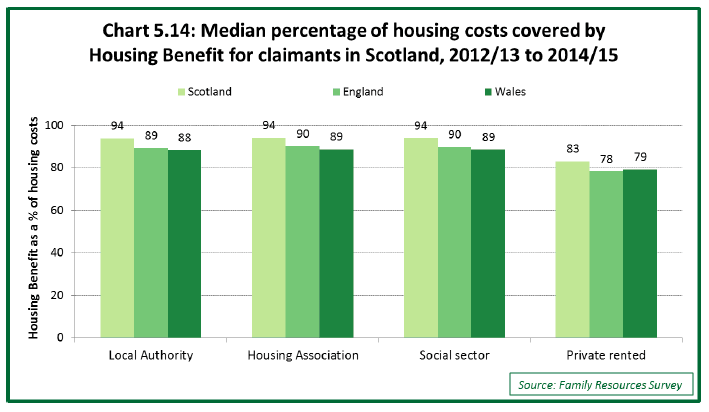
Chart 5.14 shows the median percentage of housing costs covered by housing benefit, as measured by the Family Resources Survey over the period from 2012/13 to 2014/15. The average figures presented have been calculated based on the median ratio of the value of housing benefit received as a proportion of total housing costs for each household in the survey. Note that the calculation only includes households that are in receipt of some amount of housing benefit.
Percentages of housing costs covered by housing benefit can be lower than claimant rates for a number of reasons:
- If the claimant's income exceeds a pre-determined amount (the applicable amount), then the housing benefit award will be less than their rent.
- If the household is in the private sector, housing benefit amounts can be capped at the Local Housing Allowance rate.
- Housing benefit can only cover rent costs whereas housing costs can include other charges such water rates, ground rent, and service charges.
- The spare room subsidy (also known as the 'bedroom tax') can reduce housing benefit for households in the social sector if the household is deemed to have more bedrooms that required for the residents of the household. The bedroom tax is mitigated in Scotland through Discretionary Housing Payments.
When looking at local authority households in Scotland in receipt of housing benefit, the average (median) value of housing costs covered by housing benefit was 94%. The figure was the same (94%) for housing association households. For private rented households the equivalent figure was 83%.
Social rented households in Scotland had a median value of 94% of housing costs covered by housing benefit, a figure higher than the equivalent percentage for England (90%). The figure for Wales was 89% however due to sample sizes there is insufficient evidence to say whether or not this is significantly different to Scotland's figure.
Chart 5.14: Median percentage of housing costs covered by Housing Benefit for claimants in Scotland, 2012/13 to 2014/15
Discretionary Housing Payments ( DHPs) are administered in Scotland by local authorities, and may be awarded when a local authority considers that a claimant on Housing Benefit or Universal Credit (which includes a housing element towards rental liability) requires further financial assistance towards housing costs.
During 2015/16, the UK Government made £13.3 million available to Scottish Local Authorities for DHP funding. The Scottish Government made an additional £35 million available, money estimated to be sufficient for local authorities to fully mitigate the Removal of the Spare Room Subsidy, also known as the 'bedroom tax'.
During 2015/16, a total of 116,000 DHP awards were granted, with an average award value of £425. This figure is likely to include a sizeable number of cases affected by the Removal of the Spare Room Subsidy, where local authorities continued to make up their shortfall in weekly rent through the use of DHPs. The total value of awards spent across Scotland in 2015/16 was £49.2 million.
For further details see Discretionary Housing Payments in Scotland Statistics publications available at http://www.gov.scot/Topics/Statistics/Browse/Social-Welfare/dhp.
5.6 How well households are managing financially
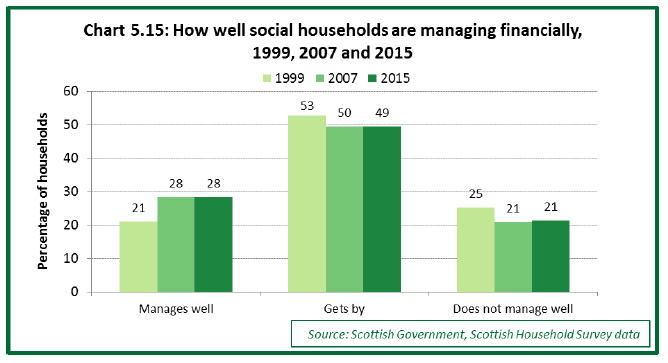
The Scottish Household Survey asks respondents how well their household is managing financially. In the latest year (2015), 28% of social rented households stated that they managed well, an increase from 21% in 1999.
Chart 5.15: How well social households are managing financially, 1999, 2007 and 2015
There is very little difference in responses between local authority and housing association households in 2015, with similar percentages being reported for each category.
Chart 5.16: How well social households are managing financially, 2015, by social landlord
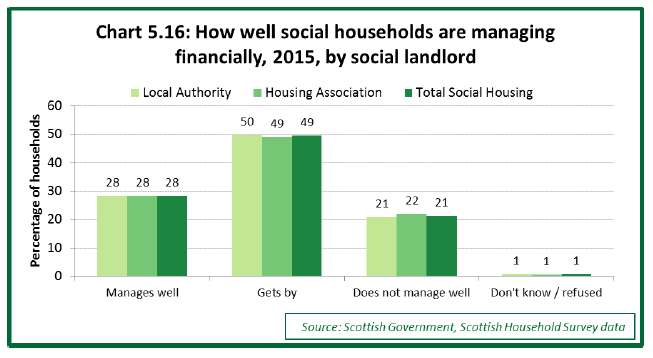
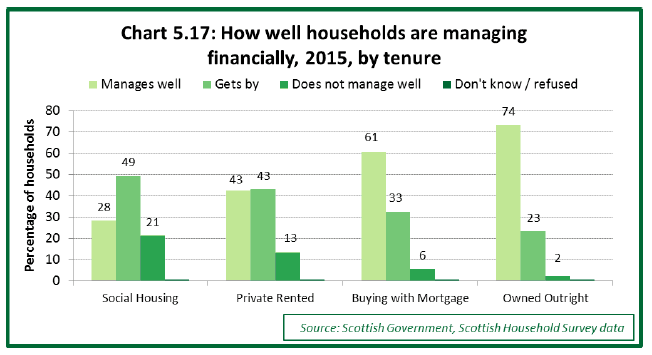
Chart 5.17 below shows how social households compare to other tenures for how well they are managing financially in 2015. Social households are less likely to be managing well (28%) compared with private rented households (43%), households buying with a mortgage (61%) and households who own outright (74%). Correspondingly social households are more likely to not be managing well (21%) compared with other tenures (13% for private rented households, 6% for households buying with a mortgage and 2% for households who own outright).
Chart 5.17: How well households are managing financially, 2015, by tenure
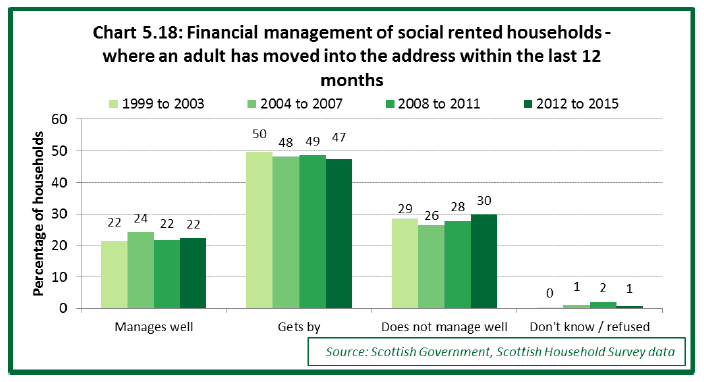
When looking at social rented households in Scotland in which an adult had moved into the address within the last 12 months (which includes new-lets as well as changes to existing household compositions), 22% stated they managed well in 2012 to 2015, a figure lower than the equivalent percentage (28%) for all social households in 2015. Whilst 30% stated they did not manage well in 2012 to 2015, a figure higher than the equivalent percentage (21%) for all social households in 2015. This suggests that newly formed social rented households are less likely to be managing well financially than more established social rented households.
Chart 5.18: Financial management of social rented households - where an adult has moved into the address within the last 12 months
Contact
Email: Esther Laird
There is a problem
Thanks for your feedback