Social tenants in Scotland 2017
Overview of social tenants and social rented housing in Scotland for 2017, covering information on stock, households, housing flows, rents and income.
Section 2 - Number of Social Tenants and Social Housing Stock Provision
2.1 Number of people in social housing and stock levels
Similar to the previous three years, social rented housing in Scotland in 2017 was provided by 26 of the 32 local authorities who owned and ran local authority housing stock, along with 161 housing associations who owned and ran housing association stock. Of the 32 local authorities, 6 did not directly manage social housing stock due to previous stock transfers to housing associations across the years 2003 to 2007, however they still provided some housing services such as homelessness support.[10]
There were an estimated 1.14 million people living social rented housing in 2017, a similar figure to the estimated 1.17 million people in the previous year, but a decrease of around 18% from the estimated 1.49 million people in 1999.
Social housing stock totalled 593,841 units in 2017, a slight decrease of 791 (0.1%) homes from 594,632 units in 2016, and an 18% decrease on the 726,283 units in 1999. A total of 314,816 units (53%) of social rented housing stock in 2017 was owned by local authority providers, with 279,025 (47%) being owned by housing association providers.
Chart 2.1: Estimated number of people in social housing and stock Levels, 1999 to 2017
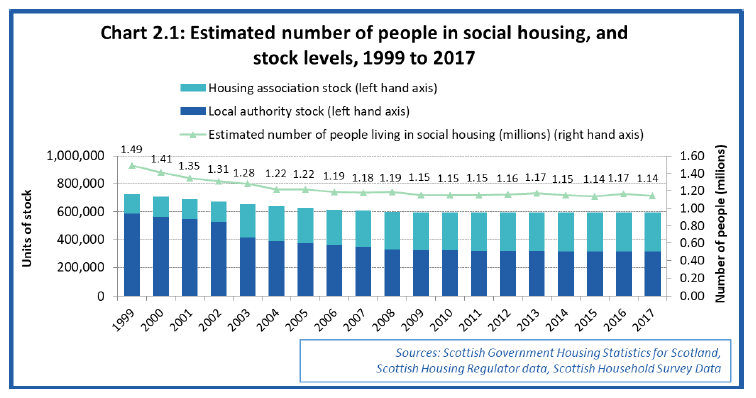
From 1999 to 2009 the number of people living in social housing in Scotland fell by an estimated 330,000 people (23%) from 1.49 million people to 1.15 million people. During this time period the amount of social housing stock dropped by 132,208 homes (18%) from 726,300 to 594,100. The percentage drop in the number of people was greater than the percentage drop in the stock because the average size of a social rented household decreased from 2.1 people in 1999 to 2.0 people in 2009.
Since 2009 social housing stock levels have remained broadly stable at between around 594,000 and 597,000 units per year between 2009 and 2017. Between 2009 and 2017, the number of people in social housing has been between around 1.14 million and 1.17 million each year. The estimated 1.14 million people living in social housing in 2017 is 18% lower than the estimated 1.49 million people living in social housing in 1999.
The drop in levels of social housing stock between 1999 and 2009 can be attributed to the number of sales (i.e. Right to Buy sales) and demolitions being higher than the number of units of new supply achieved through new build completions and other acquisitions of stock. Social housing stock levels have been broadly stable between 2009 and 2017, which suggests that the number of units demolished and sold under Right to Buy each year across this time period has largely been balanced out by new supply provision.
Stock transfers in 6 local authority areas between 2003 and 2007 saw dwellings being transferred from local authority control to housing associations. Glasgow, Dumfries and Galloway and Scottish Borders transferred their stock in 2003, followed by Argyll and Bute and Na h-Eileanan Siar in 2006, and Inverclyde in 2007.
Chart 2.2: Average number of people per household, social rented households
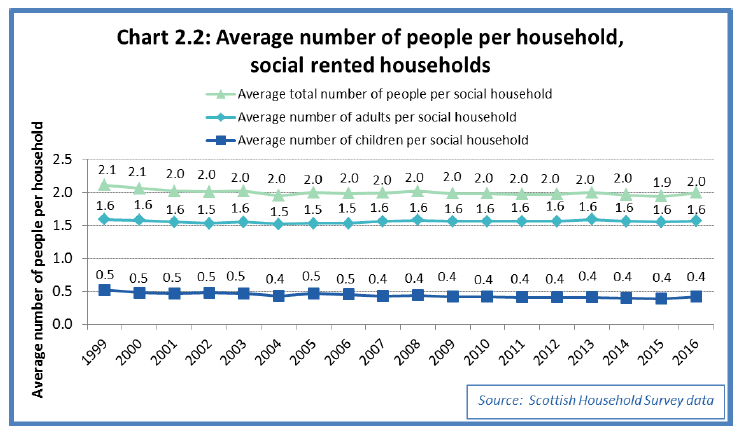
There were an average of 2.0 people per social rented household in 2017, an average of 1.6 adults and 0.4 children. These figures are similar to the previous year, but a decrease from the 2.1 people per social household in 1999. The drop from 1999 to 2017 has been due to a fall in the average number of children per household from 0.5 in 1999 to 0.4 in 2017.
Further detail on public sector stock figures is available from the 'Housing Statistics for Scotland 2018: Key Trends Summary'[11] and associated web tables[12].
The introduction of Right to Buy legislation in 1979 had a substantial impact on the profile of Scottish housing, with nearly half a million social housing properties being sold from 1979 to 2016. The provision to end Right to Buy with a two year notice period was included in the Housing (Scotland) Act which received Royal Assent on 1 August 2014, and the scheme subsequently closed to all new applicants on 31 July 2016, with most of the final sales being completed by late 2017.
Further detail on Right to Buy sales statistics and other factors associated with social housing stock levels, such as new build housing by local authorities and housing associations, is published in Quarterly Housing Statistics updates, available from the Scottish Government Housing Statistics webpages[13].
2.2 Local authorities and housing associations - stock levels and operating areas
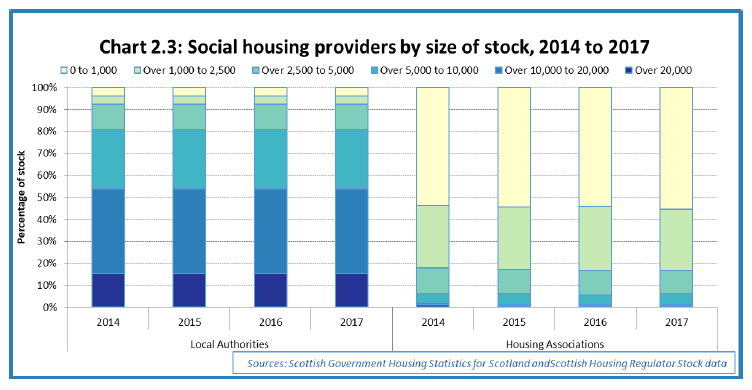
Chart 2.3 shows the percentage of local authorities and housing associations by the size of their stock, for each year from 2014 to 2017 (March each year). It can be seen that local authorities generally have a larger size of stock, with almost two-thirds (65%) of the 26 local authorities having stock levels between 5,001 and 20,000 homes as at 2017, whilst more than eight in ten (83%) housing associations had stock levels of 2,500 homes or less. There has been little change to this pattern since 2014.
Chart 2.3: Social housing providers by size of stock, 2014 to 2017
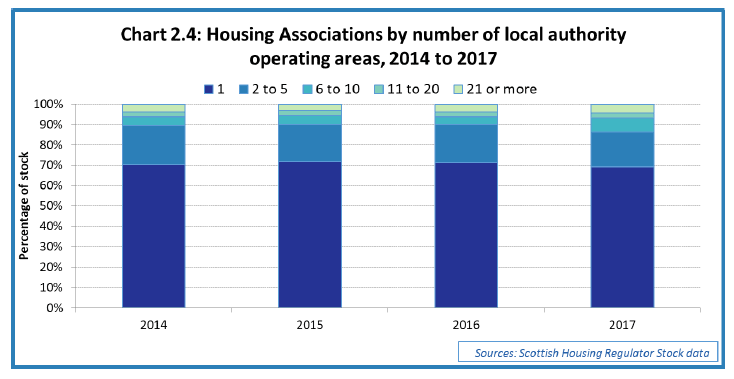
Whilst local authorities operate within each of their own specific areas, housing associations can operate across different local authority areas. Chart 2.4 below shows the percentage of housing associations by the number of different local authority areas that they operate in, for 2014 to 2017 (March for each year). In 2017, 69% of housing associations operated in a single local authority area; 17% operated in 2 to 5 different local authority areas, whilst the remaining 14% operated across 6 or more local authority areas, percentages which are broadly similar to those seen in the previous 3 years, although percentage operating in 6 to 10 local authority areas has increased from 4% in 2016 to 7% in 2017, whilst the percentage operating in 1 to 5 local authority areas has decreased from 90% to 86%.
Chart 2.4: Housing Associations by number of local authority operating areas, 2014 to 2017
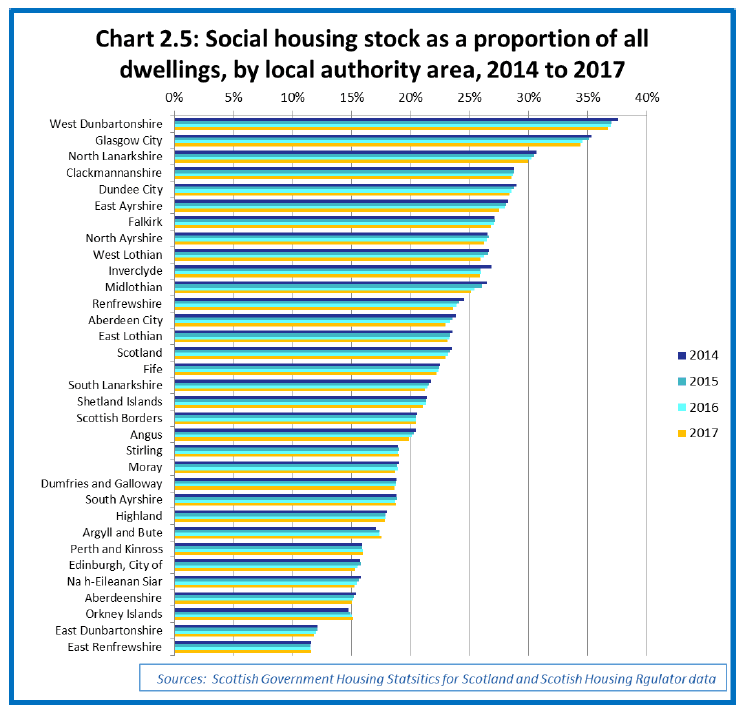
Total social rented housing stock as a percentage of all dwellings in 2017 varied from 12% in East Dunbartonshire and East Renfrewshire to 34% in Glasgow and 37% in West Dunbartonshire. Chart 2.4 below shows these proportions for each local authority for each of the years 2014 to 2017. The largest percentage point decreases in social housing stock proportions across the 4-year period have been seen in Midlothian (-1.3%), Glasgow City and Inverclyde (-1.0%), and West Dunbartonshire, and Renfrewshire (-0.9%).
The largest absolute drop in the number of social stock units across these four years was seen in Glasgow (a drop of 1,051 homes). Increases in the social sector dwellings as a proportion of all dwellings between 2014 and 2017 were seen in Stirling (+0.1%), Orkney (+0.4%) and Argyll & Bute (+0.5%).
Chart 2.5: Social housing stock as a proportion of all dwellings, by local authority area, 2014 to 2017
2.3 Stock across all tenures, Scotland, England and Wales
Chart 2.6 below shows stock across all tenures for Scotland from 2001 to 2017. In 2017 Scotland had a total of 2.59 million dwellings. Social rented housing stock totalled 594 thousand dwellings, 23% of the total. There were 1.60 million owner occupied dwellings (62% of the total) and 393 thousand private rented dwellings (15% of the total).
From 2016 to 2017, the total number of dwellings in Scotland has increased by 1% (19,00 homes), largely driven by an estimated increase of 1% (approximately 21,000 homes) in the number of owner occupier dwellings. The number of social rented properties has dropped slightly (a decrease of 0.1% or 791 homes), whilst the number of private rented dwellings was also estimated to drop slightly by 0.3% (approximately 1,000 homes).
Over the longer term period from 2001 to 2017, the total number of dwellings in Scotland has increased by 12% (273,000 homes). The number of social rented properties across this time period has fallen by 14% (98,000 homes), whilst the number of private rented dwellings has more than doubled (a 128% increase, or 220,000 homes), and the number of owner occupier dwellings has increased by 10% (151,000 homes).
Chart 2.6: Stock by tenure (thousands of units), Scotland, 2001 to 2017
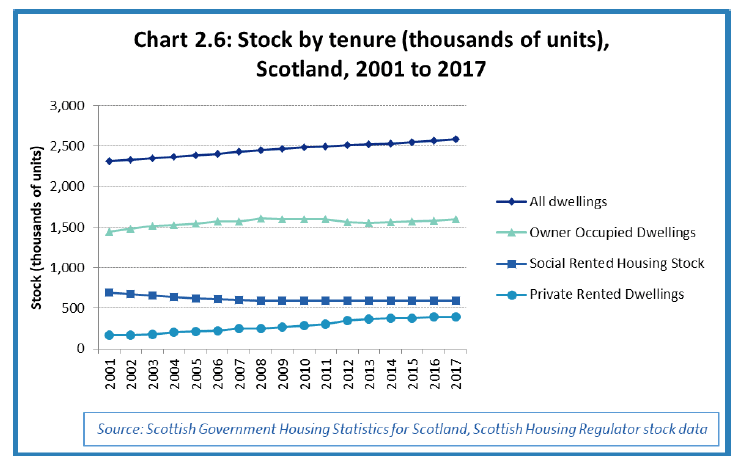
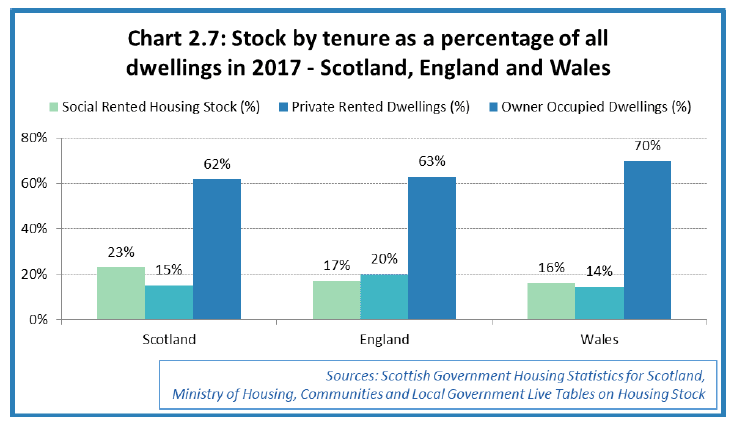
Chart 2.7 below shows stock by tenure as a percentage of all dwellings in 2017 for Scotland, England and Wales. It can be seen that Scotland had the highest proportion of social renting stock (23%) compared to both England (17%) and Wales (16%). England had the highest proportion of private rented dwellings (20%), compared to Scotland (15%) and Wales (14%), whilst Wales had the highest proportion of owner occupier dwellings (70%) compared to both Scotland (62%) and England (63%).
Chart 2.7: Stock by tenure as a percentage of all dwellings in 2017 - Scotland, England, Wales
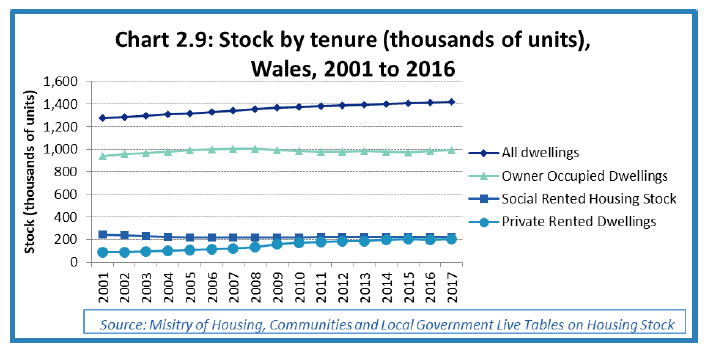
Charts 2.8 and 2.9 below provide further detail on changes to stock by tenure for England and Wales. From these, along with the equivalent figures for Scotland, it can be seen that there have been similar increases in the total number of dwellings over the 2001 to 2017 time period in Scotland, England and Wales (12%, 13%, and 11%, respectively).
Social rented stock fell by 14% in Scotland between 2001 and 2017, a higher proportion than the equivalent figures for England (a 5% drop) and Wales (a 7% drop).
Each country has seen the number of private rented dwellings more than doubling between 2001 and 2017, with increases being 128% in Scotland, 124% in England and 126% in Wales.
The number of owner occupier dwellings in Scotland in 2017 was 10% higher when compared to the numbers in 2001. Wales saw a 5% increase between these two years whilst England saw an increase of 2%.
Chart 2.8: Stock by tenure (thousands of units), England, 2001 to 2016
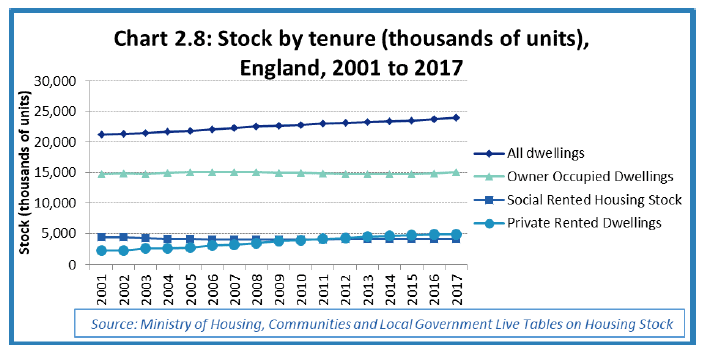
Chart 2.9: Stock by tenure (thousands of units), Wales, 2001 to 2016
2.4 Types of dwellings (houses/flats)
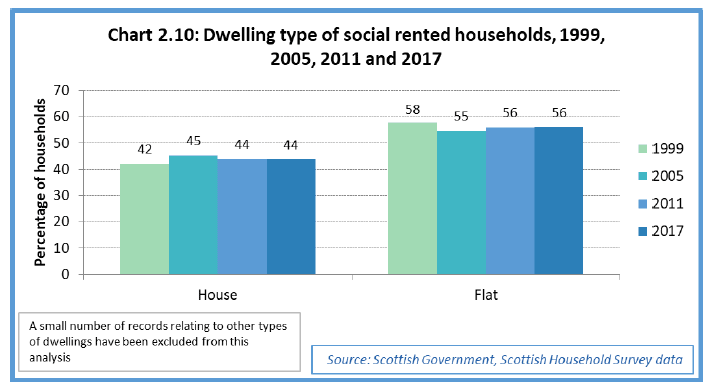
Based on households interviewed as part of the Scottish Household Survey, 44% of social rented households in Scotland in 2017 were living in a house, a similar level to the 42% figure in 1999. Correspondingly, 56% of households were living in a flat in 2016, a similar level to 58% in 1999.
Chart 2.10: Dwelling type of social rented households, 1999, 2005, 2011 and 2017
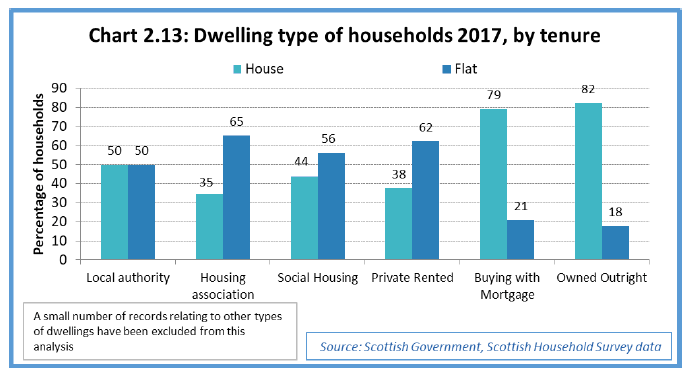
There were some differences in dwelling types between social landlord providers in 2017, with half (50%) of local authority households living in houses and half (50%) living in flats, whilst only 35% of housing association households were living in a house and 65% living in a flat, however some of this difference may be due to the large proportion of flatted properties in Glasgow, a stock transfer authority in which all social stock is owned by housing associations.
Chart 2.11: Dwelling type of social rented households 2017, by social rented landlord
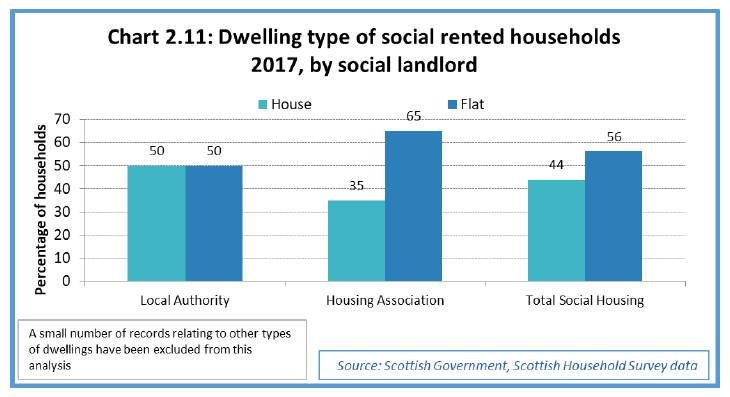
Chart 2.12 presents estimates of dwelling types of social rented households by individual local authority areas. Data for the five years from 2013 to 2017 has been combined together to provide a sufficient sample size to allow a local authority analysis to be produced. However, due to the range of sample sizes across the local authorities, there will be larger margins of error for some local authorities than others, and as such some differences between local authorities should be treated with caution, as these might reflect sampling variation rather than real changes.
As shown in Chart 2.12, city authorities tend to have more social housing flats than houses (Glasgow City 81%, City of Edinburgh 78%, Aberdeen City 75% and Dundee City 68%), whereas more rural authorities have fewer flats (Orkney Islands 17%, Na h-Eileanan Siar 19%, Shetland Islands 20% and Highlands 24%).
Chart 2.12: Dwelling type of social rented households, 2013 to 2017, by local authority
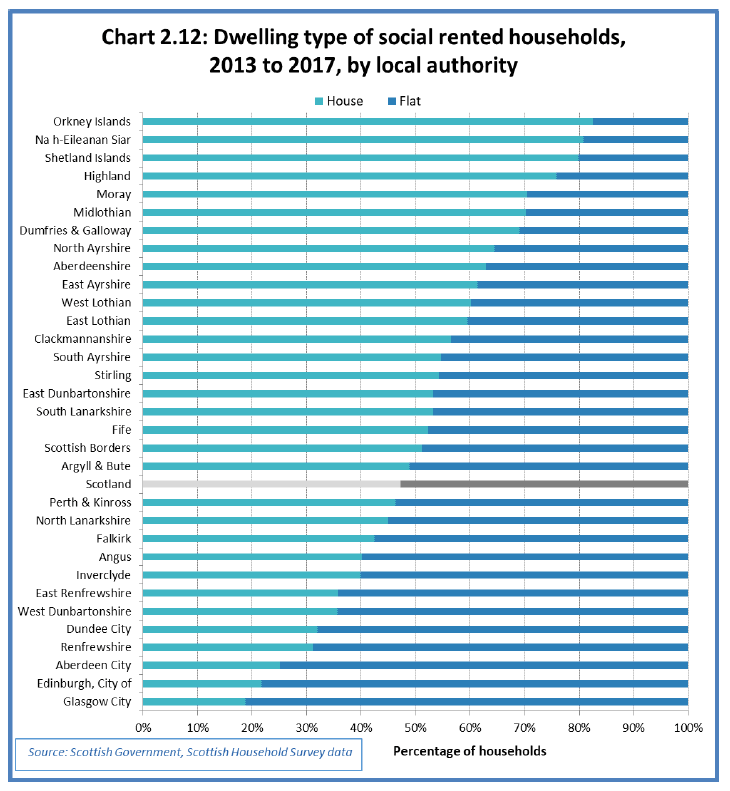
Note: survey data from the four years from 2013 to 2017 has been combined together to provide a sufficient sample size to allow a local authority level analysis. However local authority sample sizes across these four years vary from 140 in East Renfrewshire up to 1,670 in Glasgow City, and so there will be larger margins of error for some local authorities than others. As such some differences between local authorities should be treated with caution, as these might reflect sampling variation rather than real changes.
In 2017, 38% of private rented households were living in houses, a similar proportion to housing association households (35%). Owner occupied households were much more likely to be living in houses, with 79% of households buying with a mortgage living in a house and 82% of households who own outright living in a house.
Chart 2.13: Dwelling type of households 2017, by tenure
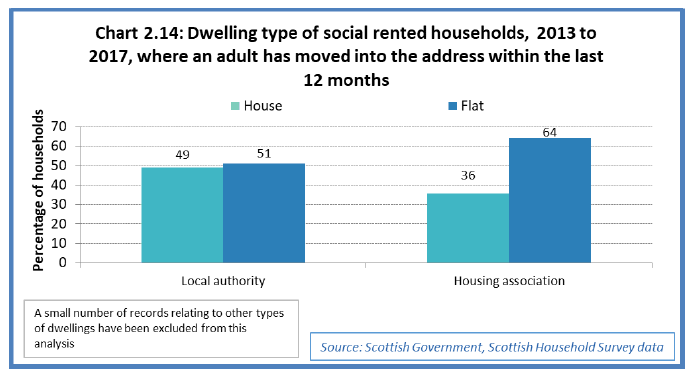
When looking solely at social rented households in which an adult had moved into the property within the last 12 months (which includes new-lets as well as changes to existing household compositions), 49% of local authority and 36% of housing association households were living in a house in 2013 to 2017, figures which are similar to those for all social households in 2016. This would suggest that newly formed social rented households are living in dwelling types (houses/flats) that are similar to more established social households.
Chart 2.14: Dwelling type of social rented households, 2013 to 2017, where an adult has moved into the address within the last 12 months
2.5 Number of bedrooms
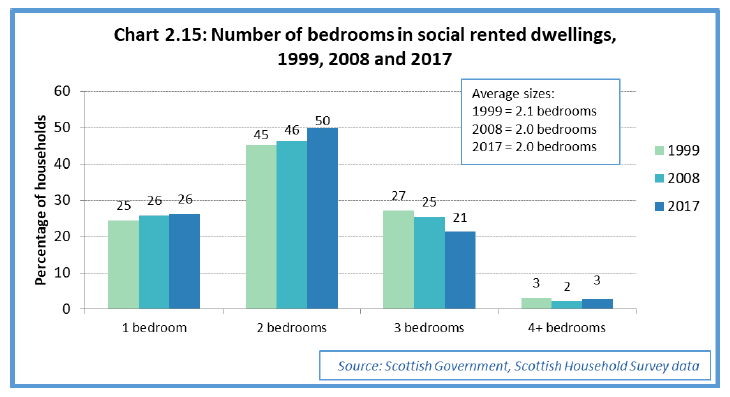
Based on responses from households interviewed for the Scottish Household Survey, dwellings occupied by social rented households in 2017 contained an average of 2.0 bedrooms, compared to an average of 2.1 bedrooms per dwelling in 1999.
There has been an increase over time in the proportion of social rented dwellings that are 2 bedrooms, from 45% in 1999 to 50% in 2017. Correspondingly the proportion of dwellings that are 3 bedrooms has fallen from 27% in 1999 to 21% in 2017.
These trends over time are consistent with changes to the average number of people living in each social rented household, which has fallen from 2.1 people per household in 1999 to 2.0 people per household in 2017, largely due to a fall in the average number of children per household from 0.5 in 1999 to 0.4 in 2017.
Chart 2.15: Number of bedrooms in social rented dwellings, 1999, 2008 and 2017
In 2017, local authority dwellings on average contained 2.1 bedrooms, a higher value than housing association dwellings (1.9 bedrooms). Local authority dwellings are less likely to contain 1 bedroom (23%) compared to housing association dwellings (31%), and are more likely to contain 2 bedrooms (53%) compared to housing association dwellings (46%).
Chart 2.16: Number of bedrooms in social rented dwellings, 2017, by social landlord
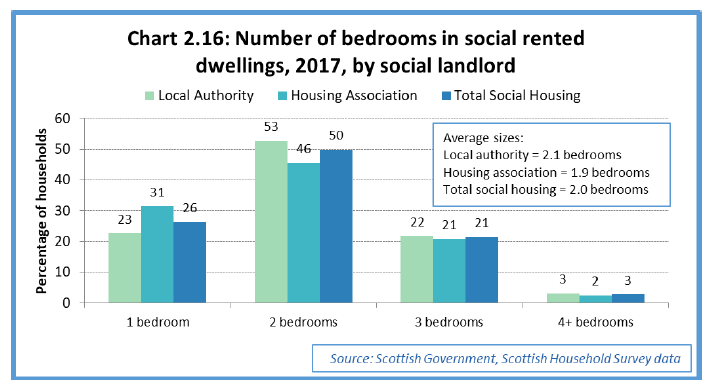
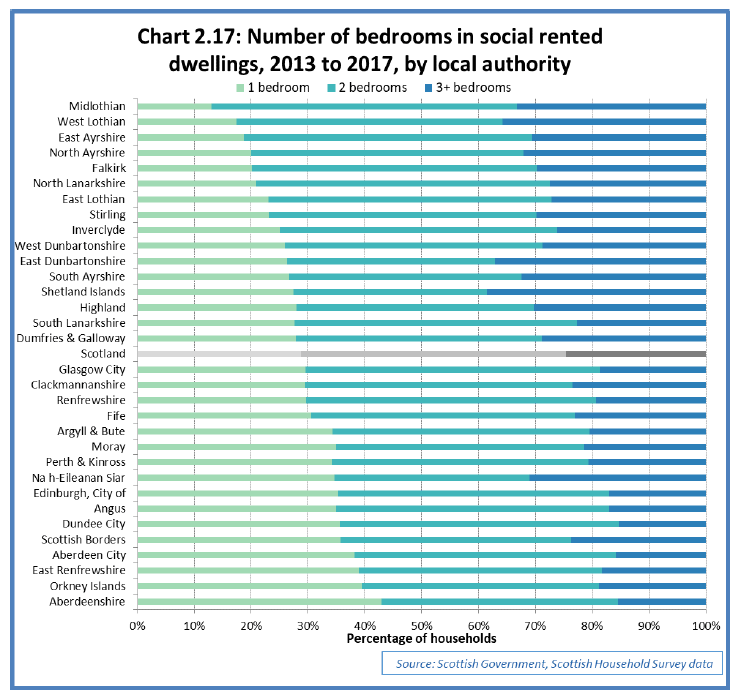
Chart 2.17 below shows that within the five years 2013 to 2017, the percentage of social rented properties with only one bedroom varied from 12% in Midlothian and 16% in West Lothian up to 38% in Aberdeen City, East Renfrewshire and Orkney Island, and 42% in Aberdeenshire. This compared to 28% across Scotland as a whole. The percentage of properties with three or more bedrooms varied from 15% in Aberdeenshire and Dundee City up to 36% in East Dunbartonshire and 37% in the Shetland Islands.
Chart 2.17: Number of bedrooms in social rented dwellings, 2013 to 2017, by local authority
Note: survey data from the four years from 2013 to 2017 has been combined together to provide a sufficient sample size to allow a local authority level analysis. However local authority sample sizes across these four years vary from 140 in East Renfrewshire up to 1,670 in Glasgow City, and so there will be larger margins of error for some local authorities than others. As such some differences between local authorities should be treated with caution, as these might reflect sampling variation rather than real changes.
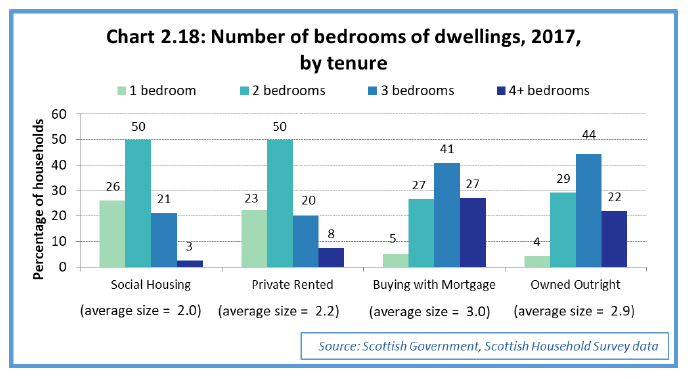
There were some differences in the numbers of bedrooms in dwellings in 2017 by tenure (see Chart 2.18), with social rented dwellings having the smallest average size of 2.0 bedrooms. This compared to an average size of 2.2 bedrooms in private rented dwellings, 2.9 bedrooms in dwellings owned outright, and 3.0 bedrooms in dwellings being bought with a mortgate.
Dwellings being bought with a mortgage and owned outright were much more likely to have 4 or more bedrooms (27% and 22% respectively) than social or private rented dwellings (3% and 8% respectively).
Chart 2.18: Number of bedrooms of dwellings, 2017, by tenure
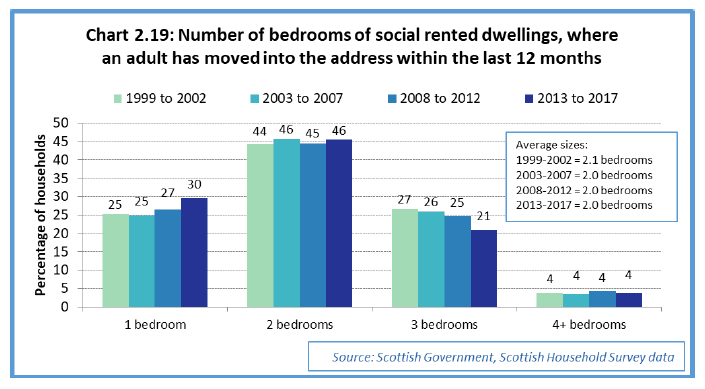
When looking solely at social rented households in which an adult had moved into the property within the last 12 months (which includes new-lets as well as changes to existing household compositions), the number of bedrooms in these dwellings have been similar to the figures for all social rented dwellings. Dwellings occupied by households where an adult had moved into the address within the last 12 months in 2013 to 2017 had on average 2.0 bedrooms. This is the same as the figure of 2.0 bedrooms of all social rented dwellings in 2017. This would suggest that newly formed social rented households are on average living in dwellings with a broadly similar number of bedrooms to more established social households. However dwellings occupied by households where an adult had moved into the address within the last 12 months in 2013 to 2017 are more likely to be 1 bedroom (31%) than compared to all social rented households in 2017 (26%), and are less likely to be 2 bedrooms (44%) than compared all social households (50%).
Chart 2.19: Number of bedrooms of social rented dwellings, , 2013 to 2017, where an adult has moved into the address within the last 12 months
2.6 Location of households in Areas of Multiple Deprivation
The Scottish Index of Multiple Deprivation (SIMD[14] ) is a Scottish Government statistical tool for identifying places in Scotland suffering from deprivation. It incorporates several different aspects of deprivation, combining them into a single index. It divides Scotland into small areas and provides a relative ranking for each area from most deprived to least deprived.
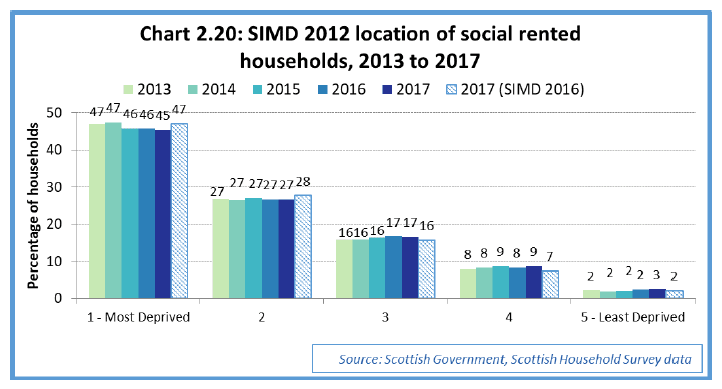
Based on the location of households interviewed for the Scottish Household Survey, 45% of social rented households in 2017 were living in dwellings in the 20% most deprived areas of Scotland (as defined by the SIMD 2012 measure), a similar proportion to the years 2013 to 2017. Only 2% were living in the 20% least deprived areas of the country. The SIMD 2012 measure has been used to enable comparisons to made between these years. When using the most recent measure, SIMD 2016, 47% of social rented households in 2017were living in dwellings in the 20% most deprived areas of Scotland.
Chart 2.20: SIMD location of social rented households, 2013 to 2017
There were some differences in deprivation locations between social landlord providers in 2017 (see Chart 2.21), with 51% of housing association households living in dwellings in the 20% most deprived areas, compared to 42% of local authority households. However some of this difference may be due to the number of households located in deprived areas within Glasgow, a stock transfer authority in which all social stock is owned by housing associations.
Chart 2.21: SIMD-2012 location of social rented households, 2017, by landord
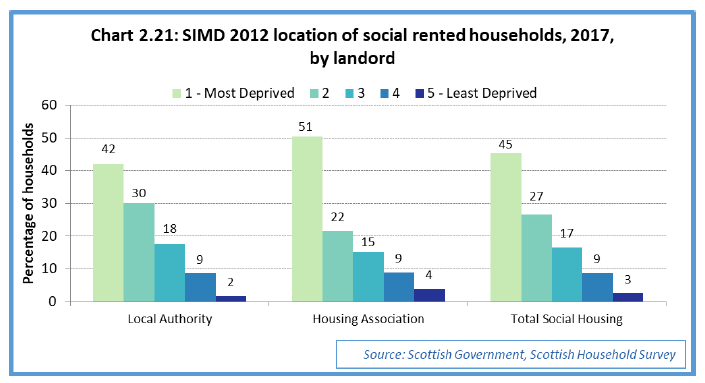
Chart 2.22 below shows the percentage of social rented households in each local authority who live in one of the 20% most deprived areas of Scotland. In Glasgow and Inverclyde, 82% and 81% of social rented households, respectively, live in one of the 20% most deprived areas of the country. In the island local authorities (Shetland, Orkney and Na h-Eileanan Siar) 0% of social rented households lived in one of the 20% most deprived areas of Scotland, however these figures can be explained because none of the areas of these three local authorities have been classed as being in the most 20% deprived areas of Scotland. For SIMD 2012 as a whole, the percentage of datazones in the most 20% deprived areas of the country varies from 0% in Shetland, Orkney and Na h-Eileanan Siar, up to 45% in Inverclyde and 49% in Glasgow.
Chart 2.22: Social rented households living in the 20% most deprived areas of Scotland, 2013 to 2017, by local authority
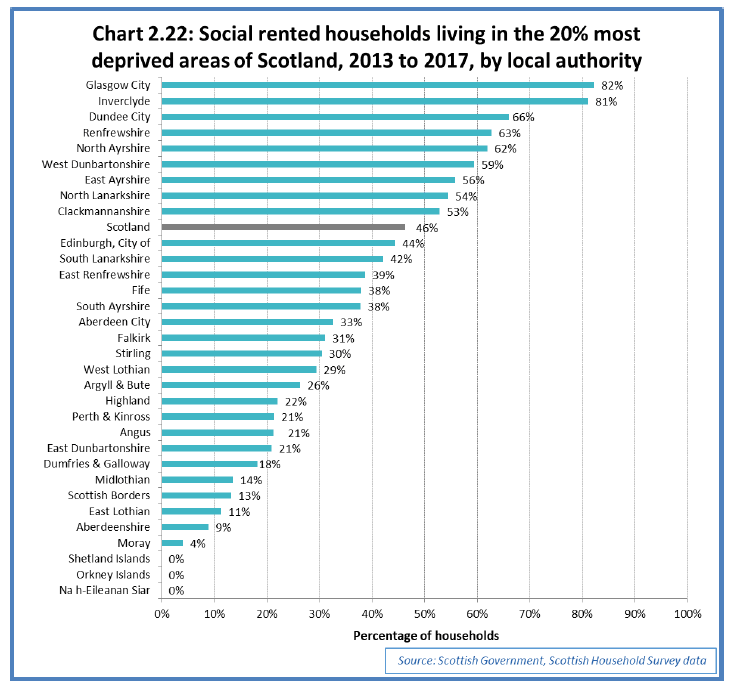
Note: survey data from the four years from 2013 to 2017 has been combined together to provide a sufficient sample size to allow a local authority level analysis. However local authority sample sizes across these four years vary from 140 in East Renfrewshire up to 1,670 in Glasgow City, and so there will be larger margins of error for some local authorities than others. As such some differences between local authorities should be treated with caution, as these might reflect sampling variation rather than real changes.
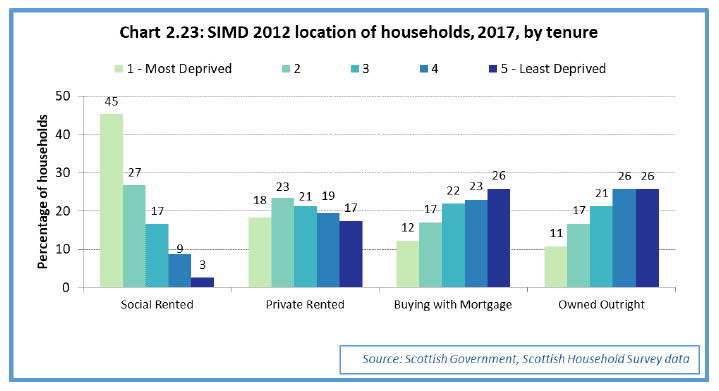
There were also differences in deprivation locations between social rented households and other tenures. In 2017, 45% of social rented households were living in the 20% most deprived areas, compared to 18% of private rented households, 12% of households buying with a mortgage and 11% of households owning outright. Only 3% of social rented households were living in the 20% least deprived areas, which compared to 17% for private rented households, 26% for households buying with a mortgage and 26% of households owning outright.
Chart 2.23: SIMD-2012 location of households, 2017, by tenure
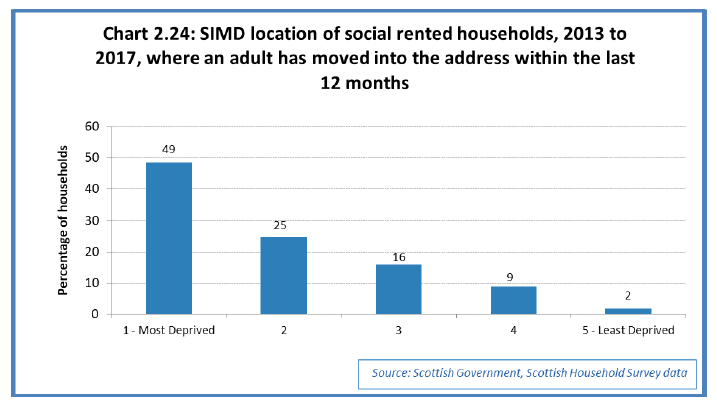
When looking solely at social rented households in which an adult had moved into the property within the last 12 months from 2013 to 2016 (which includes new-lets as well as changes to existing household compositions), 49% of social rented households were living in dwellings in the 20% most deprived areas, which is similar to the equivalent figure for all social households in 2017 (45%), with the difference between these figures not being statisticially significant. This suggests that newly formed social rented households are equally likely to be living in dwellings located in the 20% most deprived areas of the country compared with more established social households.
Chart 2.24: SIMD location of social rented households, 2013 to 2017, where an adult has moved into the address within the last 12 months
2.7 Location of households in rural or urban areas
The Scottish Government Urban Rural Classification 2013/14[15] provides a standard definition of urban and rural areas in Scotland.
Based on the location of households interviewed for the Scottish Household Survey in 2017, 25% of local authority households were living in dwellings in large urban areas, compared to 53% of housing association households. Also, 50% of local authority households were living in other (i.e. non-large) urban areas, compared with 29% of housing association households. These differences may be partly explained by stock transfers that have happened, for example all social rented housing in Glasgow is now provided by housing associations, properties which are mostly likely to fall within the large urban area category.
Chart 2.25: Urban Rural location of social rented households, 2017, by landlord
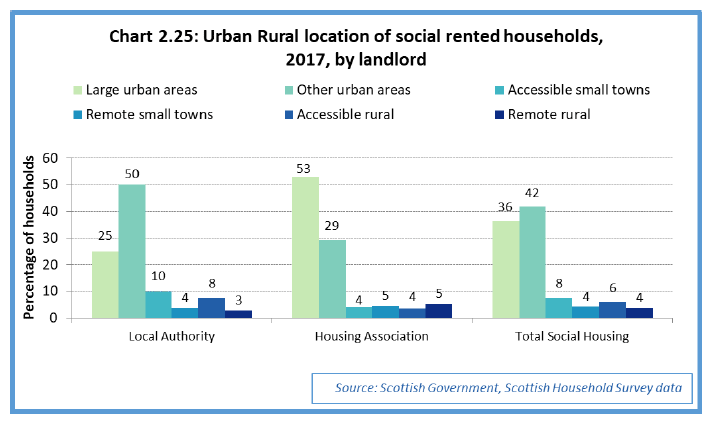
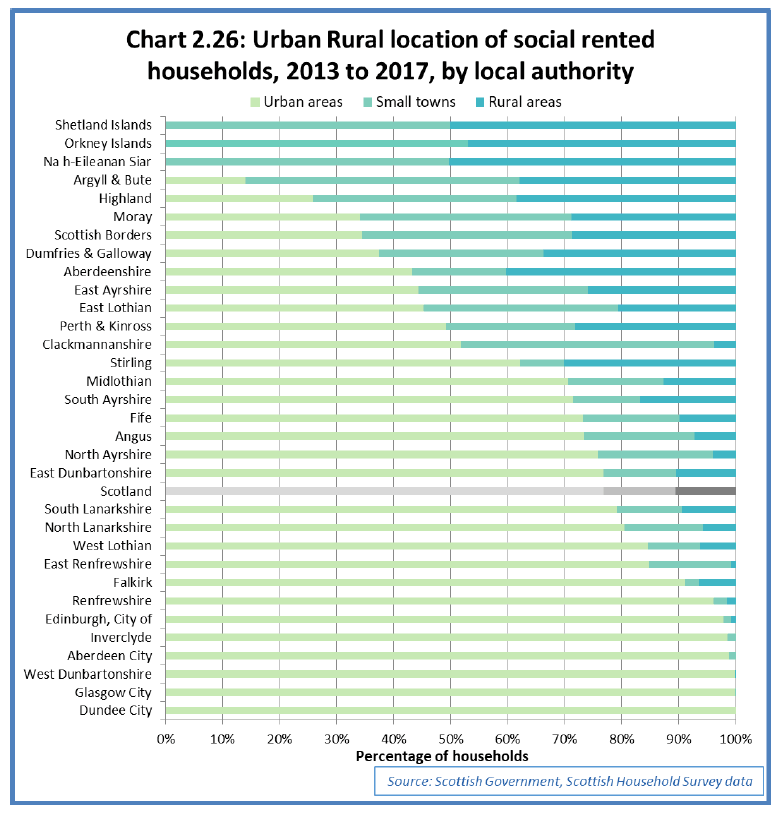
Chart 2.26 below shows the urban rural location of social rented households in each local authority. The six classifications have been combined to make three categories: urban areas (includes large and other urban areas), small towns (includes accessible and remote small towns), and rural areas (includes accessible and remote rural). Based on the location of households interviewed for the Scottish Household Survey between 2013 and 2017, around 100% of social rented households in Dundee City, Glasgow City and West Dunbartonshire lived in an urban area. Na h-Eileanan Siar, Orkney and Sheland all had 0% of social rented households living in urban areas, and around half of households living in small towns.
Chart 2.26: Urban Rural location of social rented households, 2013 to 2017, by local authority
Note: survey data from the four years from 2013 to 2017 has been combined together to provide a sufficient sample size to allow a local authority level analysis. However local authority sample sizes across these four years vary from 140 in East Renfrewshire up to 1,670 in Glasgow City, and so there will be larger margins of error for some local authorities than others. As such some differences between local authorities should be treated with caution, as these might reflect sampling variation rather than real changes.
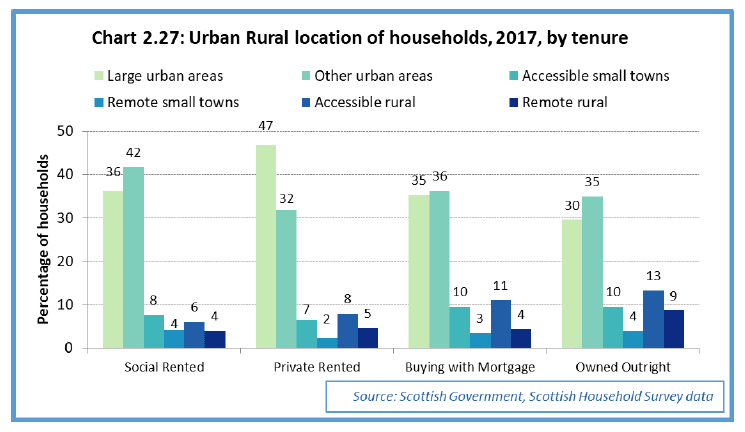
The urban rural location of households in 2017 also varied across other tenures, with social rented households being less likely to live in Accessible Rural areas (6%) compared with households buying with a mortgage (11%) or owning outright (13%), and also being less likely to live in Remote Rural areas (4%) compared to household owning outright (9%).
Chart 2.27: Urban Rural location of households, 2017, by tenure
2.8 Scottish Housing Quality Standard
The Scottish House Condition Survey (SHCS) module of the Scottish Household Survey assesses properties under the Scottish Housing Quality Standard (SHQS), a common standard for assessing the condition of Scottish housing.
The SHQS target for social housing was incorporated into the Scottish Social Housing Charter and the independent Scottish Housing Regulator (SHR) is responsible for monitoring landlords' performance. Latest figures published by the SHR indicate that 94.2% of social homes met the SHQS in 2017/18[16]. This is higher than the compliance rate estimated through the SHCS. Although both sources have shown substantial improvements in quality standards over time, there are some differences in the methods and the timing for collecting the data that account for the difference in headline rates.
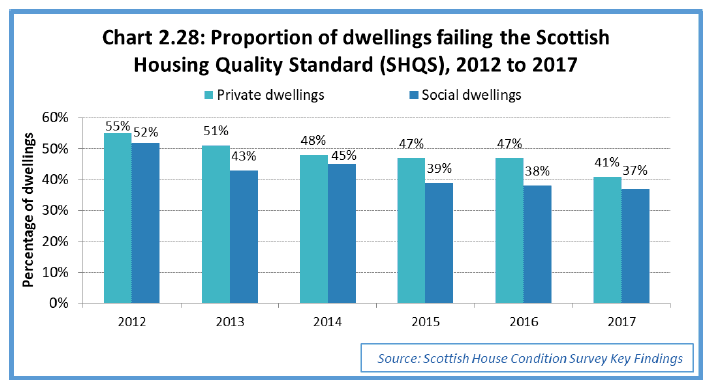
In 2017, SHCS results showed that 37% of social rented dwellings failed the SHQS, a decrease from 52% of dwellings in 2012. Local authority properties were more likely to fail the standard (42%) than housing association properties (30%).
Chart 2.28: Proportion of dwellings failing the Scottish Housing Quality Standard (SHQS), 2012 to 2017
A property failing SHQS can be due to more than one criteria. The most likely reason for social rented properties to fail the SHQS in 2017 was under the criteria of being sufficiently energy efficient (26%). 7% were assessed as failing due to not being healthy, safe or secure, and 7% failed due to lacking modern facilities or services.
The Scottish Government House Condition Survey Key Findings Report 2017[17] contains a range of further information on the quality and energy efficiency of housing stock in Scotland, with local authority level reports also available[18].
Contact
There is a problem
Thanks for your feedback