Social tenants in Scotland 2017
Overview of social tenants and social rented housing in Scotland for 2017, covering information on stock, households, housing flows, rents and income.
Section 3 - Characteristics of Social Tenants
3.1 Household composition
The Scottish Household Survey collects information on household compositions. Based on the categories defined in the survey, the most common types of social rented households in 2017 were single working age adult households (29%) and single pensioner households (20%), as shown in Chart 3.1 below.
Household types used in the Scottish Household Survey:
Single pensioner household consists of one adult of pensionable age (65+ for women, and 65+ for men) and no children
Single parent household consists of an adult and one or more children.
Single adult household consists of an adult of non-pensionable age and no children.
Older smaller household contains either (a) an adult of non-pensionable age and an adult of pensionable age and no children or (b) two adults of pensionable age and no children.
Large adult household has three or more adults and no children.
Small adult household contains two adults of non-pensionable age and no children.
Large family household consists of either (a) two adults and three or more children or (b) three or more adults and one or more children.
Small family households consist of two adults and one or two children.
Note that this definition changed slightly in 2015 compared to previous years, with the 65 years cut-off applied for pensioner age
However, there has been some change over time in these percentages, with the proportion of single working age adult households in social rented housing growing from 18% in 1999 to 29% in 2017. The proportion of single pensioner households has dropped over the same time period from 25% in 1999 to 20% in 2017. The percentage of older smaller households has also dropped from 12% in 1999 to 7% in 2017. (See Chart 3.1 below).
In 2017, 11% of social rented households were single parent families, 9% were small families and 5% were large families.
Households with a single adult member (single parent, single working age adult or single pensioner) accounted for 60% of all social rented households in 2017.
The household composition profile of social rented households across the period 1999 to 2008 may have been impacted on by the estimated drop of 120,000 social rented households over these years, largely as a result of Right to Buy sales.
Chart 3.1: Household composition of social rented households, 1999, 2008 and 2017
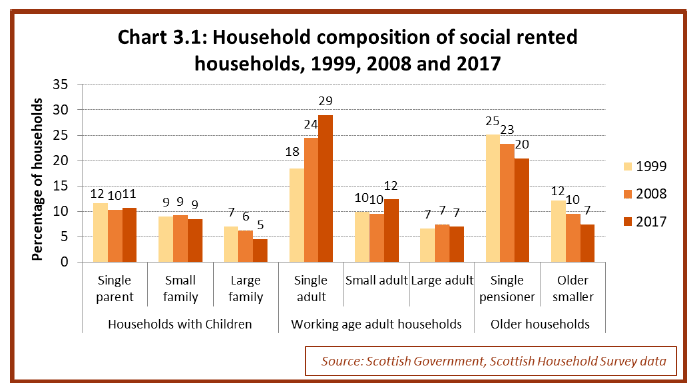
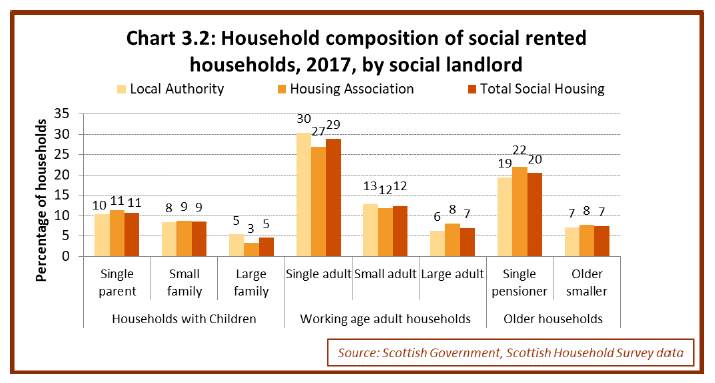
Chart 3.2 below shows that local authority and housing association households had similar profiles of household composition categories in 2017.
Chart 3.2: Household composition of social rented households, 2017, by social landlord
Based on responses from households interviewed for the Scottish Household Survey between 2013 and 2017, a breakdown of the household composition of social rented households by local authority is shown in Chart 3.3. The proportion of households with children ranged from 19% in East Renfrewshire to 33% in Highland and Midlothian. The proportion of social rented households with working age adults ranged from 35% in Midlothian to 54% in Edinburgh; and the proportion of older households ranged from 24% in West Lothian and Highland to 36% in Perth & Kinross and 37% in Aberdeenshire. This compares to the Scotland average for social rented households of 25% households with children, 45% working age adults, and 30% older households.
Chart 3.3: Household composition of social rented households, 2013 to 2017, by local authority
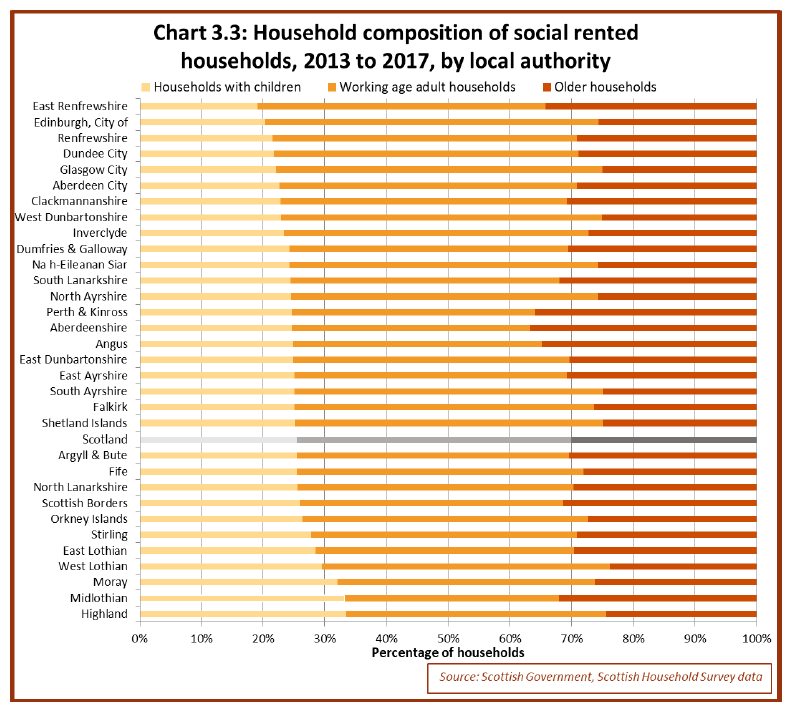
Note: survey data from the four years from 2013 to 2017 has been combined together to provide a sufficient sample size to allow a local authority level analysis. However local authority sample sizes across these four years vary from 140 in East Renfrewshire up to 1,670 in Glasgow City, and so there will be larger margins of error for some local authorities than others. As such some differences between local authorities should be treated with caution, as these might reflect sampling variation rather than real changes.
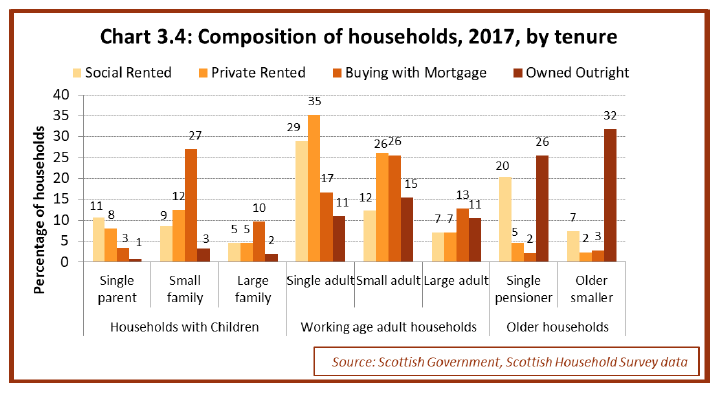
Chart 3.4 shows how household compositions varied between different tenures in 2017. Social rented households in 2017 had a broadly similar percentage of single parent families (11%) to private rented households (8%). Likewise, social rented households also had a similar percentage of small and large family households (9% and 5%, respectively) to private rented households (12% and 5%, respectively).
However, social rented households had a lower proportion of single working age adult households (29%) compared with private rented households (35%) and had a lower percentage of small working age adult households (12%) compared with private rented households (26%).
Owned outright households were characterised by a large proportion (57%) of older households.
35% of households buying with a mortgage were households with children; a percentage higher than other tenures.
Chart 3.4: Composition of households, 2017, by tenure
The Ministry of Housing, Communities and Local Government (MHCLG) English Housing Survey 2016 to 2017[19] has collected information on household compositions in England. This has used slightly different household composition categories, so it is not possible to compare proportions for each household category. However from the MHCLG results it can be seen that 17% of social rented households in England in 2016/17 were single parents (categorised as "lone parent, dependent children"), a figure which was higher than the equivalent 11% figure for Scotland in 2017.
From the Scottish Household Survey it is possible to identify households in which an adult has moved into that address within the last 12 months. This can be used as an indicator of newly formed social households, although this will include changes to existing household compositions as well as new social housing lets.
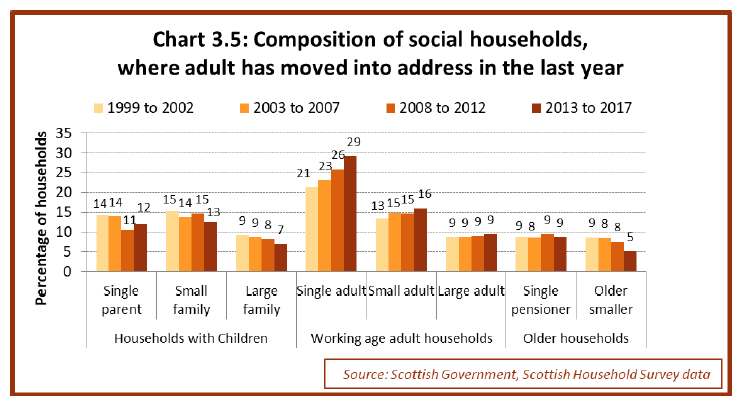
For social rented households in which an adult had moved into the property within the last 12 months, the proportion that were single adult households has grown from 21% in 1999 to 2002 to 29% in 2013 to 2017. Of the social rented households in 2013 to 2017 in which an adult had moved into the property within the last 12 months, only 9% were single pensioners. This compares to 20% of all social rented households being single pensioners, and indicates that newly formed social households are less likely to contain single pensioner households when compared with more established social rented households.
Chart 3.5: Composition of social households, where adult has moved into address in the last year
3.2 Age
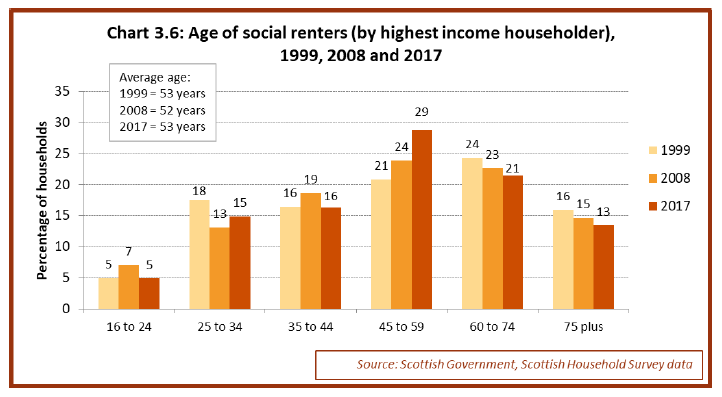
Social rented households in Scotland in 2017 contained adults across a range of age categories (as measured by highest income householder), with 29% having a highest income householder aged 45 to 59 years, 21% having a highest income householder aged 60 to 74 years, 16% having a highest income householder aged 35 to 44 years, and 15% having a highest income householder aged 25 to 34.
The proportion of households in social rented housing in Scotland containing a highest income householder in the age group 45 to 59 years has grown from 21% in 1999 to 29% in 2017. Correspondingly, there have been drops in the proportion containing householders aged 25 to 34 (from 18% to 15%), aged 60 to 74 (24% to 21%), and aged 75 plus (16% to 13%).
The average age of the highest income householder in social rented housing in 2017 was 53 years, the same as the average in 1999.
The age profile of social rented households across the period 1999 to 2008 may have been impacted on by the estimated drop of 120,000 social rented households over these years, largely as a result of Right to Buy sales.
Chart 3.6: Age of social renters (by highest income householder), 1999, 2008 and 2017
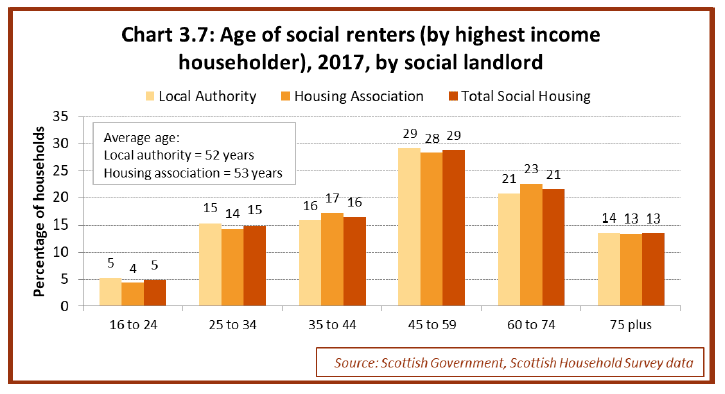
Local authority and housing association households in Scotland had a similar profile of households by age in 2017, with both having a similar average age of highest income householder (see Chart 3.7).
Chart 3.7: Age of social renters (by highest income householder), 2017, by social landlord
The age profiles of social rented households varied between local authorities, as shown in Chart 3.8 below. Orkney had the highest percentage of households with the highest income householder under the age of 35 (36%), compared to East Dunbartonshire with the lowest proportion (14%). Shetland and Highland had the lowest proportion of social rented households with the highest income householder aged 60 or over (29%) whereas Midlothian had the highest proportion (42%).
Chart 3.8: Age of social rented households (by highest income householder), 2013 to 2017, by local authority
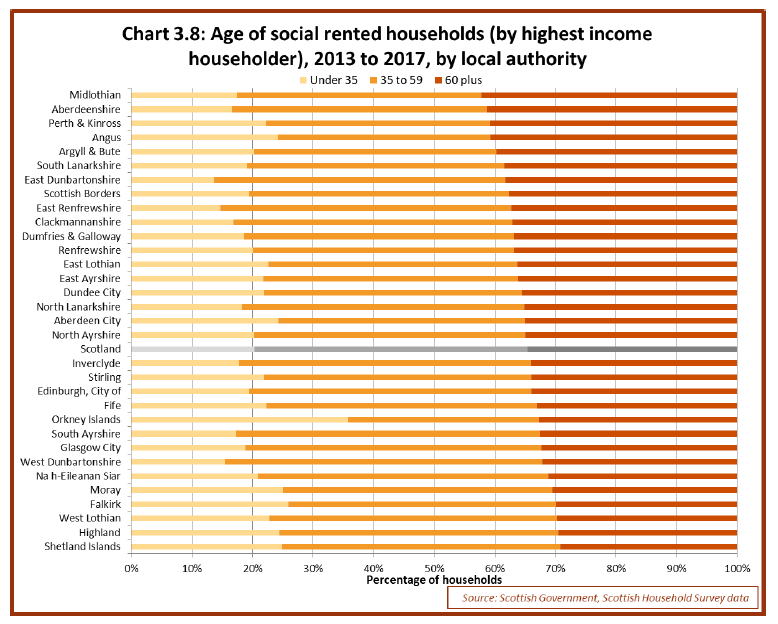
Note: survey data from the five years from 2013 to 2017 has been combined together to provide a sufficient sample size to allow a local authority level analysis. However local authority sample sizes across these four years vary from 140 in East Renfrewshire up to 1,670 in Glasgow City, and so there will be larger margins of error for some local authorities than others. As such some differences between local authorities should be treated with caution, as these might reflect sampling variation rather than real changes.
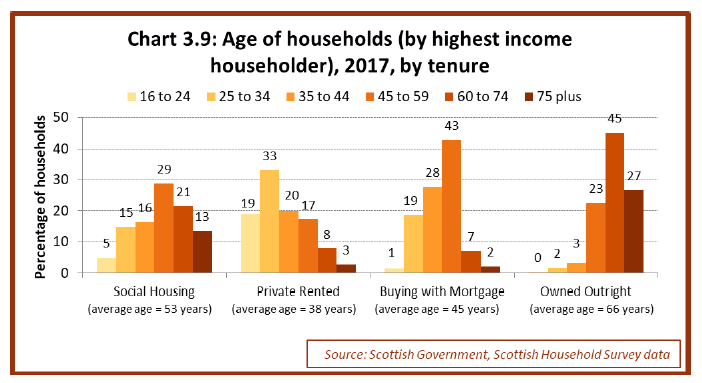
Chart 3.9 below shows how the age profile of social renters compared to other tenures in 2017. Private rented households were more likely to contain a highest income householder aged 16 to 24 years (19%) or 25 to 34 years (33%) compared to other tenures. Households buying with a mortgage were more likely to contain a highest income householder aged 35 to 44 years (28%) or 45 to 59 years (43%) than other tenures; and households owned outright were more likely to contain a highest income householder aged 60 to 74 years (45%) or 75 years and over (27%).
Chart 3.9: Age of households (by highest income householder), 2017, by tenure
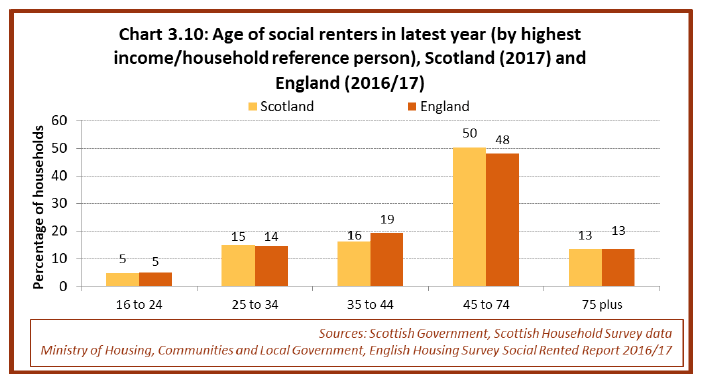
The age profile of social renters in Scotland in 2017 appears to be broadly similar to the age profile of social renters in England, as measured by the MHCLG English Housing Survey for 2016/17 (see Chart 3.10 below). However note that there could be some differences between the two respective surveys in how the highest income/household reference people are identified within families, which may impact on the comparison.
Chart 3.10: Age of social renters in latest year (by highest income/household reference person), Scotland (2017) and England (2016/17)
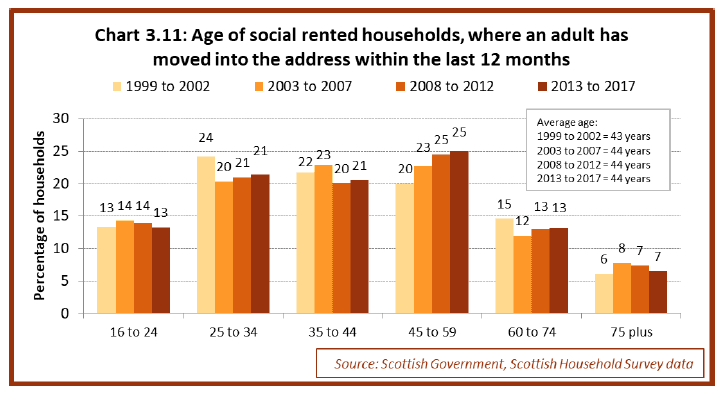
When looking solely at social rented households in which an adult has moved into the property within the last 12 months (which includes new-lets as well as changes to existing household compositions), there are higher proportions of younger aged households than compared to all social households.
For example in the latest period (2013 to 2017), 13% of social rented households with an adult moving into that address in the last 12 months were in the 16 to 24 age group and 21% were in the 25 to 34 age group, which compares to 5% and 15% of all social rented households, respectively.
This would suggest that newly formed social households are more likely to contain younger households than more established social rented households.
Chart 3.11: Age of social rented households, where an adult has moved into the address within the last 12 months
3.3 Gender
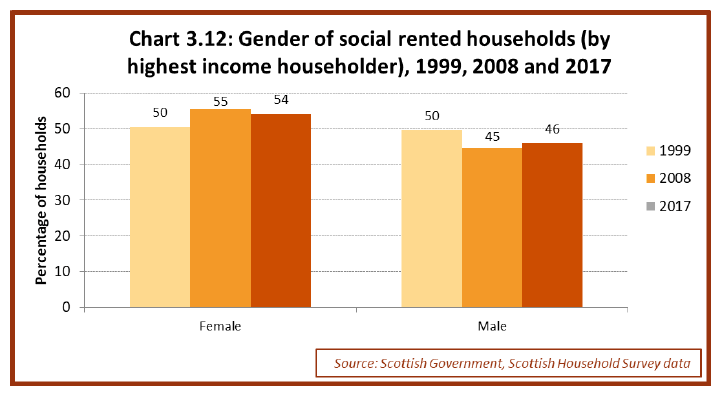
The proportion of social rented households with a female highest income householder increased from 50% in 1999 to 55% in 2008, and remained at a similar level of 54% in 2017.
Chart 3.12: Gender of social rented households (by highest income householder), 1999, 2008 and 2017
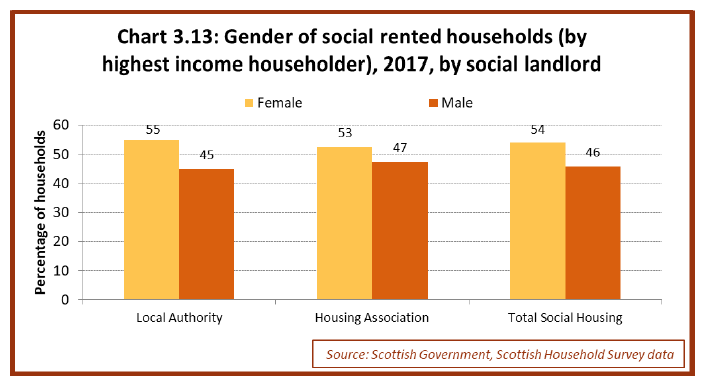
Local authority and housing association households had similar proportions of female highest income householder in 2017 (55% and 53% respectively).
Chart 3.13: Gender of social rented households (by highest income householder), 2017, by social landlord
A local authority breakdown based on responses to the Scottish Household Survey between 2013 and 2017 is provided in Chart 3.14 below. The percentage of social rented households with a female highest income householder ranged from 48% Argyll & Bute and 49% in Shetland to 61% in Renfrewshire and 62% in Stirling.
Chart 3.14: Gender of social rented households (by highest income householder), 2013 to 2017, by local authority
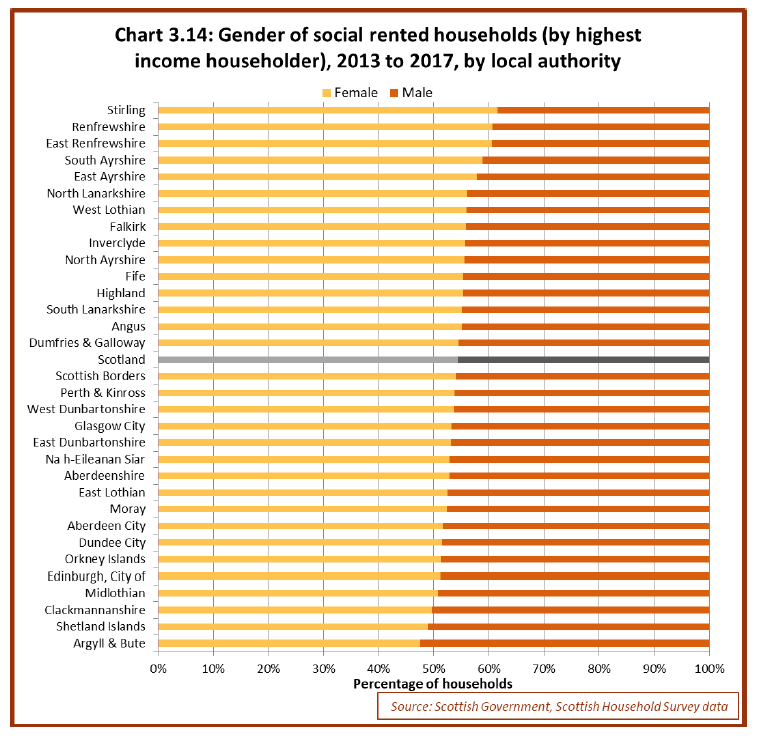
Note: survey data from the five years from 2013 to 2017 has been combined together to provide a sufficient sample size to allow a local authority level analysis. However local authority sample sizes across these four years vary from 140 in East Renfrewshire up to 1,670 in Glasgow City, and so there will be larger margins of error for some local authorities than others. As such some differences between local authorities should be treated with caution, as these might reflect sampling variation rather than real changes.
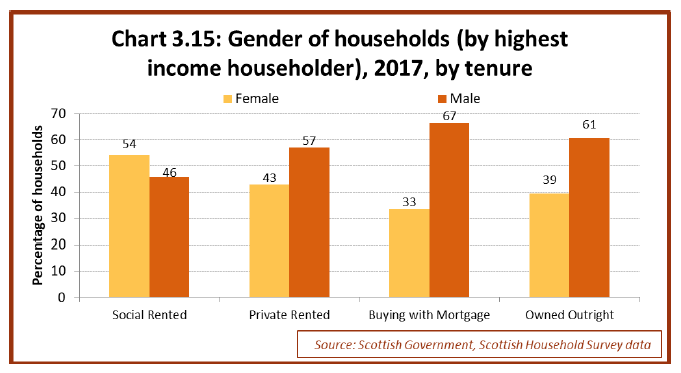
Social rented households in Scotland in 2017 had a higher proportion of female highest income householders (54%) than private rented households (43%), households with the property bought with a mortgage (33%) and households where the property was owned outright (39%).
Chart 3.15: Gender of households (by highest income householder), 2017, by tenure
Results from the MHCLG English Housing Survey for 2016/17 indicate that England had a slightly higher percentage of females within social rented households, with 58% of social rented households having a female household reference person compared to 54% female highest income householders in Scotland in 2017. Note however that there may be some differences between the how the highest income/household reference people have been identified within families in the two surveys, which may impact on any comparisons.
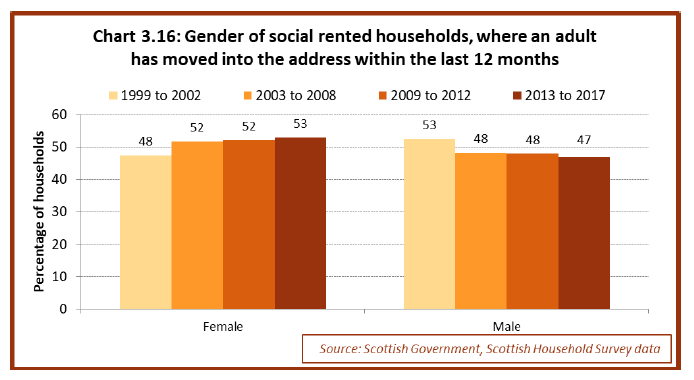
When looking solely at social rented households in Scotland in which an adult has moved into the address within the last 12 months (which includes new-lets as well as changes to existing household compositions), there has been an increasing proportion of female highest income householders moving into social rented housing addresses from 1999 to 2002 (48%) to 2013 to 2017 (53%), which broadly follows the same increase seen in all social rented households (50% in 1999 to 54% in 2017).
Chart 3.16: Gender of social rented households, where an adult has moved into the address within the last 12 months
3.4 Economic status of adults - Scottish Household Survey data
The Scottish Household survey collects information on the economic status of adults within households. Based on the categories defined by the survey, the most common types of economic status of adults within social rented housing in 2017 were employed full time (24%) and retired from work (25%).
However there has been some changes in these percentages over time, with the percentage of adults in social rented housing employed full time having increased from 19% in 1999 to 24% in 2017. The percentage of adults in social rented housing who were retired from work has fallen from 29% in 1999 to 25% in 2017.
In 2017, 12% of adults in social rented housing were permanently sick or disabled and 9% were unemployed and seeking work.
Chart 3.17: Economic Status of social renters (random adult in household), 1999, 2008 and 2017
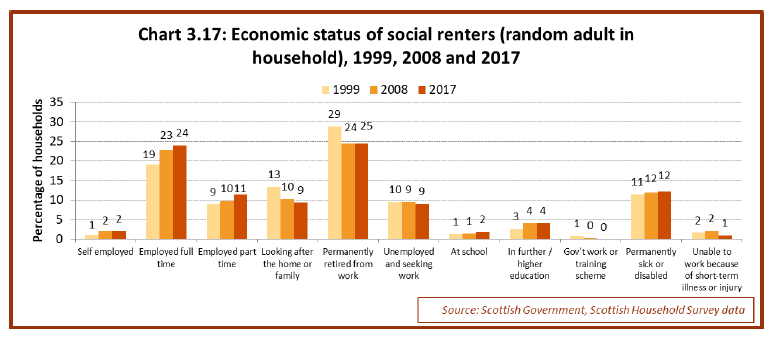
Chart 3.18 below shows that the economic status of adults was similar across local authority and housing association properties in 2017.
Chart 3.18: Economic Status of social renters (random adult in household), 2017, by social landlord
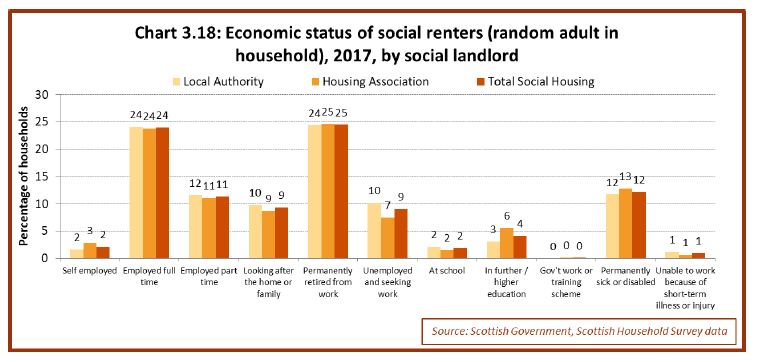
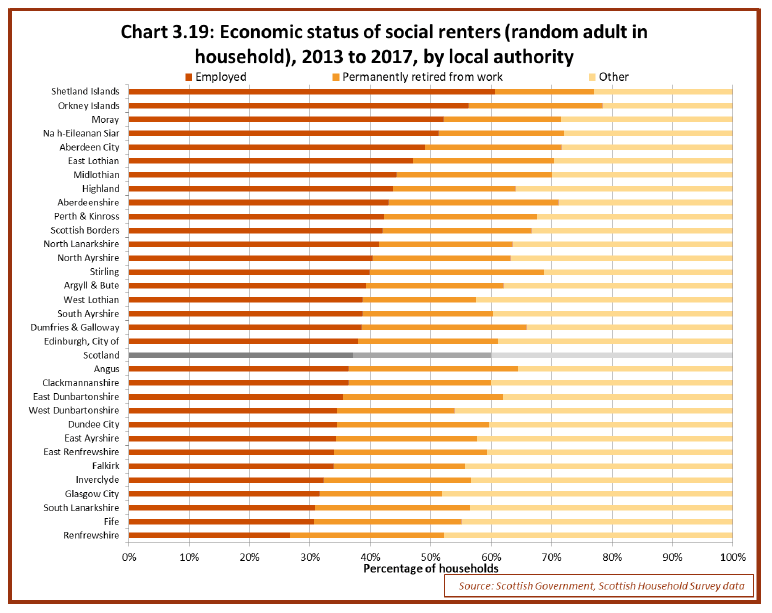
Chart 3.19 below shows the economic status of adults in social housing between 2013 and 2017 for each local authority. The percentage of social renting adults who were employed ranged from 27% in Renfrewshire and 31% in Fife and South Lanarkshire, up to 56% in the Orkney Islands and 61% in the Shetland Islands.
Chart 3.19: Economic status of social renters (random adult in household), 2013 to 2017, by local authority
Note: survey data from the five years from 2013 to 2017 has been combined together to provide a sufficient sample size to allow a local authority level analysis. However local authority sample sizes across these four years vary from 130 in East Renfrewshire up to 1,530 in Glasgow City, and so there will be larger margins of error for some local authorities than others. As such some differences between local authorities should be treated with caution, as these might reflect sampling variation rather than real changes.
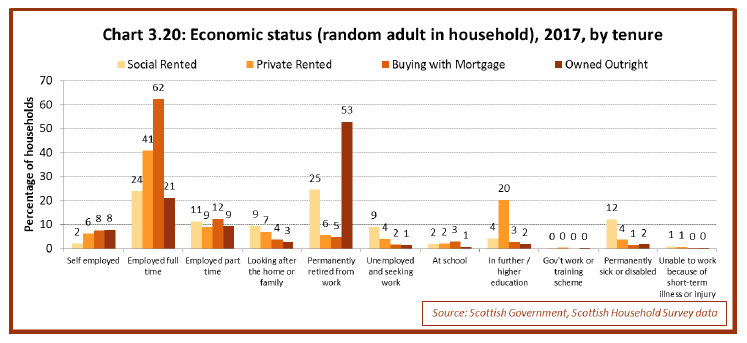
Chart 3.20 below shows the economic status of adults in social housing compared to other tenures for the year 2017. It can be seen that 62% of adults in households buying with a mortgage were employed full time, compared to 41% of adults renting privately, 24% of adults in social rented households and 21% of adults in owned outright households.
Social rented households were more likely to have an adult permanently sick or disabled (12%) in 2017 than all other tenures - private rented households (4%), households buying their property with a mortgage (1%), and households owning their property outright (2%).
Social rented households were also more likely to have an adult looking after the home or family (9%) or be unemployed and seeking work (9%) compared with households buying their property with a mortgage (4% and 2% respectively), and households owning their property outright (3% and 1% respectively).
Private rented households were more likely to have an adult in further or higher education (20%) compared to other tenures. Whilst households owned outright were more likely to have an adult permanently retired from work (53%).
Chart 3.20: Economic status of social renters (random adult in household), 2013 to 2017, by local authority
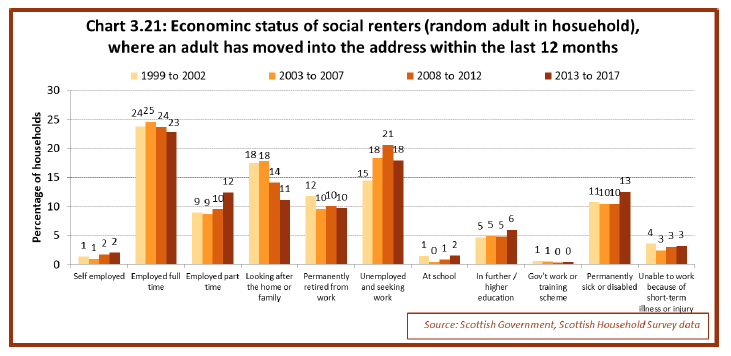
When looking solely at social rented households in which an adult had moved into the property within the last 12 months in 2013 to 2017 (which includes new-lets as well as changes to existing household compositions), 18% of adults were unemployed, a figure higher than the equivalent proportion of adults unemployed across all social rented households in 2017 (9%), which suggests that newly formed social households are more likely to contain unemployed adults than compared with more established social rented households. 10% of adults in social rented households in which an adult had moved into the property within the last 12 months in 2013 to 2017 were retired from work, a lower figure than the 25% of adults retired across all social rented households in 2017, which suggests that newly formed social households are less likely to contain retired adults than compared with more established social rented households.
Chart 3.21: Economic status of social renters (random adult in household), where an adult has moved into the address within the last 12 months
3.5 Economic status of households - Family Resources Survey data
The Family Resources Survey provides a different way of looking at the economic status of households in Scotland based on a categorisation of the family unit into working or workless categories, and it also allows a comparison of figures to households in England and Wales.
Chart 3.22 below shows the economic status profile for households in local authority, housing association and private rented sector households over the period 2015/16 to 2017/18. The "workless, other inactive" category includes the long-term sick, disabled, and non-working single parents[20].
It can be seen that the household economic status profile is broadly similar between local authority and housing association households.
The most common economic status categories for social rented households over the period 2015/16 to 2017/18 were "workless, head of spouse aged 60 or over" (32%) and "workless, other inactive" (21%). Over a third (35%) of households in the private rented sector contained adults who were all in full time work (either a single adult household or a couple household), compared to 17% of households in social rented accommodation.
Chart 3.22: Economic status of rented households in Scotland, 2015/16 to 2017/18
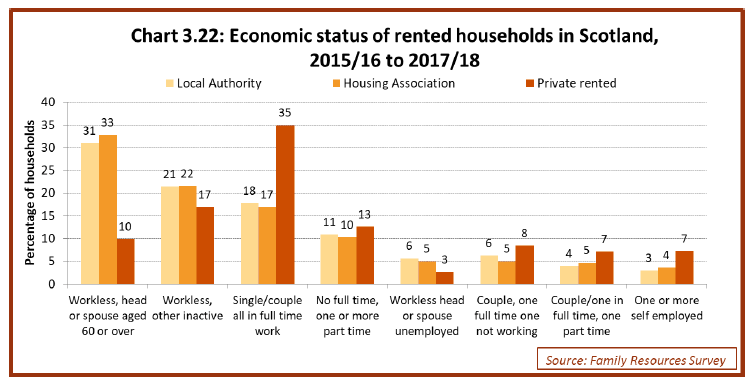
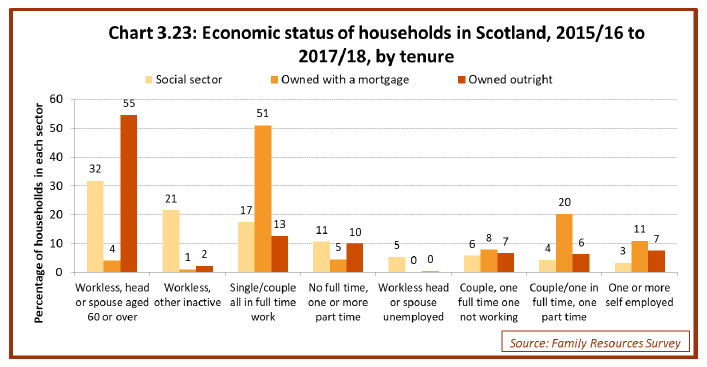
Chart 3.23 below shows the economic status profile of households in the social sector in Scotland in 2015/16 to 2017/18 compared to households that were owned with a mortgage or owned outright.
The main economic status within the social sector was "workless, with a head of house or spouse aged 60 or over", with almost a third (32%) of social rented households being in this category. This compares to 55% of households that were owned outright being in this older-aged economic category. The chart also suggests that the social sector includes a broader range of economic statuses than households that are owned outright, reflecting the diverse age bands seen in the social sector (see Section 3.2).
The "workless, other inactive" group accounted for over a fifth (21%) of social sector households, compared to 2% of households that were owned outright and 1% that were owned with a mortgage.
Chart 3.23: Economic status of households in Scotland, 2015/16 to 2017/18, by tenure
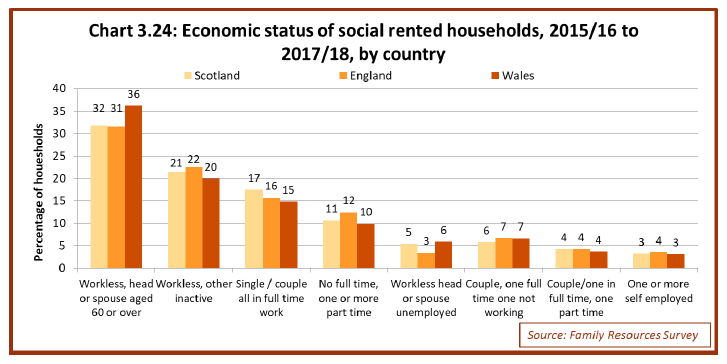
The percentage of social rented households in each economic category, for the other GB countries is shown in Chart 3.24. Proportions were broadly similar for each country across each category.
Chart 3.24: Economic status of social rented households, 2015/16 to 2017/18, by country
3.6 Ethnicity
The Scottish Household Survey asks respondents about their ethnicity. This question has been asked in its current form since 2013.
In the period 2013 to 2017, 86% of adults in social rented households stated they were 'White Scottish', 6% of adults stated they were 'White Other British', 3% said they were 'White Polish', 2% stated they were 'White Other', 1% said they were 'Asian, Asian Scottish or Asian British', 1% said they were 'African, Caribbean or Black', and 1% said they were another ethnic group.
Chart 3.25: Ethnicity of adults in social rented households, 2013 to 2017, by social landord
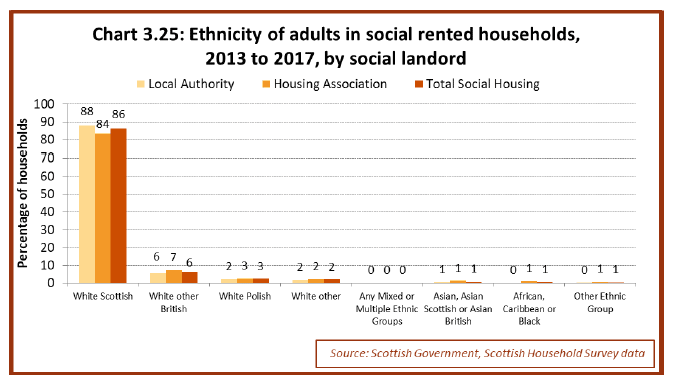
It can be seen that local authority rented households had a higher percentage of 'White Scottish' adults (88%) compared with housing association rented households (84%).
Chart 3.26 below shows the ethnicity of adults in social rented housing between 2013 and 2017 in each local authority. The proportion of social renting adults identifying as 'White Scottish' ranged from 74% in Aberdeen City, and 75% in the Shetland Islands and Orkney Islands, up to 94% in South Ayrshire, East Dunbartonshire and West Dunbartonshire and 97% in Inverclyde. Authorities with the highest proportions of social renting adults identifying as 'White Other British' were Na h-Eileanan Siar and Moray (17%), and the Orkney Islands (23%). Authorities with the highest proportions of adults identifying as 'White Other' (i.e. White but not Scottish or British) included City of Edinburgh (10%) and Aberdeen City (15%), whilst authorities with the highest proportions of adults identifying as other ethnic groups included Aberdeen City (6%), City of Edinburgh (6%) and Glasgow City (7%).
Chart 3.26: Ethnicity of social renters (random adult in household), 2013 to 2017, by local authority
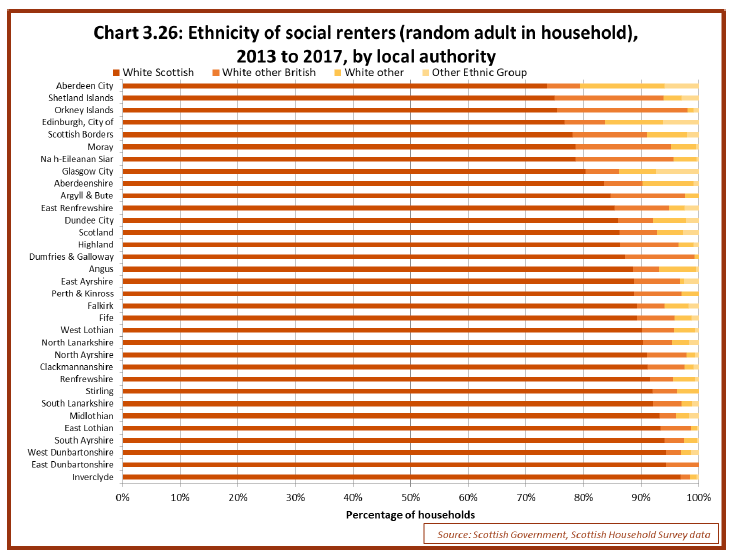
Note: survey data from the four years from 2013 to 2017 has been combined together to provide a sufficient sample size to allow a local authority level analysis. However local authority sample sizes across these four years vary from 130 in East Renfrewshire up to 1,530 in Glasgow City, and so there will be larger margins of error for some local authorities than others. As such some differences between local authorities should be treated with caution, as these might reflect sampling variation rather than real changes.
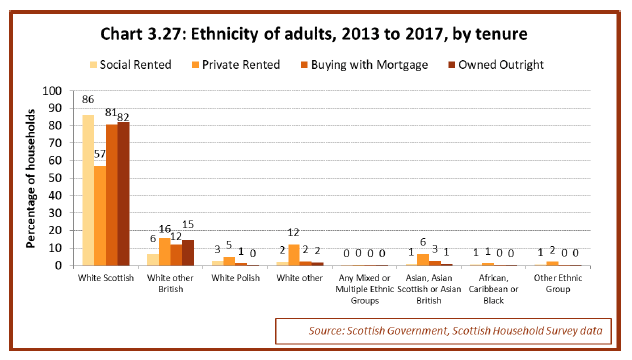
Chart 3.27 below shows how the ethnicity of adults in social rented households in 2013 to 2017 compared to other tenures. Social rented households had the highest proportion of 'White Scottish' adults at 86%, a higher percentage figure to the equivalent figures for adults privately renting (57%), buying with a mortgage (81%) and adults in households owned outright (82%). Social rented households had the lowest proportion of 'White Other British' adults (6%), compared to private rented (16%), buying with a mortgage (12%) or owned outright tenures (15%).
Chart 3.27: Ethnicity of adults, 2013 to 2017, by tenure
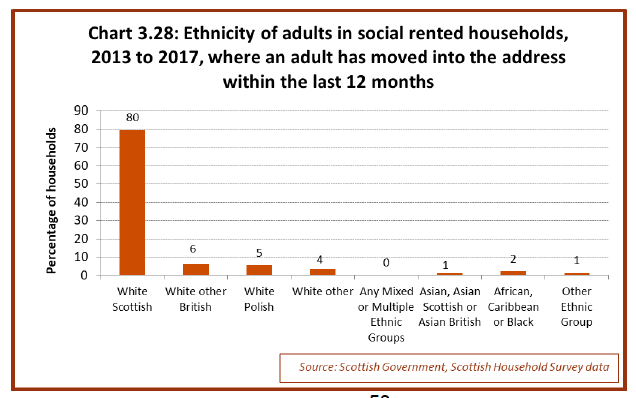
When looking solely at social rented households in which an adult had moved into the property within the last 12 months between 2013 and 2017 (which includes new-lets as well as changes to existing household compositions), 80% of adults stated that they were 'White Scottish'. This was lower than the equivalent figure for all social rented households (86%), and suggests that newly formed social rented households are more likely to contain adults who are not 'White Scottish' compared with more established social rented households.
Chart 3.28: Ethnicity of adults in social rented households, 2013 to 2017, where an adult has moved into the address within the last 12 months
3.7 Country of birth[21]
The Scottish Household Survey also asks respondents about their country of birth, and this question has been asked in its current form since 2013.
In the period from 2013 to 2017, 87% of adults in social rented households were born in Scotland, 5% of adults stated that they were born in England, 4% said they were born in the EU (excluding UK and Ireland), and 3% said they were born in the Rest of the World (i.e. outside Europe).
Chart 3.29: Country of Birth of adults in social rented households, 2013 to 2017, by social landord
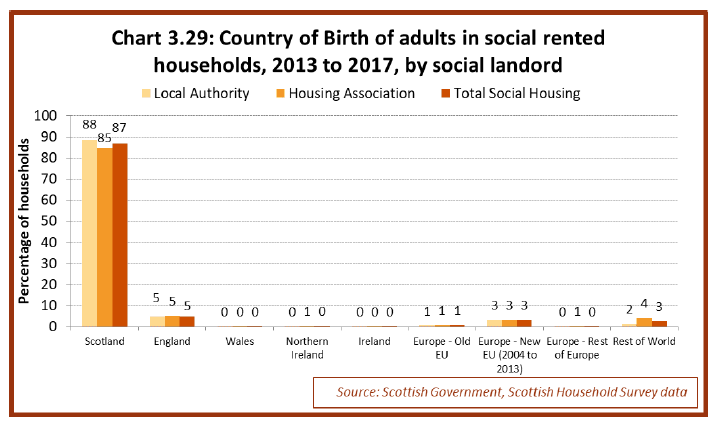
It can be seen that the percentages are similar between local authority and housing association households for each country of birth category, however housing association households had a slightly lower proportion of adults born in Scotland (85%) compared with local authority households (88%), and have a slightly higher percentage of adults born in the Rest of the World (i.e. outside Europe) (4%) than with local authority households (2%).
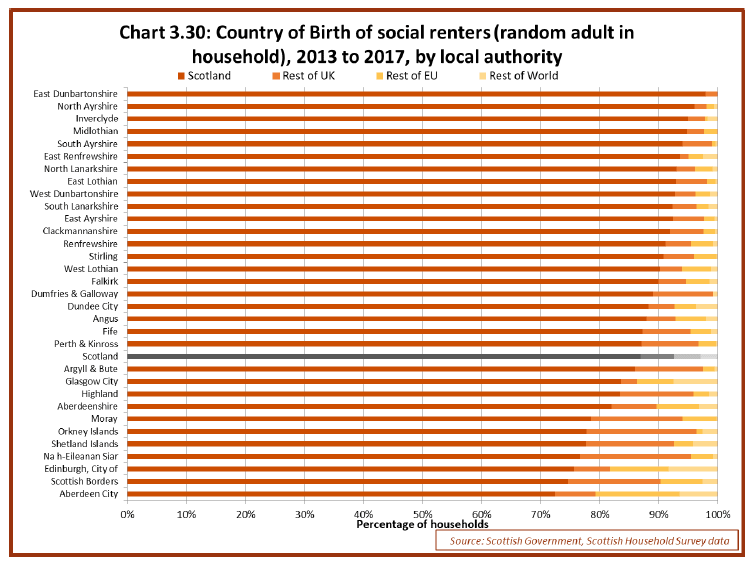
Chart 3.30 below shows the country of birth of adults in social rented housing between 2013 and 2017 in each local authority. The percentage of adults who were born in Scotland ranged from 72% in Aberdeen City to 98% in East Dunbartonshire. This compared to 87% across Scotland as a whole.
Chart 3.30: Country of Birth of social renters (random adult in household), 2013 to 2017, by local authority
Note: survey data from the four years from 2013 to 2017 has been combined together to provide a sufficient sample size to allow a local authority level analysis. However local authority sample sizes across these four years vary from 130 in East Renfrewshire up to 1,530 in Glasgow City, and so there will be larger margins of error for some local authorities than others. As such some differences between local authorities should be treated with caution, as these might reflect sampling variation rather than real changes.
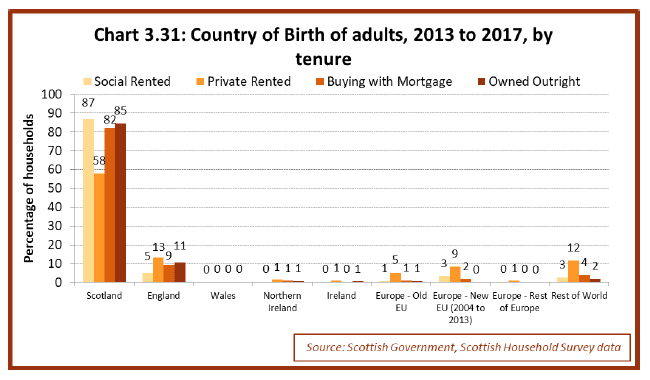
Chart 3.31 below shows how the country of birth of adults in social rented households in 2013 to 2017 compares to other tenures. Social rented households had 87% of adults born in Scotland, a higher percentage to adults in households privately renting (58%), buying with a mortgage (82%) and owned outright (85%). Social rented households also had a lower proportion of adults born in England (5%) when compared to households renting privately (13%), buying with a mortgage (9%) and owned outright (11%).
Private rented households had a much smaller proportion of adults born in Scotland (58%) when compared to other tenure categories. Within private rented households, 13% of adults were born in England, 12% were born in the Rest of the World (i.e. outside Europe), 9% were born in the New EU (2004 to 2013), and 5% were born in the Old EU.
Chart 3.31: Country of Birth of adults, 2013 to 2017, by tenure
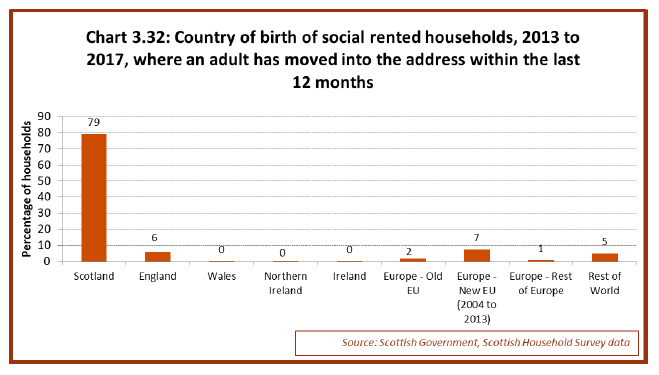
When looking solely at social rented households in which an adult has moved into the property within the last 12 months between 2013 and 2017 (which includes new-lets as well as changes to existing household compositions), 79% of adults were born in Scotland and 7% of adults were born in the New EU (2004 to 2013). These figures differ to the equivalent proportions for all social rented households in the latest year (87% and 3% respectively), and suggest that newly formed social households are more likely to contain adults born in the New EU than established social households.
Chart 3.32: Country of birth of social rented households, 2013 to 2017, where an adult has moved into the address within the last 12 months
3.8 Religion
The Scottish Household Survey asks a random adult in each household about their religion. This question has been asked in its current form since 2009.
Chart 3.33: Religion of social rented households (random adult in household), 2009 to 2012 and 2013 to 2017
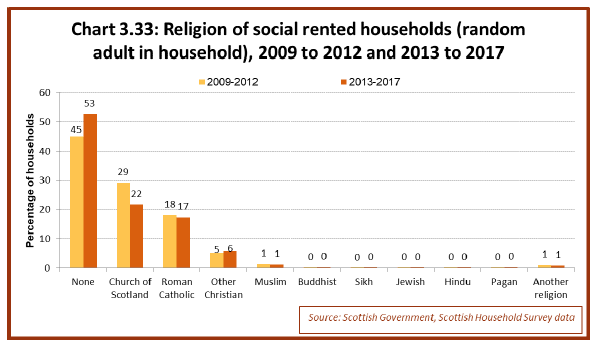
In the period from 2013 to 2017, 53% of adults in social rented housing said they had no religion, which is an increase on the 45% between 2009 and 2012. Most of the other religion categories stayed at similar levels between the two time periods, other than Church of Scotland which decreased from 29% to 22%.
Chart 3.34 below shows how religion varies between local authority and housing association households. Most religions show similar percentages between the two types of social landlords, however there are more adults with no religion in local authority housing (55% compared to 49% in housing association housing), and more adults with a Roman Catholic religion (20%) in housing association housing than local authority housing (15%).
Chart 3.34: Religion of social rented household (random adult in household), 2013 to 2017, by social landlord
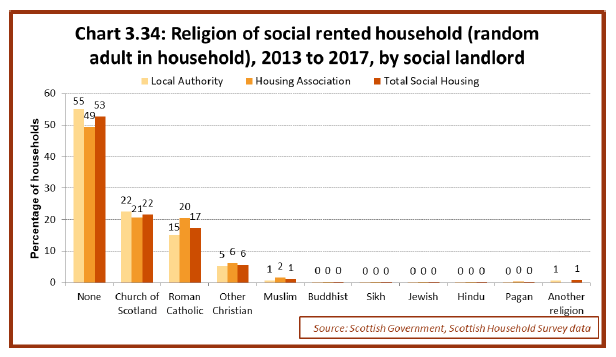
Chart 3.35 below shows the religion of adults in social rented households by local authority. The percentage who said they had no religion varies from 29% in Inverclyde to 76% in the Orkney Islands, which compares to the Scotland figure of 52%. Glasgow and surrounding areas had the highest proportions of adults with a Roman Catholic religion, including Inverclyde (41%), Glasgow City (31%), and West Dunbartonshire, East Renfrewshire and North Lanarkshire (all 30%). Na h-Eileanan Siar had the highest proportion of social renter adults with a 'Other Christian' religion (23%).
Chart 3.35: Religion of social renters (random adult in household), 2013 to 2017, by local authority
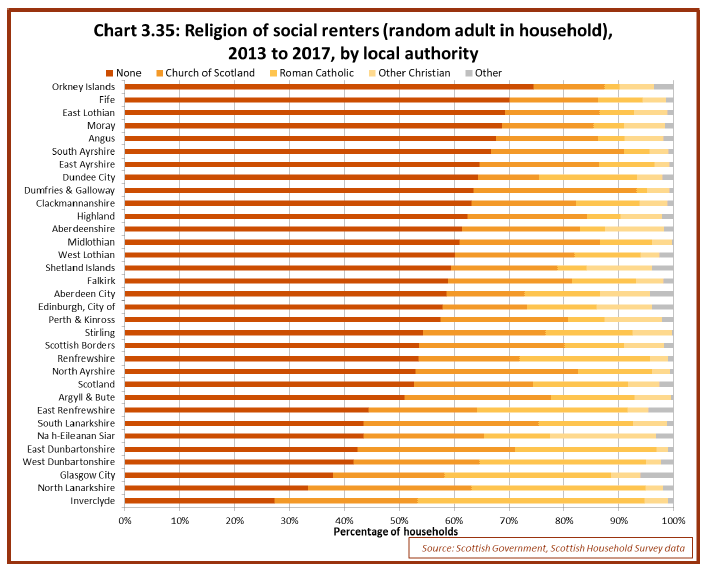
Note: survey data from the four years from 2013 to 2017 has been combined together to provide a sufficient sample size to allow a local authority level analysis. However local authority sample sizes across these four years vary from 130 in East Renfrewshire up to 1,530 in Glasgow City, and so there will be larger margins of error for some local authorities than others, and as such some differences between local authorities should be treated with caution, as these might reflect sampling variation rather than real changes.
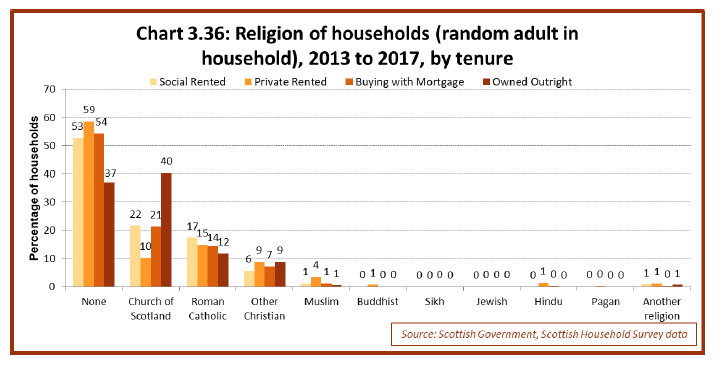
Households owned outright have a much higher proportion of households who are Church of Scotland Christian (40%, compared to 22% in social rented, 21% in buying with a mortgage and 11% in private rented households). This may have some relation to the age of households because, as seen in Section 3.2, households which own outright are older on average.
Chart 3.36: Religion of households (random adult in household), 2013 to 2017, by tenure
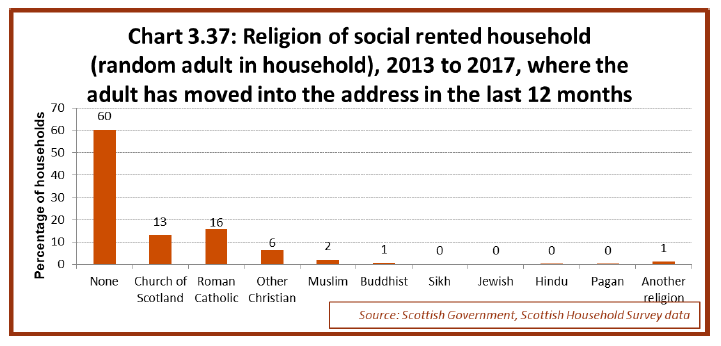
When looking solely at social rented households in which an adult has moved into the property within the last 12 months between 2013 and 2017 (which includes new-lets as well as changes to existing household compositions), 60% of adults reported having no religion and 13% were Church of Scotland Christians. These figures differ to the equivalent proportions for all social rented households in the same time period (53% and 22%, respectively), and suggest that newly formed social households are more likely to contain adults who have no religion than established social households.
Chart 3.37: Religion of social rented household (random adult in household), 2013 to 2017, where the adult moved into the address in the last 12 months
3.9 Sexual Orientation
The Scottish Survey Core Questions (SSCQ)[22] uses pooled survey responses from identical questions in the Scottish Household Survey, the Scottish Crime and Justice Survey, and the Scottish Health Survey. The pooling of datasets results in a combined dataset with a sample size of over 20,000 respondents, which allows for more powerful and detailed statistical analysis than is possible with individual survey datasets. The SSCQ has included a question on self-reported sexual orientation each year between 2012 and 2017.
When looking at these findings, it is important to consider that figures could under-report the proportion of lesbian, gay, bisexual or other (LGBO) people, for example because of uncertainty about one's sexual orientation, or reluctance to be open about sexual orientation with an interviewer. More information about issues to consider when looking at the data is contained in the "Summary of the Evidence Base on Sexual Orientation".[23]
Chart 3.38 below shows the percentages of adults that identified as heterosexual for each tenure and each year between 2012 and 2017. In 2017, 94% of adults in social rented households identified as heterosexual, which was lower than the percentage seen in 2012 (96%). There has also been a drop in adults in private rented properties identifying as heterosexual, from 95% to 92%, however these differences are only marginally statistically significant. For owned outright and mortgaged properties, figures have been similar across each of the years, i.e. any small changes seen between 2012 and 2017 are not statistically significant.
Chart 3.38: Proportions of adults identifying as heterosexual, 2012 to 2015, by tenure
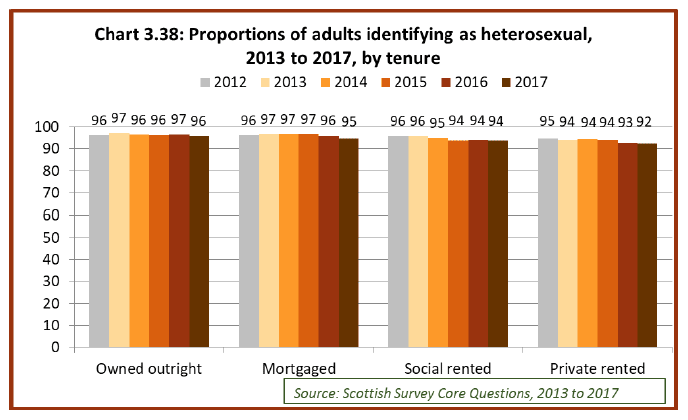
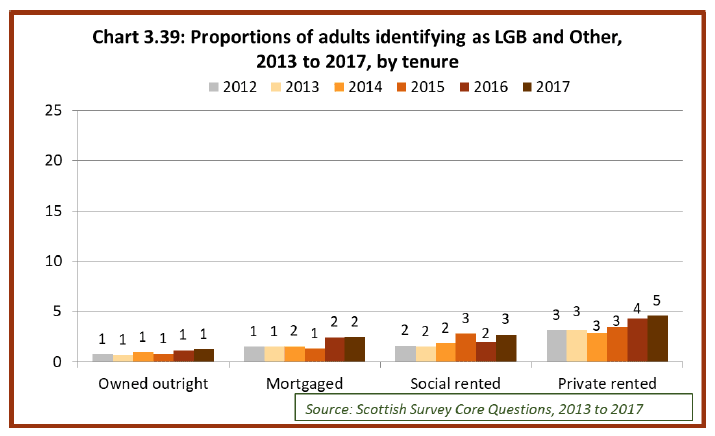
Chart 3.39 below shows the percentages of adults that identified as LGB and Other for each tenure and each year between 2012 and 2017. In 2017, 3% of adults in social rented households identified as LGB and Other, a slight increase on 2012 (2%). The percentage of private rented sector adults identifying as LGB and Other has also increased from 3% in 2012 to 5% in 2017, however these differences are only marginally statistically significant.
Chart 3.39: Proportions of adults identifying as LGB and Other, 2012 to 2015, by tenure
It is likely that some of the differences in sexual orientation across tenures may be linked to age, as evidence shows that people owning their home outright are more likely to be older than people living in social rented households and other tenures (Chart 3.8) in this publication), and that older people are more likely to identify as heterosexual[24], than younger people.
The figures presented across Chart 3.38 and Chart 3.39 do not add up to 100% because of some refused / not specified responses to this question.
3.10 Disability
The Scottish Household Survey asks respondents about their disability in terms of whether they have a physical or mental health condition or illness lasting or expected to last 12 months or more. This question has been asked in its current form since 2013.
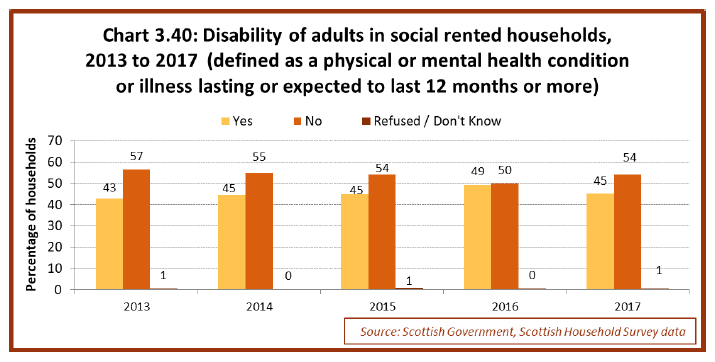
In 2017, 45% of adults in social rented housing stated that they had a disability on this basis, which is less than in the previous year (49%), though is at a similar rate to the percentages seen in years 2013 to 2017.
Chart 3.40: Disability of adults in social rented households, 2013 to 2017 (defined as a physical or mental health condition or illness lasting or expected to last 12 months or more)
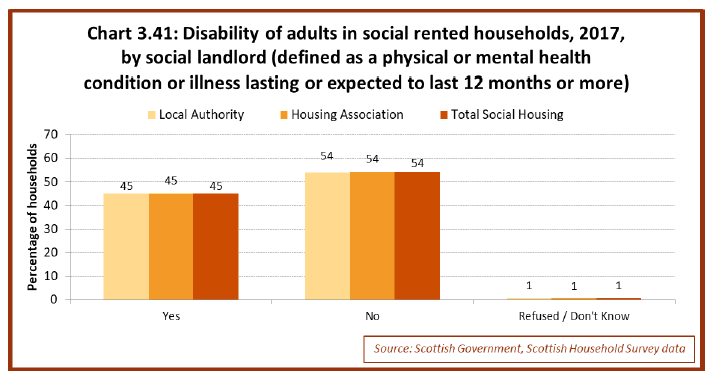
There were a similar percentage of housing association respondents indicating a disability in 2017, with 45% of adults in both local authority properties and housing association properties reporting a disability.
Chart 3.41: Disability of adults in social rented households, 2017, by social landlord (defined as a physical or mental health condition or illness lasting or expected to last 12 months or more)
The proportion of adults in social rented households who reported having a disability between 2013 and 2017 differs between local authorities, from 36% in Orkney up to 51% in Dundee City and Perth and Kinross. This compares to 45% for adults in social rented households in Scotland as a whole.
Chart 3.42: Disability of adults in social rented households, 2013 to 2017, by local authority (defined as a physical or mental health condition or illness lasting or expected to last 12 months or more)
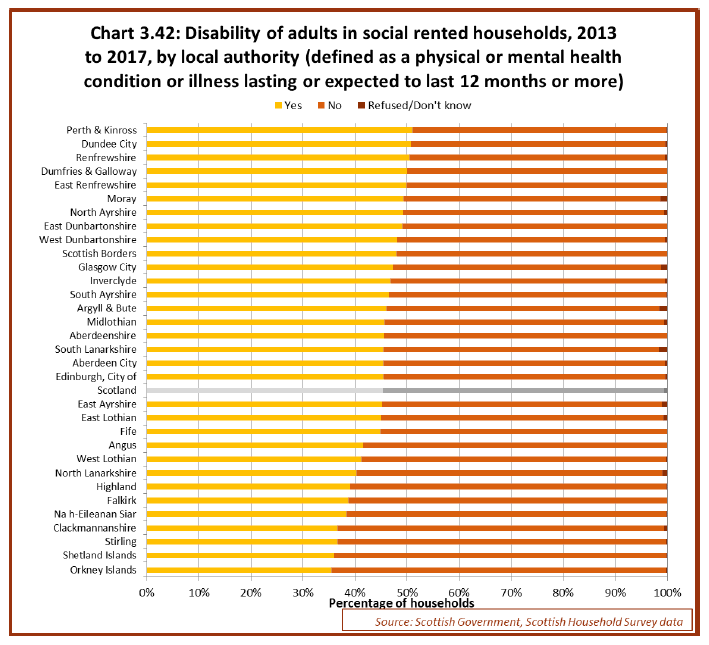
Note: survey data from the four years from 2013 to 2017 has been combined together to provide a sufficient sample size to allow a local authority level analysis. However local authority sample sizes across these four years vary from 130 in East Renfrewshire up to 1,530 in Glasgow City, and so there will be larger margins of error for some local authorities than others. As such some differences between local authorities should be treated with caution, as these might reflect sampling variation rather than real changes.
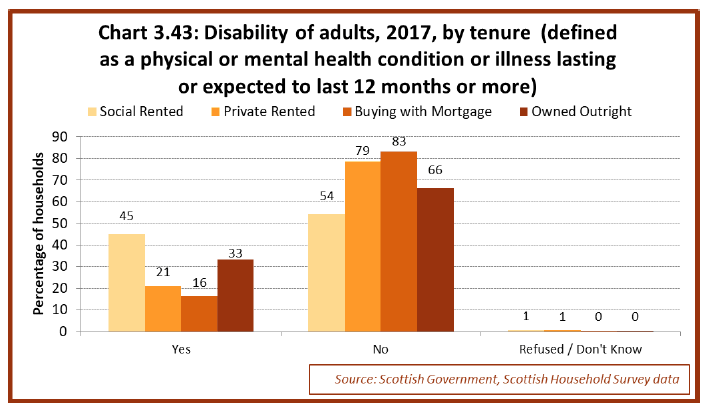
In 2017, 45% of adults in social rented housing reported having a disability, a figure much higher than the proportion of adults with a disability in private rented accommodation (21%) and adults buying with a mortgage (16%), and also higher than the equivalent figure for adults living in owned outright properties (33%).
Chart 3.43: Disability of adults, 2017, by tenure (defined as a physical or mental health condition or illness lasting or expected to last 12 months or more)
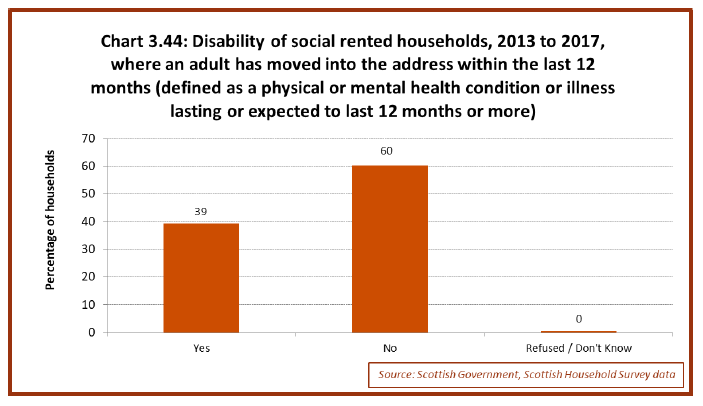
When looking solely at social rented households in which an adult had moved into the property within the last 12 months (which includes new-lets as well as changes to existing household compositions), there was a lower proportion of adults recording a disability (39%) than compared with the entire social rented sector (45%). This may possibly reflect a younger cohort of households entering social housing compared to established social rented households, given that age is likely to be correlated to some extent with disability and health.
Chart 3.44: Disability of social rented households, 2013 to 2017, where an adult has moved into the address within the last 12 months
3.11 Overcrowding and under-occupation
Information on whether households are overcrowded or under-occupied is reported through the Scottish House Condition Survey which is based on a module of the Scottish Household Survey.
The survey assesses a dwelling to be overcrowded or under-occupied by using the "bedroom standard" as defined in the Housing (Overcrowding) Bill[25], which takes into account the number of bedrooms available in the dwelling and the type of the household that occupies it. Some landlords in the social sector may use different definitions of overcrowding, when allocating or managing their housing. This means that the bedroom standard does not necessarily reflect the policies that are applied in practice by social landlords. The bedroom standard provides an objective and consistent measurement of overcrowding which may sometimes differ from subjective measures, for example people who live in houses that are classed as overcrowded may not necessarily perceive there to be a shortage of space.
The bedroom standard is defined in the Housing (Overcrowding) Bill based on the number of bedrooms in a dwelling and the people in a household who can share a bedroom. Under the bedroom standard, each of the following groups or individuals requires a separate bedroom:
- Any couple;
- a person aged 21 years or more;
- two people of the same sex aged between 10 and 20;
- two children (whether of the same sex or not) under 10 years;
- two people of the same sex where one person is aged between 10 years and 20 years and the other is aged less than 10 years;
- any further person who cannot be paired appropriately.
Note that the bedroom standard does not take account of rooms with a floor area of less than 50 square feet, or rooms that are not normally used as a bedroom. This means that households living in dwellings with these characteristics would be considered overcrowded under the bedroom standard.
Requirements for bedrooms under the bedroom standard should not be confused with criteria for the removal of the spare room subsidy. Applying the rules of the spare room subsidy is not possible based on the information collected in the Scottish House Condition Survey Module.
Note that in the analysis for this section, rent-free households have been assigned to the private rented sector. This differs from Scottish House Condition Survey (SHCS) reporting, where these households are allocated to local authority and housing association categories in addition to the private rented sector. As such, some figures in Charts 3.45, 3.46, 3.47 and 3.48 may differ slightly from the published results of the SHCS.
Chart 3.45 below shows the profile of overcrowding and under-occupancy by tenure for the year 2017.
Around 5% of local authority households were overcrowded and 3% of housing association properties were overcrowded, which were broadly similar to the percentages for private rented households (5%), households owned with a mortgage (2%), and households owned outright (1%).
42% of local authority and 38% of housing association households in Scotland were under-occupied, meaning that they had at least 1 more room than the minimum requirement under the bedroom standard., lower than the equivalent proportions for the private rented sector (50%), households bought with a mortgage (73%), and households that were owned outright (88%).
Chart 3.45: Bedroom standards of households, 2017, by tenure
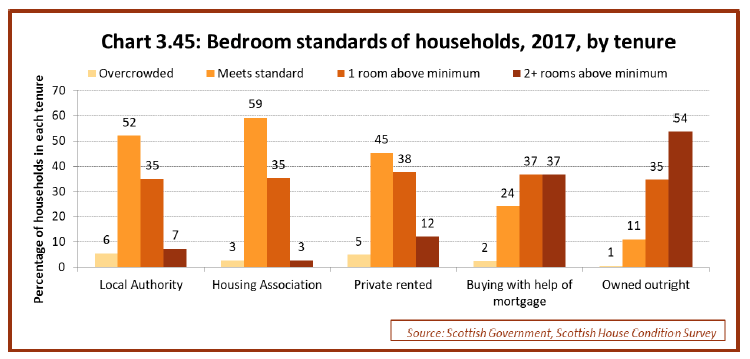
Chart 3.46 below shows the percentage of households that were overcrowded for new social tenants (i.e. where one of the residents had moved into the house in the past year), along with the private sector and owner occupiers. Samples over the 5 year period from 2013 to 2017 have been used for the purposes of statistical reliability. There is some evidence to suggest that new social sector households were more likely to be overcrowded than households where all adults had lived at the address for more than 1 year. An estimated 7% of social sector households where an adult had moved in the past year were overcrowded, compared with 4% of households where an adult had not moved to the address in the past year; however this difference is only marginally significant.
Chart 3.46: Social rented households overcrowded under the bedroom standard, 2013 to 2017 by length of time at address
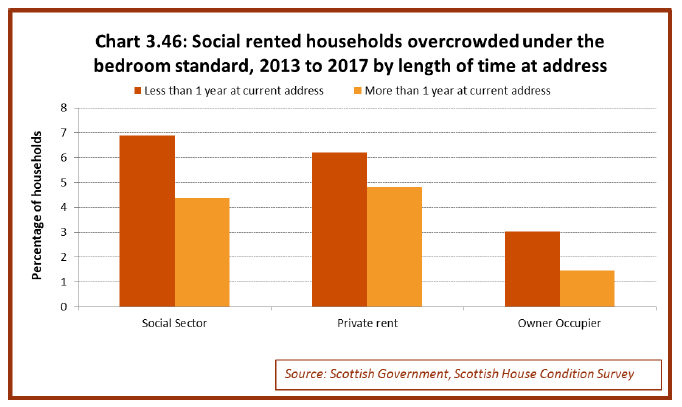
Chart 3.47 below shows that overcrowding in social rented housing sector was more common amongst large family[26] households (32% overcrowded) than other household types.
Chart 3.47: Social rented households overcrowded under the bedroom standard, 2013 to 2017, by household type
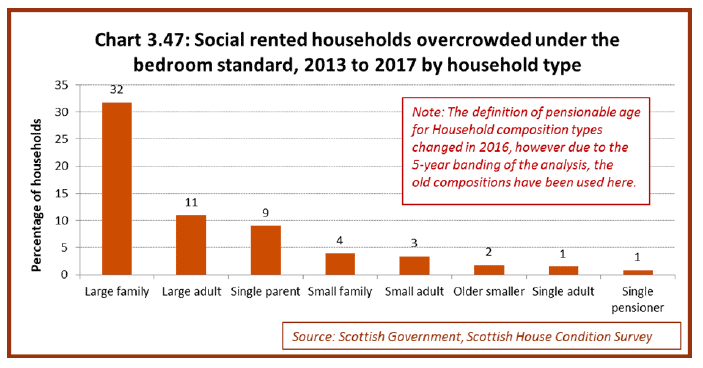
See the box in Section 3.1 for an explanation of the different household type groups.
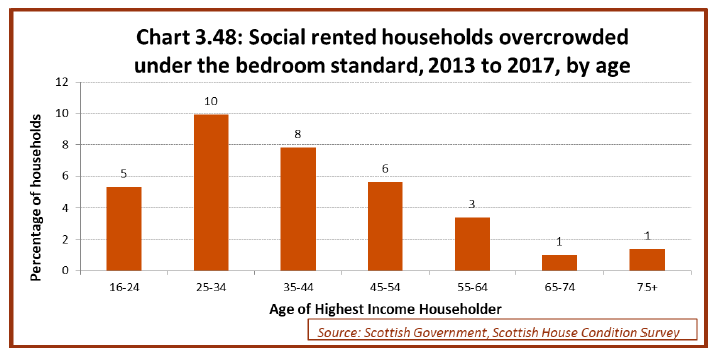
Chart 3.48 below shows that, in the social sector, the proportion of overcrowded households was higher when the highest income householder was aged 25-34 (10%) than if they were 55-64 (3%), 65-74 (1%), or 75+ (1%). There was insufficient evidence to say whether proportion differed to other age categories.
Chart 3.48: Social rented households overcrowded under the bedroom standard, 2013 to 2017, by age
Contact
There is a problem
Thanks for your feedback