Summary statistics for Follow- Up Leaver Destinations, No. 6: 2024 Edition
This statistical publication provides information on the follow-up destinations, nine months after the end of the school year, of 2022-23 school leavers from publicly funded secondary schools in Scotland.
2: School leaver follow-up destinations
Key Points
- 92.8 per cent of 2022-23 school leavers were in a positive follow-up destination. This is a decrease from 93.5 per cent in 2021-22.
- The gap between school leavers from the most and least deprived parts of Scotland in positive destinations widened from 7.0 percentage points in 2021-22 to 7.5 percentage points in 2022-23.
2.1 Destinations of school leavers
Percentage of school leavers in a positive follow-up destination, 2009-10 to 2022-23 [note 1]
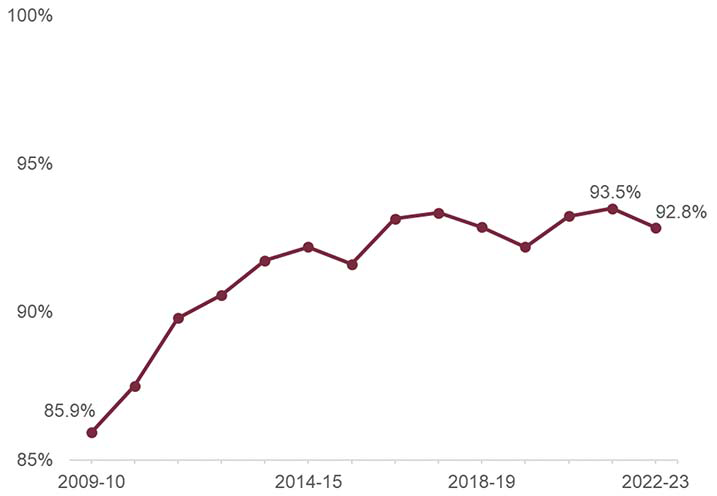
Note 1: Vertical axis starts at 85 per cent.
Chart 1 shows that 92.8 per cent of 2022-23 school leavers were in a positive follow-up destination. This was lower than for 2021-22 school leavers (93.5 per cent).
This was due to decreases in the proportion of school leavers in Higher Education and Employment. The proportion of school leavers who were Unemployed Seeking or Unemployed Not Seeking increased.
Follow-up destination of leavers, 2017-18 to 2022-23 [note 2][note 3]
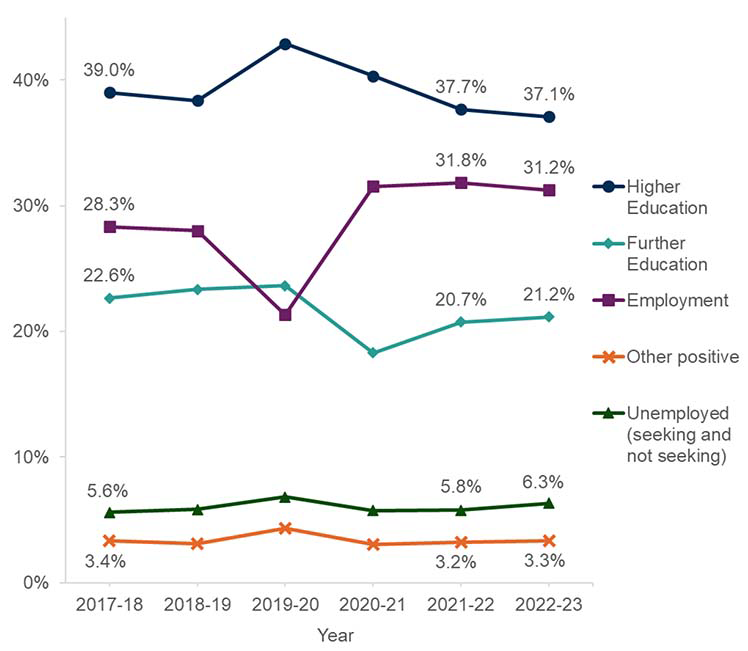
Note 2: Other positive includes Personal Skills Development, Training, Voluntary Work and, prior to 2018-19, Activity Agreements.
Note 3: The Unknown destination category is not shown in this chart.
The most common follow-up destination was Higher Education. However, the proportion of school leavers in Higher Education is at its lowest level since 2014-15.
Employment was the next most popular destination, accounting for a little under one-third of school leavers. The proportion of school leavers in Employment fell in 2022-23 compared to 2021-22 but is still one of the highest figures on record.
Around one-fifth of school leavers were in Further Education. The proportion in Further Education increased in 2022-23 compared to 2021-22.
The proportion of school leavers who were unemployed nine months after leaving school increased in 2022-23 compared to 2021-22.
A time series from 2009-10 is available in the supplementary tables.
2.2 Destinations by stage
The most common follow-up destination varied by stage.
- Most S6 leavers were in Higher Education (58.9 per cent);
- The most common follow-up destination for S5 leavers was Employment (43.7 per cent) followed by Further Education (29.9 per cent);
- The most common follow-up destination for S4 leavers was Further Education (38.7 per cent) followed by Employment (37.9 per cent).
Follow-up destination of school leavers by stage of leaving, 2022-23 [note 2][note 4][note 5]
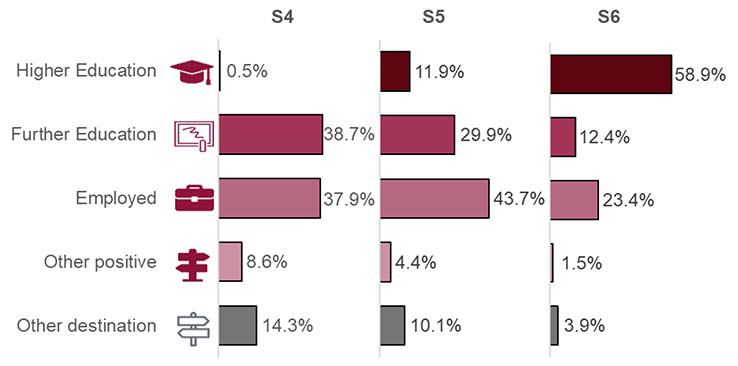
Note 2: Other positive includes Personal Skills Development, Training and Voluntary Work.
Note 4: Other destination includes Unemployed Seeking, Unemployed Not Seeking and Unknown.
Note 5: A small percentage of school leavers left in other stages not shown in this chart. For more information see tables C1.1a and C1.1b in the supplementary tables.
Pupils who leave school in S6 are the most likely to be in a positive follow-up destination. Those who leave in S4 are the least likely. In 2022-23,
- 96.1 per cent of those who left school in S6 were in a positive follow-up destination. This is up very slightly from 96.0 per cent in 2021-22.
- Among S5 leavers, 89.9 per cent were in a positive follow-up destination. This is down from 90.8 per cent in 2021-22.
- And among S4 leavers 85.7 per cent were in a positive follow-up destination. This is down from 86.9 per cent in 2021-22.
A time series from 2017-18 is available in table L1.9 in the supplementary tables.
The Summary Statistics for Attainment and Initial Leaver Destinations publication showed that there were more S4 and S5 school leavers in 2022-23 than in most earlier years. The increased number of S4 and S5 leavers and the reduced proportions of these in positive follow-up destinations helps explain the overall reduction in school leavers in a positive follow-up destination in 2022-23.
2.3 Destinations by deprivation
The proportion of school leavers in a positive follow-up destination decreased in 2022-23 compared to 2021-22 for both the most deprived and least deprived parts of Scotland. In the most deprived areas this was due to a decrease in the proportion of school leavers in Employment. In the least deprived areas it was mainly due to a decrease in the proportion in Higher Education.
The decrease in the proportion in a positive destination was bigger for school leavers from the most deprived areas than those from the least deprived areas. As a result, the gap between the two groups has widened from 7.0 percentage points in 2021-22 to 7.5 percentage points in 2022-23.
A full time series from 2009-10 is available in the supplementary tables.
Percentage of school leavers in a positive follow-up destination, by Scottish Index of Multiple Deprivation (SIMD) quintile, 2017-18 to 2022-23 [note 6][note 7][note 8][note 9]
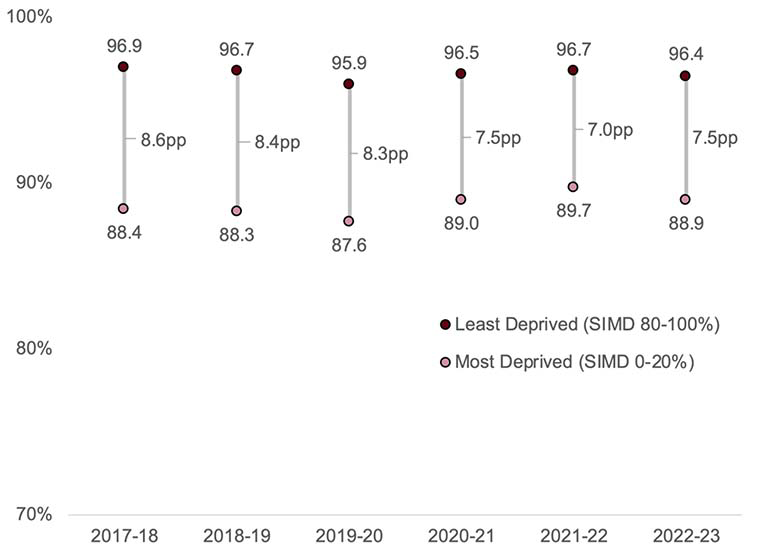
Note 6: pp = percentage point difference between the most and least deprived SIMD quintiles.
Note 7: Based on SIMD 2009 for 2009-10 and 2010-11, SIMD 2012 for 2011-12 to 2015-16, SIMD 2016 for 2016-17 to 2019-20, and SIMD 2020 for 2020-21, 2021-22 and 2022-23. More information can be found on the Scottish Index of Multiple Deprivation 2020 webpage.
Note 8: A time series from 2009-10 is available in the supplementary tables.
Note 9: Vertical axis starts at 70 per cent.
Follow-up destination of school leavers from most deprived and least deprived areas of Scotland, 2022-23 [note 2]
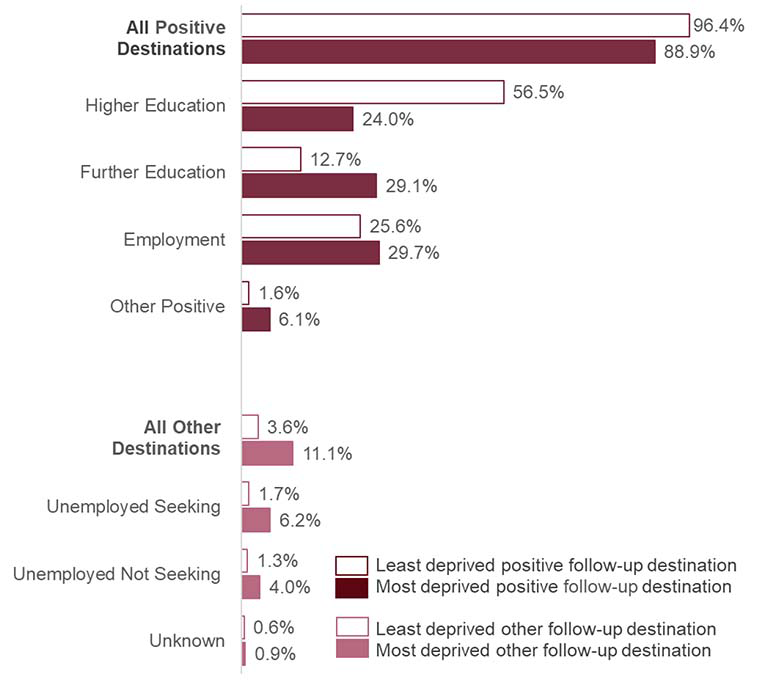
Note 2: Other Positive includes Personal Skills Development, Training and Voluntary Work.
In 2022-23, the most common follow-up destination for leavers from the least deprived areas of Scotland was Higher Education. This was followed by Employment. These leavers were more likely to be in Higher Education than leavers from other areas. They were less likely to be in Training, Employment, Personal Skills Development or to be unemployed.
The most common destination for leavers from the most deprived areas of Scotland was Employment. This was followed by Further Education and Higher Education. These leavers were more likely to be in Further Education, Training, Personal Skills Development or to be unemployed than those from other areas. They were also less likely to be in Higher Education than leavers from other areas.
More information on destinations by deprivation is available in the supplementary tables.
2.4 Destinations by other pupil characteristics
Chart 6 shows the proportion of school leavers in a positive follow-up destination by various characteristics.
In 2022-23:
- Female school leavers were more likely to be in a positive destination than male school leavers.
- School leavers of Asian – Chinese or Asian – Indian ethnicity were more likely to be in a positive destination than other ethnic groups.
- School leavers from Remote Rural areas or Accessible Rural areas were more likely to be in a positive destination than those from other areas.
- School leavers who did not have an Additional Support Need (ASN) were more likely to be in a positive destination than those who had an ASN.
- School leavers who were not declared or assessed as disabled were more likely to be in a positive destination than those who were declared or assessed as disabled.
These patterns are similar to those for other years.
Proportion of school leavers in a positive follow-up destination by pupil characteristic, 2022-23 [note 10]
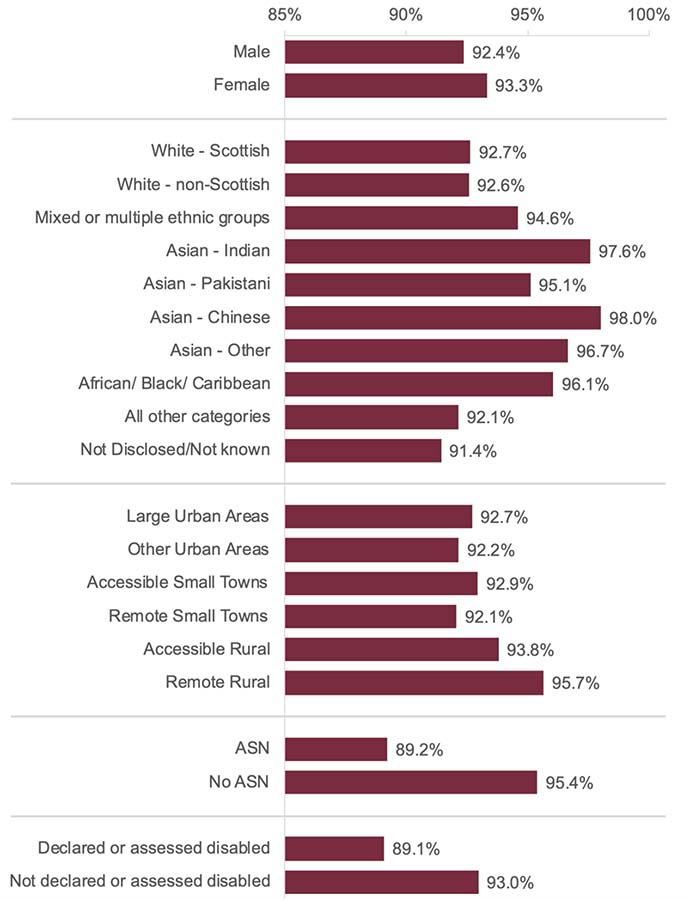
Note 10: Horizontal axis starts at 85 per cent.
More information on destinations by pupil characteristics is available in the supplementary tables.
Contact
Email: school.stats@gov.scot
There is a problem
Thanks for your feedback