Summary statistics for Follow- Up Leaver Destinations, No. 6: 2024 Edition
This statistical publication provides information on the follow-up destinations, nine months after the end of the school year, of 2022-23 school leavers from publicly funded secondary schools in Scotland.
3: Comparing initial and follow-up destinations
Key Points
- 95.1 per cent of 2022-23 school leavers who were in a positive initial destination were also in a positive follow-up destination.
- 34.9 per cent of those in an ‘other’ initial destination moved into a positive follow-up destination. This varied by initial destination with 46.7 per cent of those who were Unemployed Seeking and 16.8 per cent of those who were Unemployed Not Seeking moving into a positive follow-up destination.
- Employment was the destination school leavers were most likely to remain in between initial and follow-up. Of the 2022-23 school leavers who were in Employment as their initial destination, 94.7 per cent were also in Employment as their follow-up destination.
3.1 Initial and follow-up destinations
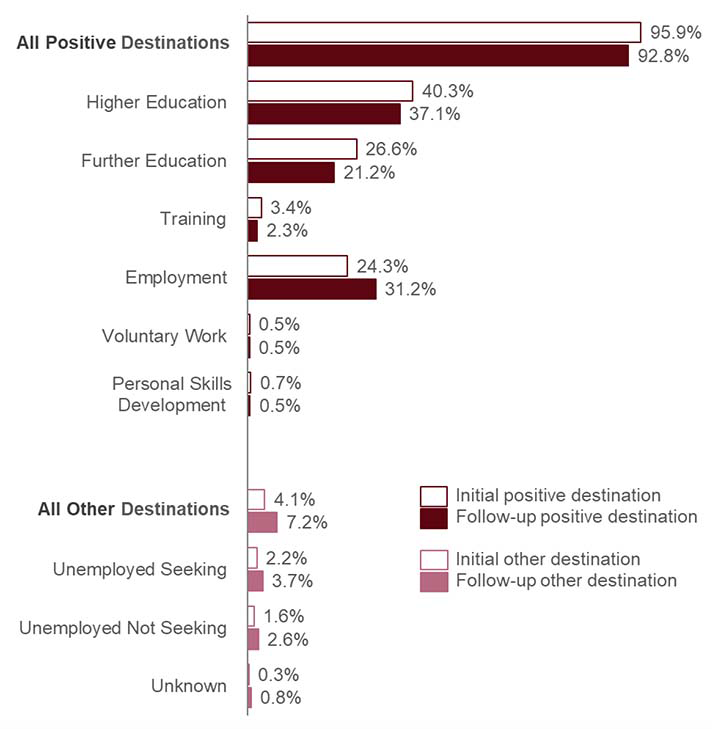
A school leaver’s follow-up destination, nine months after they leave school, can be different to their initial destination, three months after they leave school. Chart 7 compares the initial destinations and follow-up destinations of 2022-23 school leavers.
The proportion of school leavers in a positive initial destination was a record high 95.9 per cent (see the Summary statistics for attainment and initial leaver destinations publication). A smaller proportion of school leavers were in a positive follow-up destination (92.8 per cent). It is not unusual to see a decrease between initial and follow-up destinations - the same pattern can be seen across all previous school leaver cohorts since consistent records began in 2009-10. However, the decrease between initial and follow-up positive destinations in 2022-23 is the largest on record at around three percentage points.
In 2022-23, the largest reductions between initial and follow-up destinations were in Further Education and Higher Education. The largest increase was in Employment. Again, these patterns are broadly consistent with those seen in most years since 2009-10.
The proportion of leavers who were Unemployed Seeking or Unemployed and Not Seeking employment both increased between initial and follow-up destinations.
A time series of initial and follow-up destinations is available in the supplementary tables.
Percentage of school leavers by initial and follow-up destination category, 2022-23
3.2 Leavers staying in the same destination or changing destination
Chart 8 shows the proportion of 2022-23 school leavers whose follow-up destination was the same as their initial destination. In 2022-23, 95.1 per cent of those in a positive initial destination were also in a positive follow-up destination. This includes leavers in the same positive destination, and those who moved from one positive destination to another. This is down from 95.7 per cent in 2021-22.
The positive destination in which 2022-23 school leavers were most likely to remain between initial and follow-up was Employment. It is possible that some of these school leavers changed job in between times.
School leavers whose initial destination was Personal Skills Development or Training were less likely to remain in the same destination. This may reflect the short-term nature of some of these activities (see Chapter 4).
Percentage of school leavers whose follow-up destination was the same as their initial destination, 2022-23.
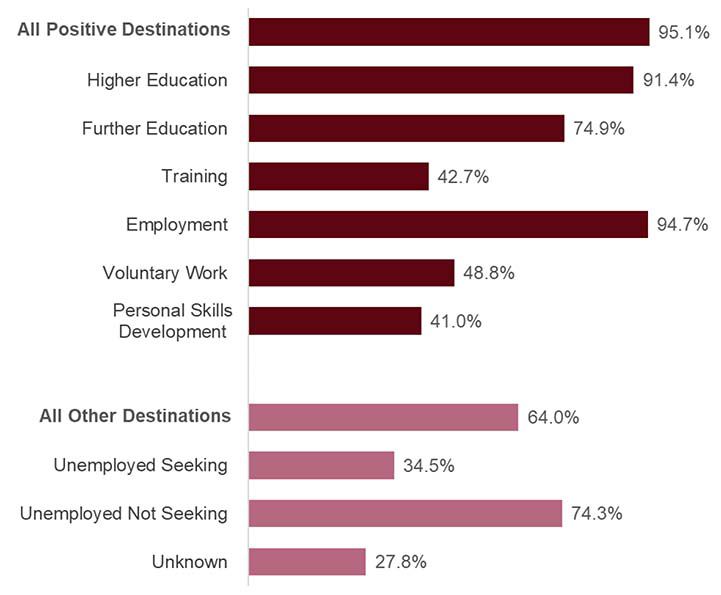
Of those school leavers who were in a positive initial destination, 4.7 per cent moved into an ‘other’ follow-up destination. This varied for different initial destinations.
For example, 41.0 per cent of those whose initial destination was Personal Skills Development (PSD) were also in PSD at follow-up, 33.4 per cent had moved into a different positive destination and 25.4 per cent had moved into an ‘other’ destination.
For those whose initial destination was Training, 42.7 per cent also had a follow-up destination of Training, 35.0 per cent had moved into a different positive destination and 21.9 per cent had moved into an ‘other’ destination.
Meanwhile 94.7 per cent of those whose initial destination was Employment also had a follow-up destination of Employment, 2.4 per cent were in a different positive destination and 2.7 per cent had moved into an ‘other’ destination.
Of those school leavers who were in an ‘other’ initial destination, 34.9 per cent moved into a positive follow-up destination. Again, this varied by initial destination.
Amongst those whose initial destination was Unemployed Seeking, 34.5 per cent were also Unemployed Seeking at follow-up, 18.2 per cent were in a different ‘other’ destination and 46.7 per cent had moving into a positive follow-up destination.
Of those whose initial destination was Unemployed Not Seeking, 74.3 per cent were still Unemployed Not Seeking at follow-up, 7.9 per cent were in a different ‘other’ destination and 16.8 per cent had moved into a positive follow-up destination.
Note that a small number of school leavers who were in the initial school leaver cohort are excluded from the follow-up cohort. This means that figures in this section may not sum to 100 per cent.
Table L1.8 in the supplementary tables provides information on school leavers staying in their initial destination or moving to a different destination.
3.3 Leavers staying in the same destination or changing destination, by the stage in which they left school
Chart 9 gives information on school leavers who were in a positive initial destination and moved to an ‘other’ destination at follow-up. Chart 10 provides information on school leavers who were in an ‘other’ initial destination and were still in an ‘other’ follow-up destination. They show this separately for those leaving from S4, S5 and S6.
Percentage of leavers in a positive initial destination who moved to an ‘other’ follow-up destination 2018-19 to 2022-23 [note 5]
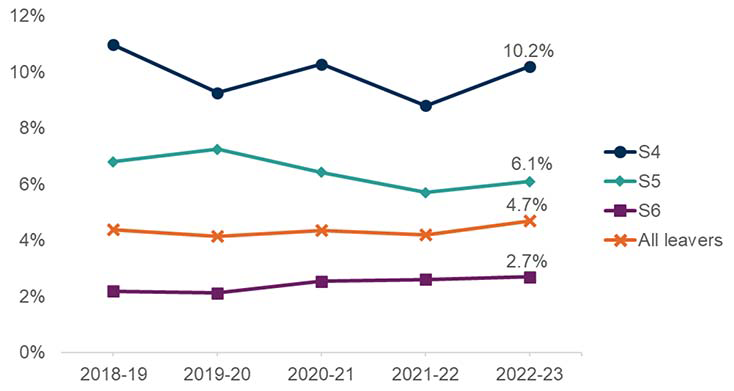
Note 5: A small percentage of school leavers left in other stages not shown in this chart. For more information see tables C1.1a and C1.1b in the supplementary tables.
School leavers from S4 were more likely to move from a positive destination to an ‘other’ destination between initial and follow-up than school leavers from S5 or S6. This holds for each year since 2018-19 (the earliest year for which this data is currently available, this can be found in the supplementary tables).
S6 leavers were the least likely to leave a positive destination and move into an ‘other’ destination between initial and follow-up.
Percentage of leavers in an ‘other’ initial destination who remained in an ‘other’ follow-up destination 2018-19 to 2022-23 [note 5][note 11]
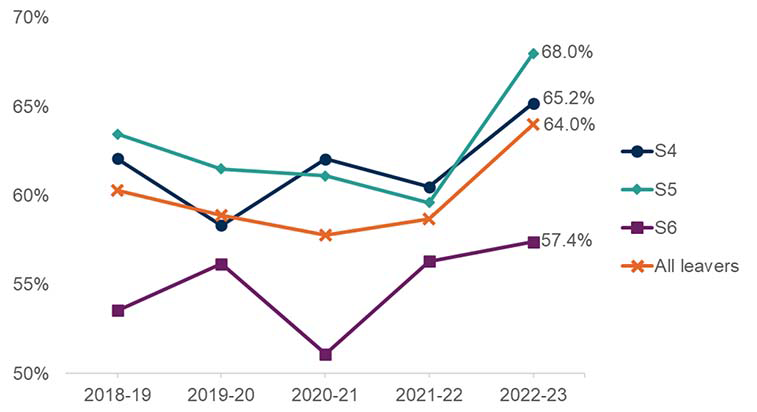
Note 5: A small percentage of school leavers left in other stages not shown in this chart. For more information see tables C1.1a and C1.1b in the supplementary tables.
Note 11: Vertical axis starts at 50 per cent.
S4 and S5 leavers who were in an ‘other’ initial destination were more likely to still be in an ‘other’ destination at follow-up than S6 leavers. This has been the case in every year since 2018-19.
Between 2021-22 and 2022-23, the percentage of leavers who remained in an ‘other’ destination between initial and follow-up increased for leavers from all stages. This may help explain why the drop between positive initial destinations and positive follow-up destinations was greater in 2022-23 than in other recent years (see Section 3.1) although it should be noted that the number of school leavers remaining in an ‘other’ destination is relatively small (around 1,400 school leavers in 2022-23).
Contact
Email: school.stats@gov.scot
There is a problem
Thanks for your feedback