Tackling child poverty - third year progress report : annex B - child poverty in families with a disabled adult or child
Evidence about child poverty in families with a disabled adult or child. The report presents the latest data on the child poverty targets and includes further evidence on the drivers of child poverty among this priority group.
Child Poverty Rates in Families with a Disabled Adult or Child
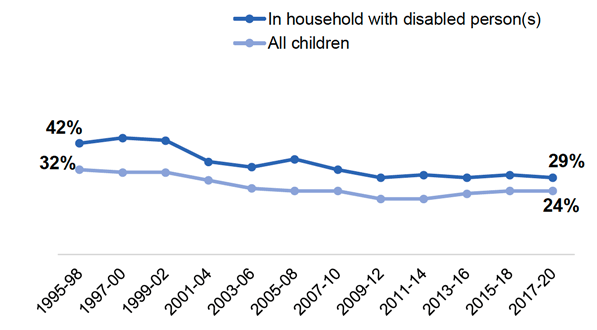
Families with a disabled member are more likely to be in poverty than those without.
The relative poverty rate for children in households with a disabled child was 27%, compared to 30% for households with a disabled adult, and it has been consistently higher among the latter.[16] This indicates that having a disabled adult in the family has a greater impact on whether or not the family is in poverty, although both are important. In almost half (49%) of families in relative poverty with a disabled adult, the disabled adult had a mental health problem. Details of latest poverty rates can be found in Table 1 below.
| Household group | Relative poverty | Absolute poverty | Low income and material deprivation | Persistent poverty[17] |
|---|---|---|---|---|
| All children | 240,000 | 210,000 | 120,000 | -- |
| (24%) | (22%) | (13%) | (16%) | |
| Disabled person in the household | 100,000 | 90,000 | 70,000 | -- |
| (29%) | (26%) | (20%) | (14%) |
Trend data over the past decade shows that this heightened risk of poverty among disabled families is a longstanding issue.

Source: Family Resources Survey


Source: Family Resources Survey[19] Source: Family Resources Survey
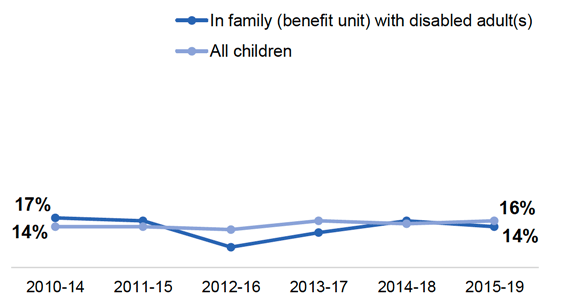
We do not have persistent poverty data for disabled children, but Graph 5 shows persistent poverty over time for children with a disabled adult in their family.

Source: Family Resources Survey
These measures of poverty do not account for the additional living costs that disabled people often incur (see section 2.2). One way to try and partly account for this is to exclude from total household income the benefits paid as a contribution towards these additional living costs.[20] We are then able to compare households with and without a disabled member on a more like-for-like basis. With these disability benefits removed from household income, the proportion of children in households with a disabled person who are in poverty rises sharply, as Table 2 shows.[21]
| Household composition | Relative poverty rate with disability benefits included in household income | Relative poverty rate with disability benefits removed from household income |
|---|---|---|
| Households with a disabled person (adult or child) | 29% | 34% |
| Households with disabled child(ren) | 27% | 31% |
| Households with disabled adult(s) | 30% | 36% |
Source: Scottish Government analysis of the Family Resources Survey
Contact
Email: sjsu@gov.scot
There is a problem
Thanks for your feedback