Take-up rates of Scottish benefits: November 2024
This publication contains our latest estimates of take-up of Scottish benefits delivered by Social Security Scotland. An 'Easy Read' version of this publication is available in the Supporting Documents section.
Scottish Child Payment: Local Authority Take-Up Rate Estimates
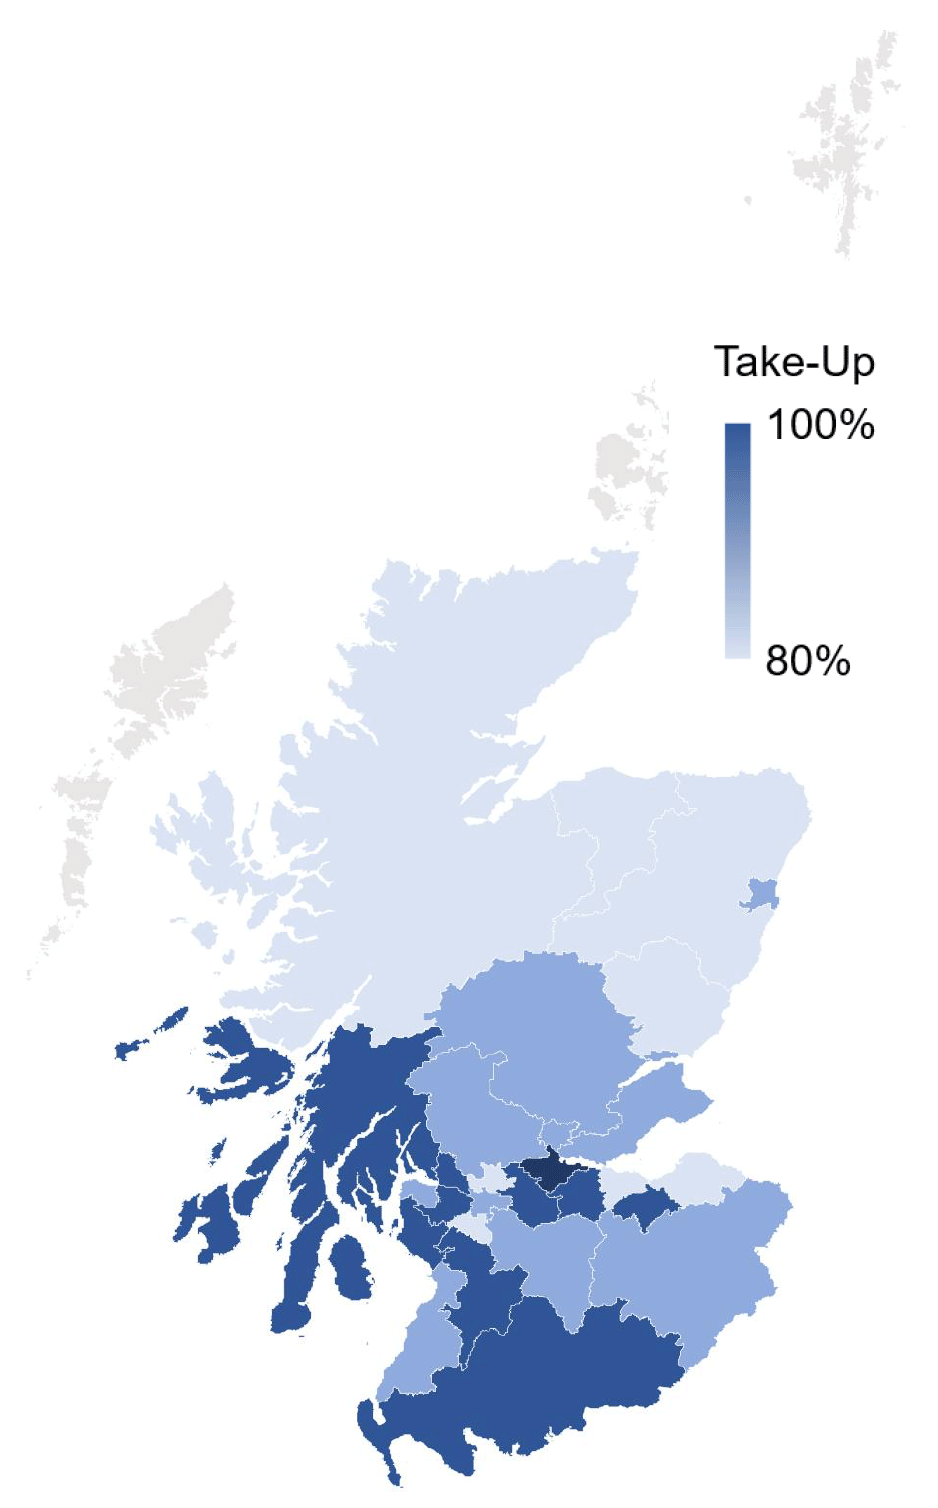
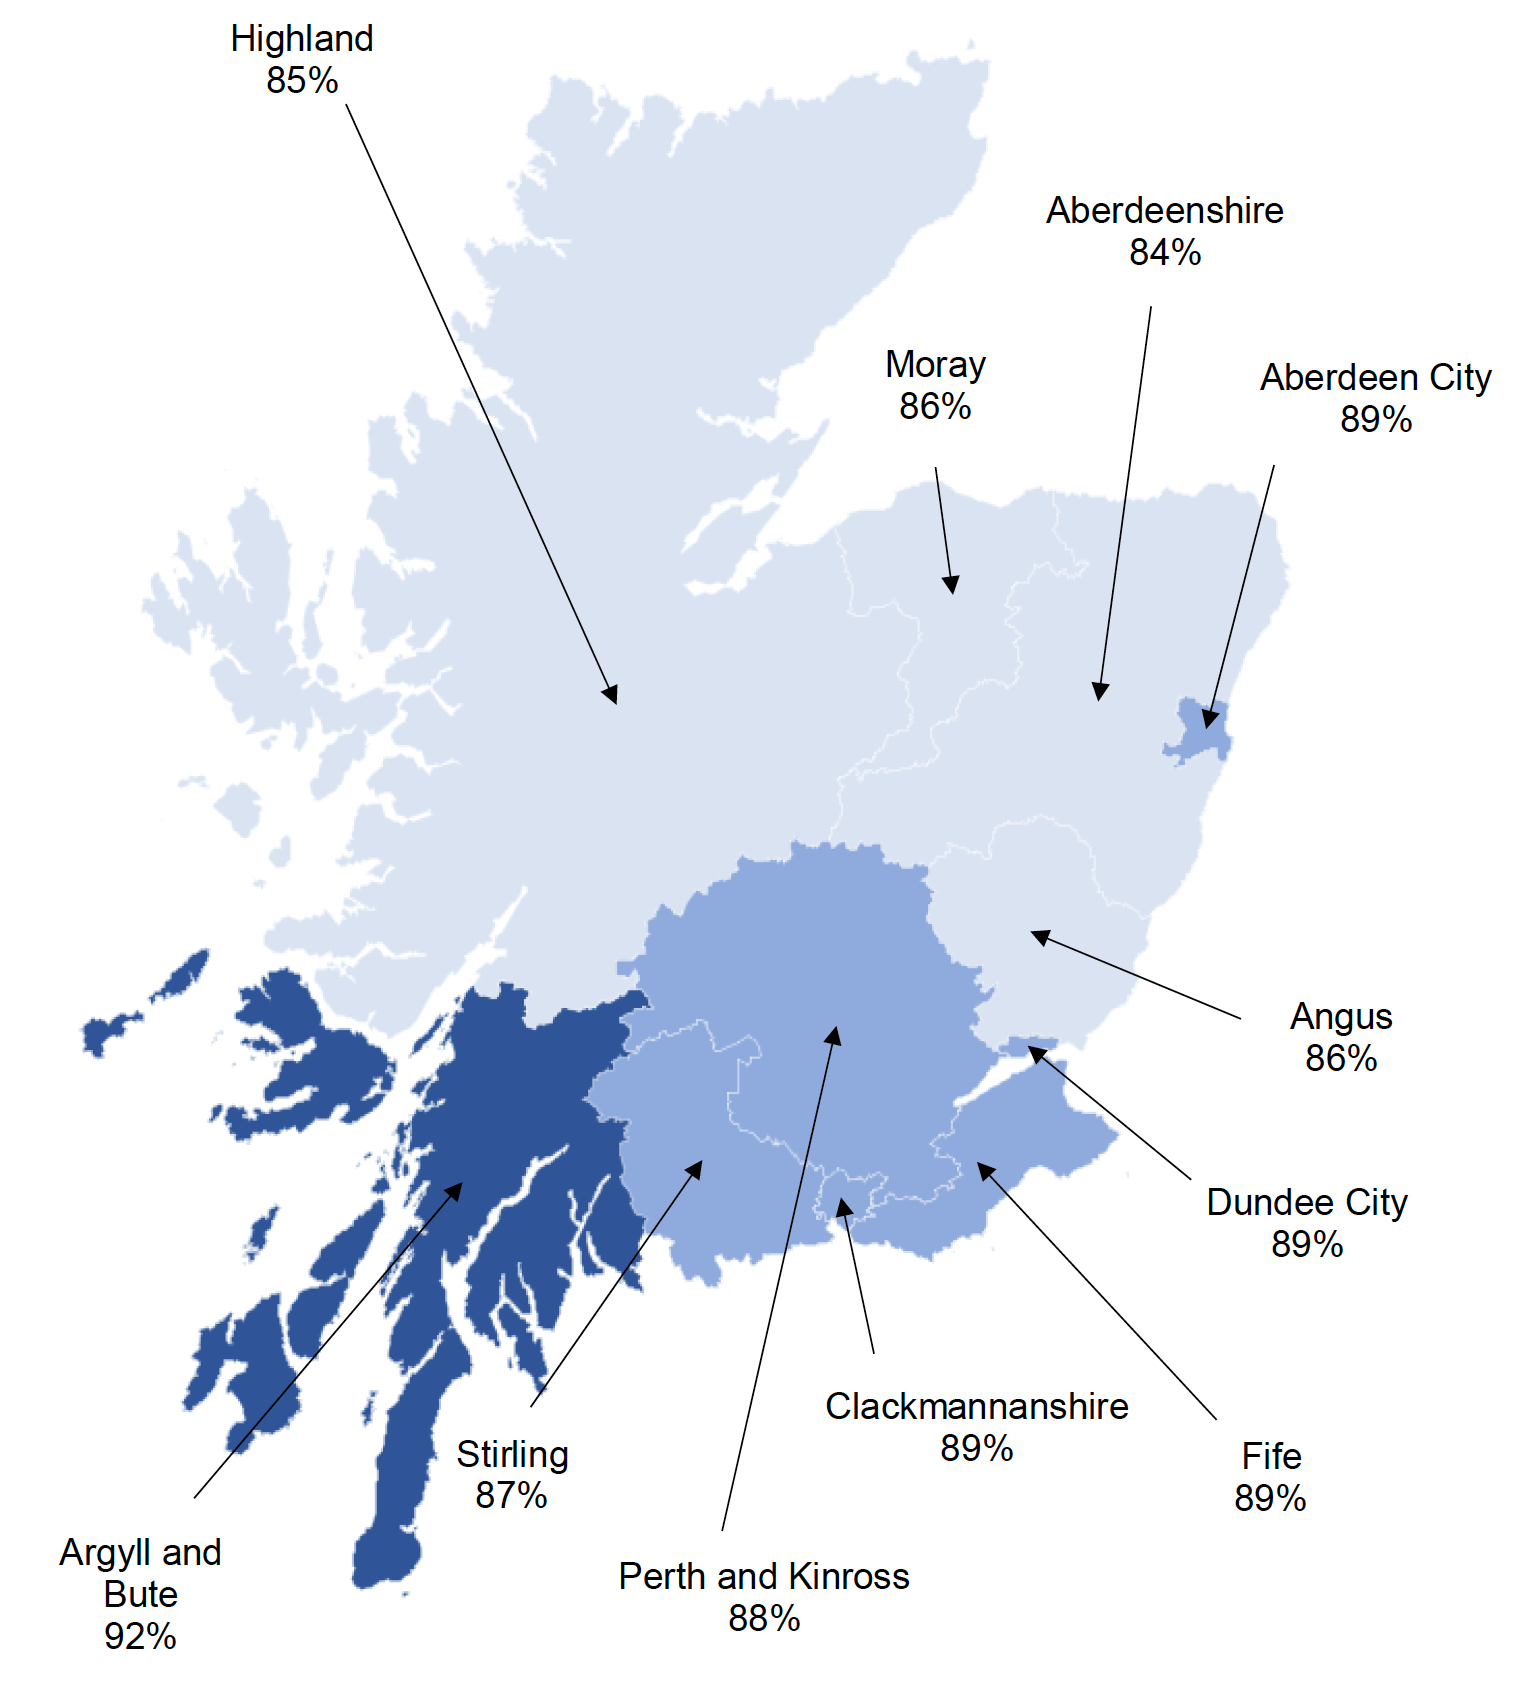
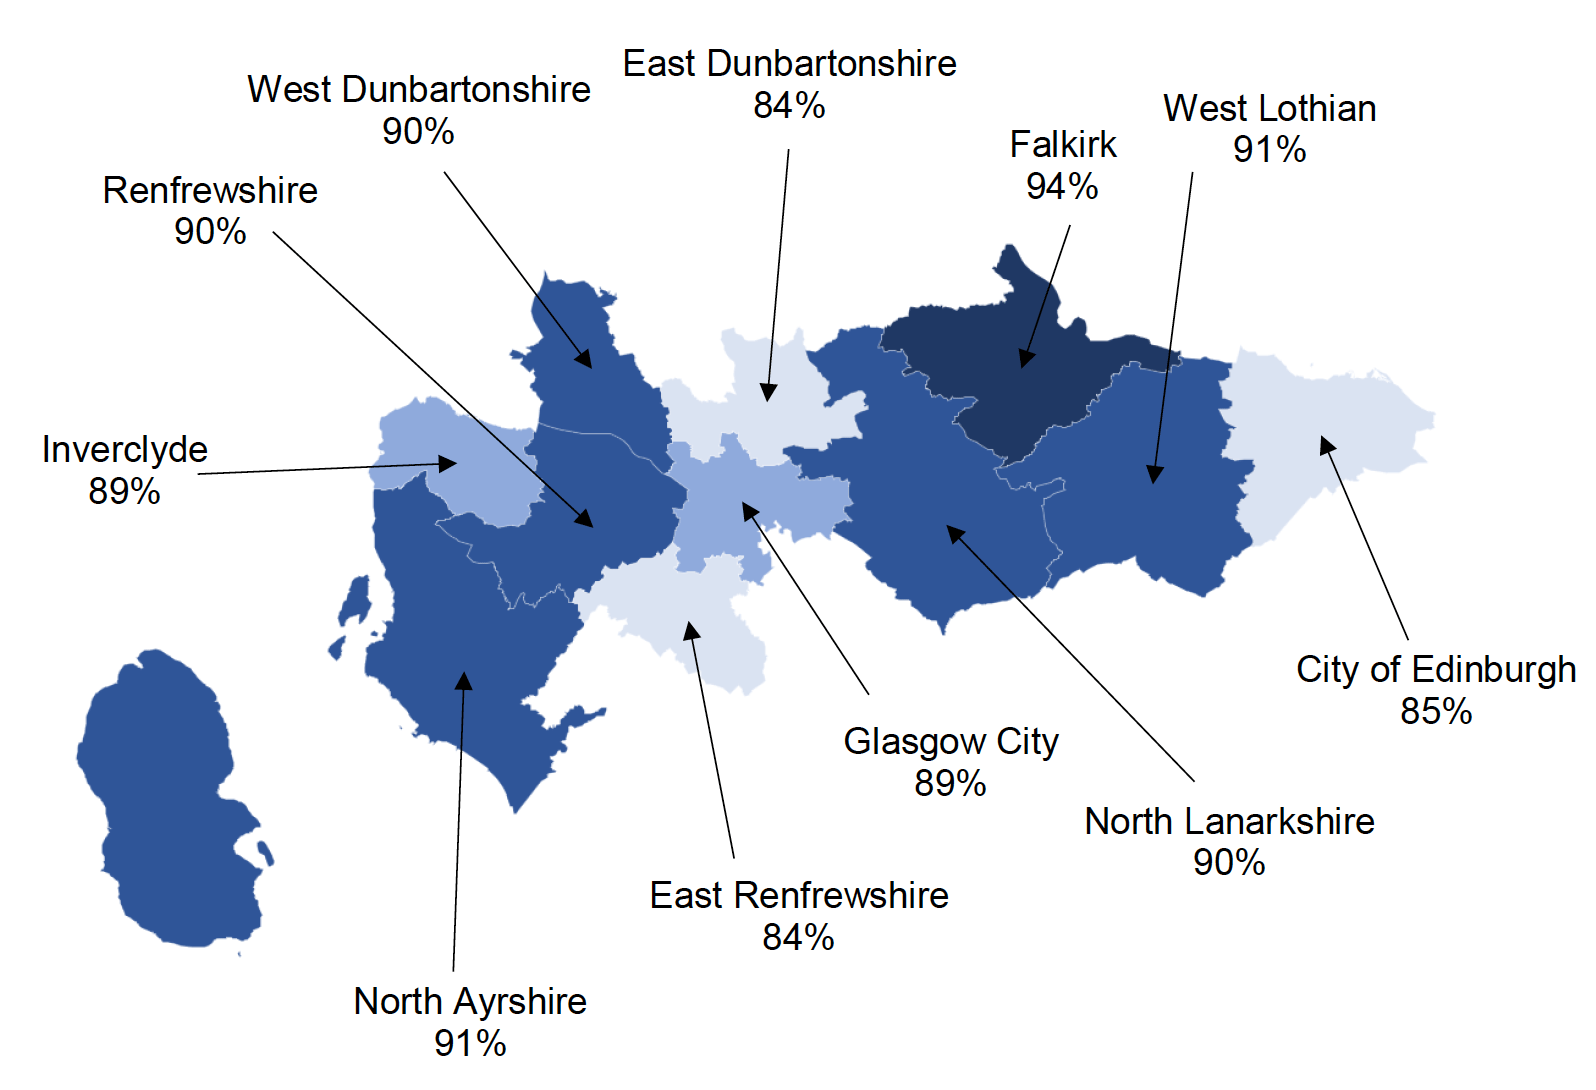
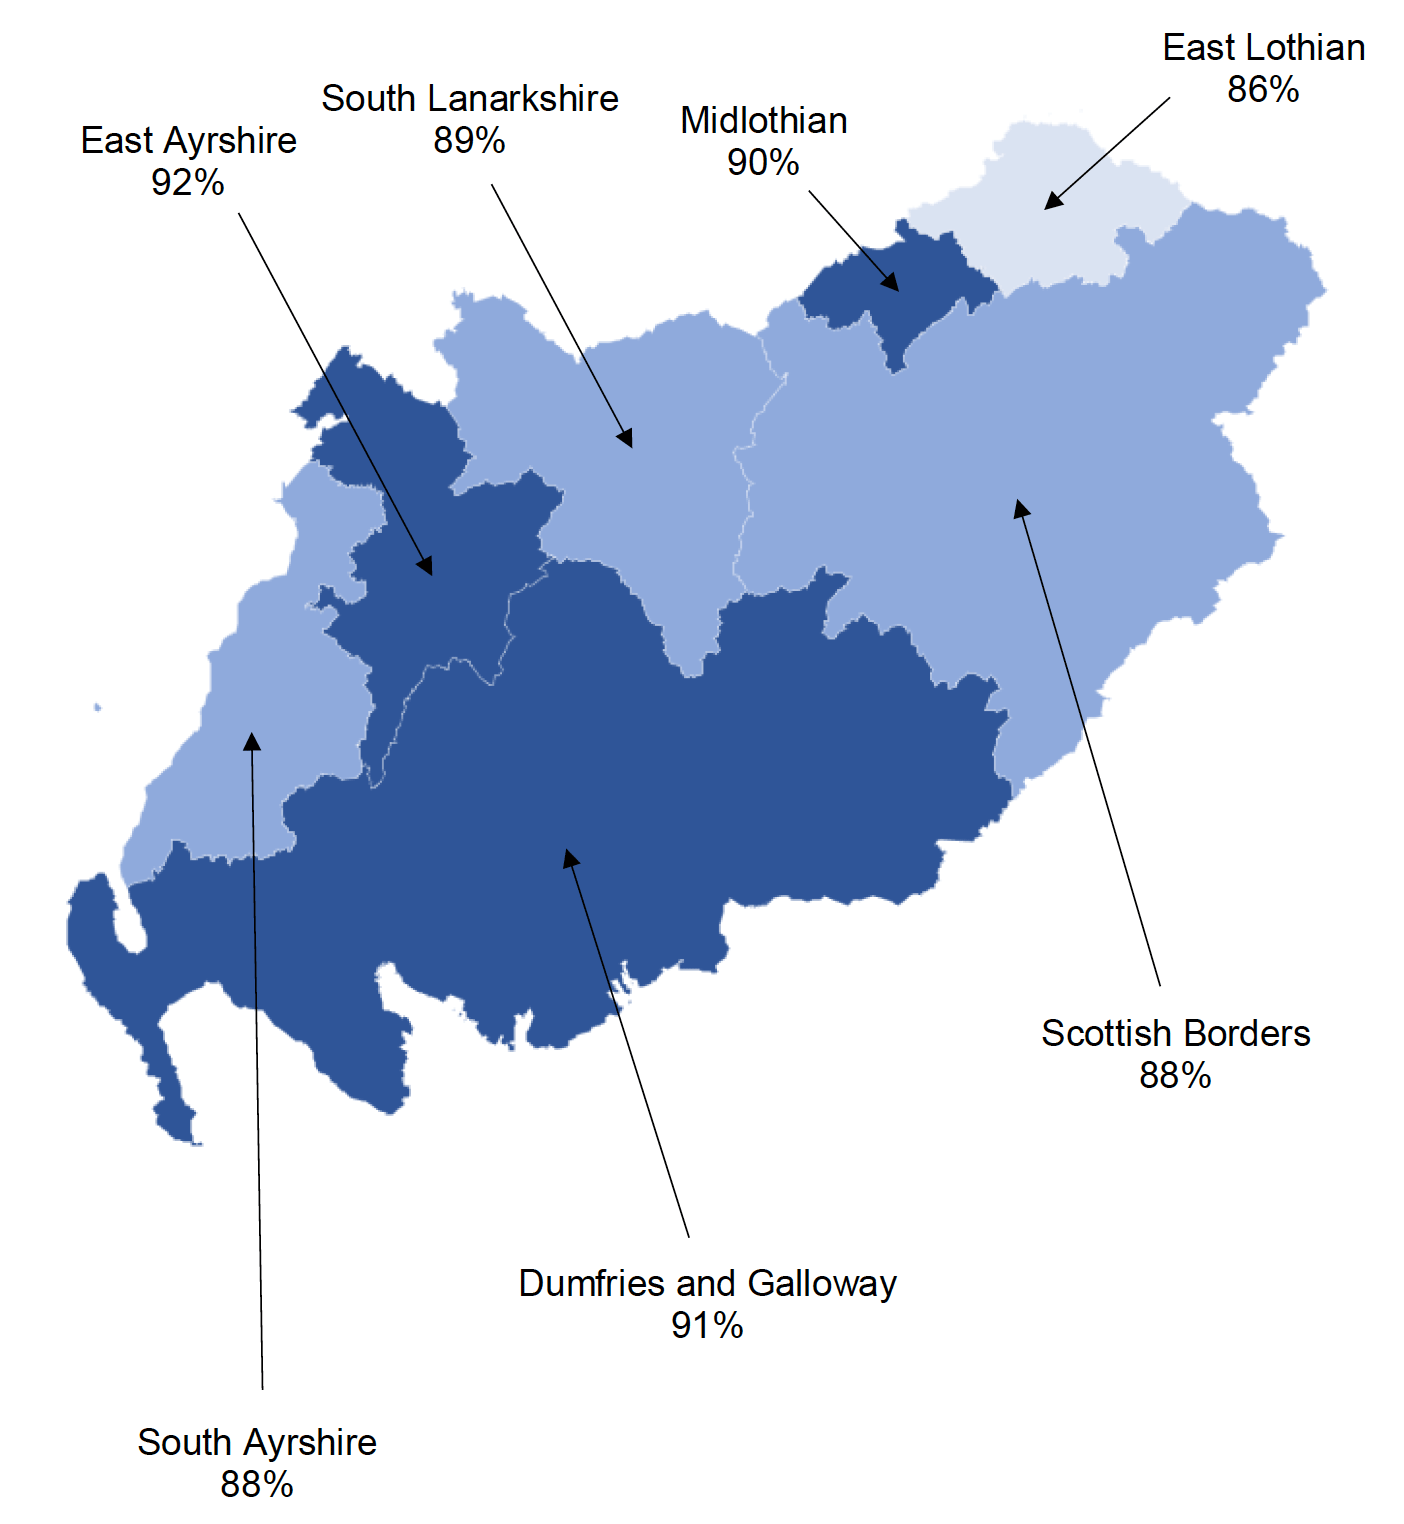
The following maps and table (Table 3) show estimated take-up rates for Scottish Child Payment (all children under 16) across local authorities in Scotland for 2023-24. Estimated take-up rates range from the lowest estimates of 84% for Aberdeenshire, East Dunbartonshire and East Renfrewshire to the highest estimate of 94% for Falkirk.


| Local Authority | Estimated Take-Up Rate for 2023-24 |
|---|---|
| Aberdeen City | 89% |
| Aberdeenshire | 84% |
| Angus | 86% |
| Argyll and Bute | 92% |
| Edinburgh, City of | 85% |
| Clackmannanshire | 89% |
| Dumfries and Galloway | 91% |
| Dundee City | 89% |
| East Ayrshire | 92% |
| East Dunbartonshire | 84% |
| East Lothian | 86% |
| East Renfrewshire | 84% |
| Falkirk | 94% |
| Fife | 89% |
| Glasgow City | 89% |
| Highland | 85% |
| Inverclyde | 89% |
| Midlothian | 90% |
| Moray | 86% |
| North Ayrshire | 91% |
| North Lanarkshire | 90% |
| Perth and Kinross | 88% |
| Renfrewshire | 90% |
| Scottish Borders | 88% |
| South Ayrshire | 88% |
| South Lanarkshire | 89% |
| Stirling | 87% |
| West Dunbartonshire | 90% |
| West Lothian | 91% |
Estimates for Orkney Islands, Shetland Islands and Na h-Eileanan Siar have not been included because the number of recipients is around 1000 children or less, deemed to be below the minimum threshold required for confidence in estimates.
Contact
Email: ceu@gov.scot
There is a problem
Thanks for your feedback