Harbour and grey seals: distribution maps
This study presents updated at-sea distribution maps for both harbour and grey seals in Scotland to inform marine spatial planning. The maps are generated using regional habitat preference relationships derived from new tracking data and estimates of seal abundance.
1. Introduction
1.1. General Background
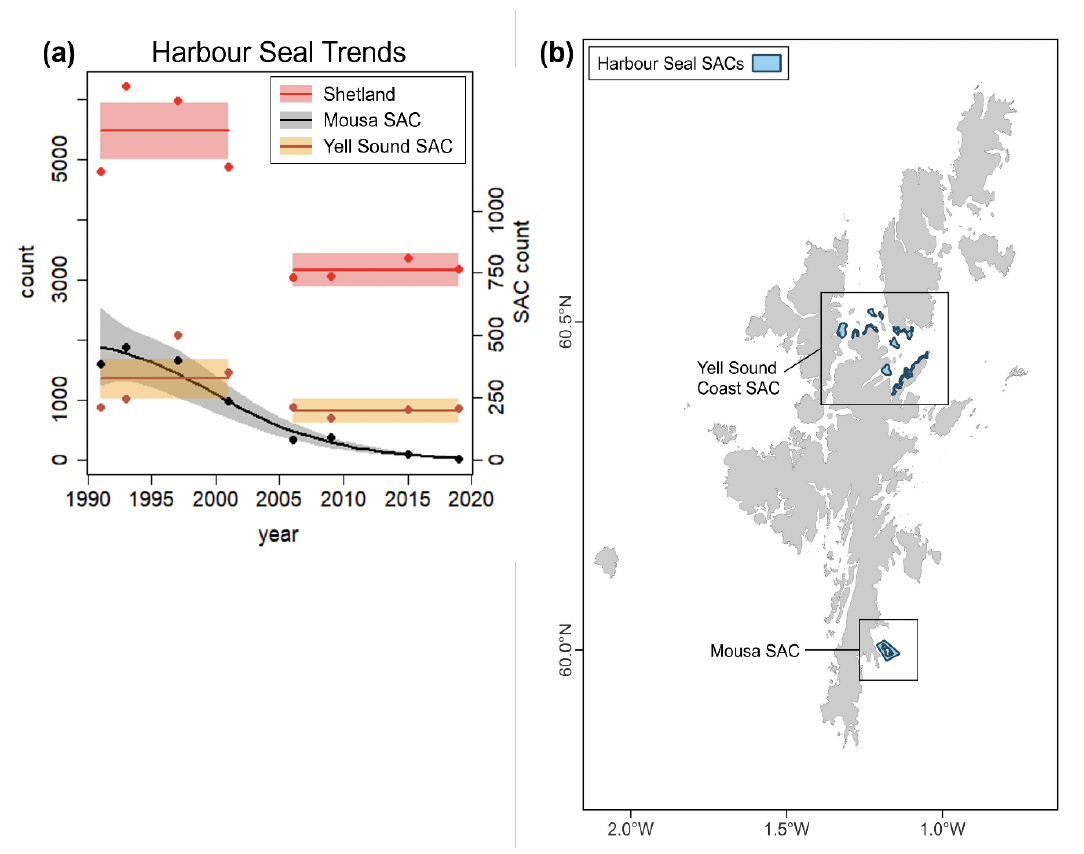
Scotland hosts approximately 85% and 80% of the UK’s harbour and gey seals, respectively (SCOS, 2022), making it an important population centre for both species. Regular monitoring of population trajectories has revealed complex regional dynamics. Grey seal numbers are generally stable or increasing throughout Scotland (Russell et al., 2022). However, harbour seal numbers are increasing in West Scotland and the Western Isles, while catastrophic declines have been experienced in the last two decades in Orkney and East Scotland (Russell et al., 2022). Harbour seal numbers in Shetland appear to be stable, despite having experienced a decline of > 30% since the early 2000s (Russell et al., 2022) (Fig. 1). However, this trend is not equal across the two Special Areas of Conservation (SACs) designated for harbour seals in Shetland; numbers are stable in the Yell Sound Coast SAC, but severely depleted and continuing to decline at ~22% per annum in the Mousa SAC (Russell et al., 2022) (Fig. 1). Indeed, the most recent count of harbour seals hauled out during the annual moult in 2019 recorded just seven individuals in the Mousa SAC; a decline of > 95% since 1991 (Russell et al., 2022).
Many key questions related to the ecology and conservation of seals require information on movements and behaviour at sea. Such information is provided by high resolution animal-borne tracking data, which are essential for mapping seal distribution (Russell & Carter, 2020). Through various funding streams over the last two decades, SMRU and collaborators have assembled an unprecedented GPS tracking dataset of grey and harbour seals covering most key centres of abundance in Northwest Europe. Satellite tracking devices (i.e., GPS tags) are glued to fur on the back of the seal’s neck. Devices collect and transmit location, dive and haulout information before falling off by the end of the annual moult. Tag deployments can last up to a maximum of 12 months, but there is a trade-off between tag longevity and data resolution.
GPS tracking data have been used to produce and update at-sea distribution maps for harbour and grey seals in recent years (Carter et al., 2022; Jones et al., 2015; Russell et al., 2017). Robust distribution estimates are key tools for the management and conservation of seal populations and are frequently used in marine spatial planning. Offshore energy structures can have complex effects on seal behaviour, ranging from avoidance during construction (Russell et al., 2016; Whyte et al., 2020) to providing novel foraging habitat as artificial reefs once established (Russell et al., 2014). Quantifying seal abundance at sea is therefore increasingly important given the scale of marine construction activity projected for offshore renewable energy installations, and the decommissioning and removal of oil and gas infrastructure. Distribution estimates are essential to understanding the potential magnitude of impacts of offshore activities and informing the consenting process for any future developments. Historically, these maps were generated based on a track smoothing approach applied to the tracking data (“usage maps” (Jones et al., 2015)), and more recently using regional habitat preference models (Carter et al., 2022).
1.2. Habitat Preference
Habitat preference models can be used to estimate the environmental drivers of distribution for a population of animals by relating observations of species presence/absence to metrics of habitat composition (Manly et al., 2002). The modelled relationship can then be used to predict the distribution of a population despite incomplete or non-uniform survey effort (i.e., predicting distribution emanating from haulout sites that no tagged seal has visited). In the case of tracking data, species observations are presence only data (there are no true absence data), thus a use-availability framework is often used to quantify habitat preference. In this approach, rather than presence versus absence, information on where tracked individuals did go (i.e., used points: tracking data) is compared to information on where the individuals could have gone (i.e., control points: a random sample of locations generated within the available habitat that is accessible to the individual) (Matthiopoulos, 2003). Preference for a particular habitat type is inferred when its use is disproportionate to its availability (Johnson, 1980).
1.3. Overview of Previous Work
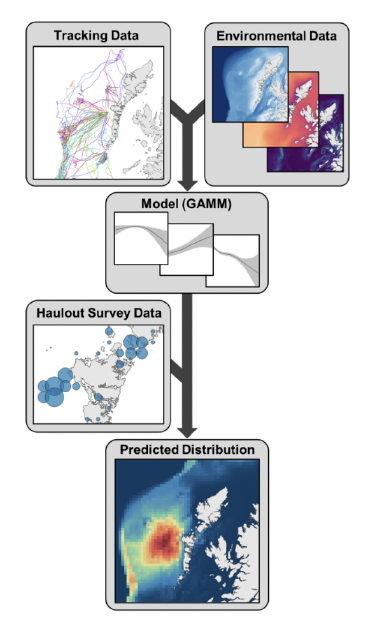
In Carter et al. (2022), a regional habitat preference modelling framework was used to generate predicted at-sea distribution maps for harbour and grey seals hauling out in the UK and Ireland. In brief, tracking data from GPS satellite telemetry tags deployed on harbour and grey seals were modelled alongside control points randomly sampled within an area deemed to be accessible to each individual. The accessible area was determined for each species based on the maximum distance from the haulout (accounting for land barriers) recorded for any individual, as a measure of the maximum foraging trip range. Environmental data were then extracted for both used and control points, and modelled in generalized additive mixed models (GAMMs) to quantify habitat preference. At-sea distribution was then predicted for each known haulout around the coast, weighted by the number of animals counted at each haulout on the most recent haulout survey, conducted during the annual harbour seal moult in August (Fig. 2). Importantly, Carter et al. (2022) showed that habitat preference varies regionally, thus discrete models were fitted to data from different regions, and predictions were then combined into one map per species, representing the at-sea distribution of all seals hauling out in the UK and Ireland.
In Carter et al. (2022) tracking data were combined from tags deployed by SMRU, the University of Aberdeen and University College Cork (UCC). However, no recent high resolution (GPS) tracking data were available for either species around Shetland. Thus, the distribution of seals hauling out in Shetland was predicted based on the modelled habitat preference of tracked individuals hauling out in Orkney and the north coast of mainland Scotland (Carter et al., 2022). While a strength of the modelling approach described above is the ability to predict distribution for haulout sites that no tagged animals have visited based on the habitat preference of seals using haulouts elsewhere, the robustness of such predictions is likely compromised when predicting distribution for regions where tracking data are completely lacking. Shetland was therefore highlighted as an important data gap, and a priority for future tag deployments (Carter et al., 2022; Russell & Carter, 2020). Here we present updated distribution maps combining existing tracking data with data from tags deployed on grey and harbour seals in Shetland in 2022, and updated haulout counts.
Contact
Email: ScotMER@gov.scot
There is a problem
Thanks for your feedback