Harbour and grey seals: distribution maps
This study presents updated at-sea distribution maps for both harbour and grey seals in Scotland to inform marine spatial planning. The maps are generated using regional habitat preference relationships derived from new tracking data and estimates of seal abundance.
3. Results
3.1. Overview of Downloadable Output
The following files are available for download via the Marine Scotland data portal:
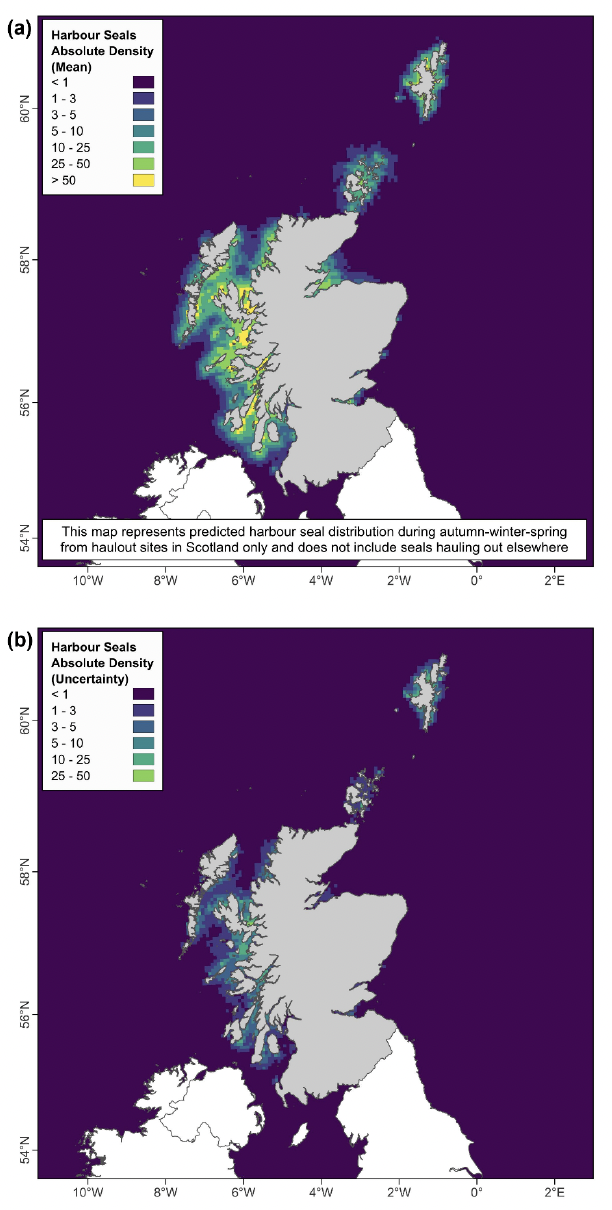
- Harbour_seal_absolute_density_SCOTLAND_202403.tiff
- A raster of harbour seal distribution from haulouts in Scotland, presented in the absolute scale (number of animals) per 5km pixel
- Harbour_seal_relative_density_SCOTLAND_202403.tiff
- A raster of harbour seal distribution from haulouts in Scotland, presented in the relative scale (percentage of at-sea population) per 5km pixel.
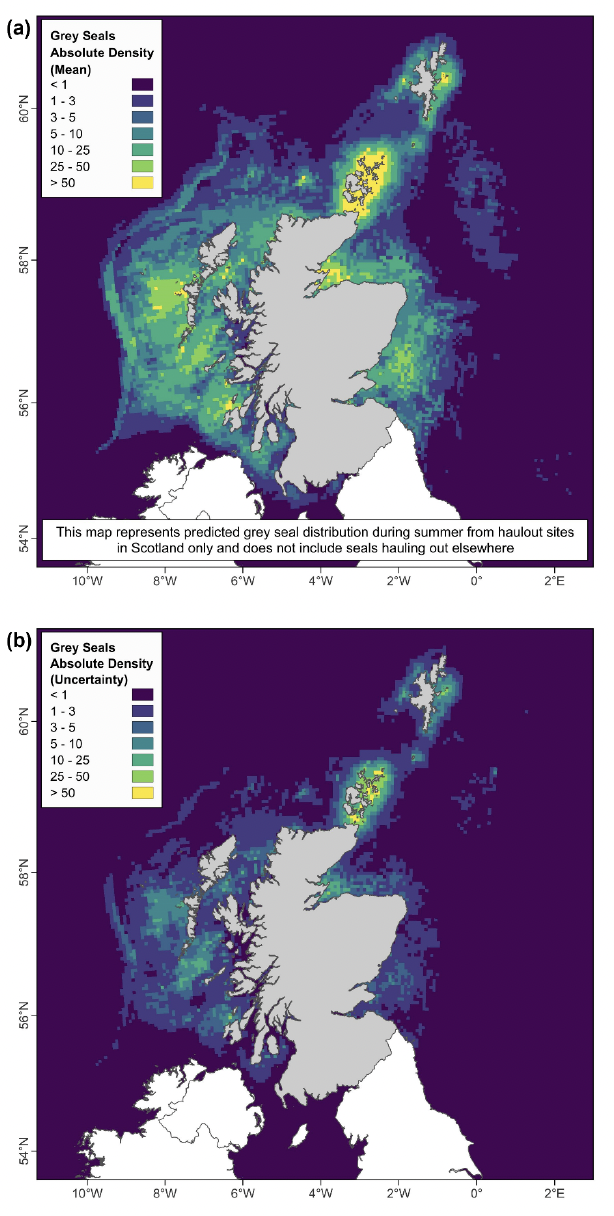
- Grey_seal_absolute_density_SCOTLAND_202403.tiff
- A raster of grey seal distribution from haulouts in Scotland, presented in the absolute scale (number of animals) per 5km pixel.
- Grey_seal_relative_density_SCOTLAND_202403.tiff
- A raster of grey seal distribution from haulouts in Scotland, presented in the absolute scale (number of animals) per 5km pixel.
- Seal_density_estimates_README_202403.txt
Each of these GeoTiff files contains three GIS raster layers in a Universal Transverse Mercator 30°N World Geodetic System 1984 projection (EPSG: 32630): “mean”, “LCL” and “UCL”. Values are given on a regular 5 km by 5 km grid. Mean values reflect the population mean estimate, while LCL and UCL represent the cell-wise 95% lower and upper confidence limits around the mean, respectively. Briefly, these confidence intervals essentially represent the uncertainty in the modelled distribution, and do not incorporate variability in the haulout abundance. The readme file contains information on usage and limitations of the distribution estimates.
Mean values may be summed across an area of interest (e.g., to estimate the number of animals within a wind farm development zone), but confidence intervals are provided on a cell-by-cell basis and must not be summed across an area (see Discussion Section 4.2.2).
Harbour and grey seal distribution maps are shown in Figures 5 and 6 below. Here we show absolute density (number of animals per grid cell) for ease of interpretation but provide GIS layers for both absolute and relative density (percentage of at-sea population per grid cell). It is important to note that the conversion process from relative to absolute density involves use of population scalars derived from telemetry data, and these are subject to a number of caveats (see Discussion Section 4.2.1 and Carter et al. (2022) for further details). As such, relative density estimates should be used where possible.
3.2. Comparison to Previous Maps
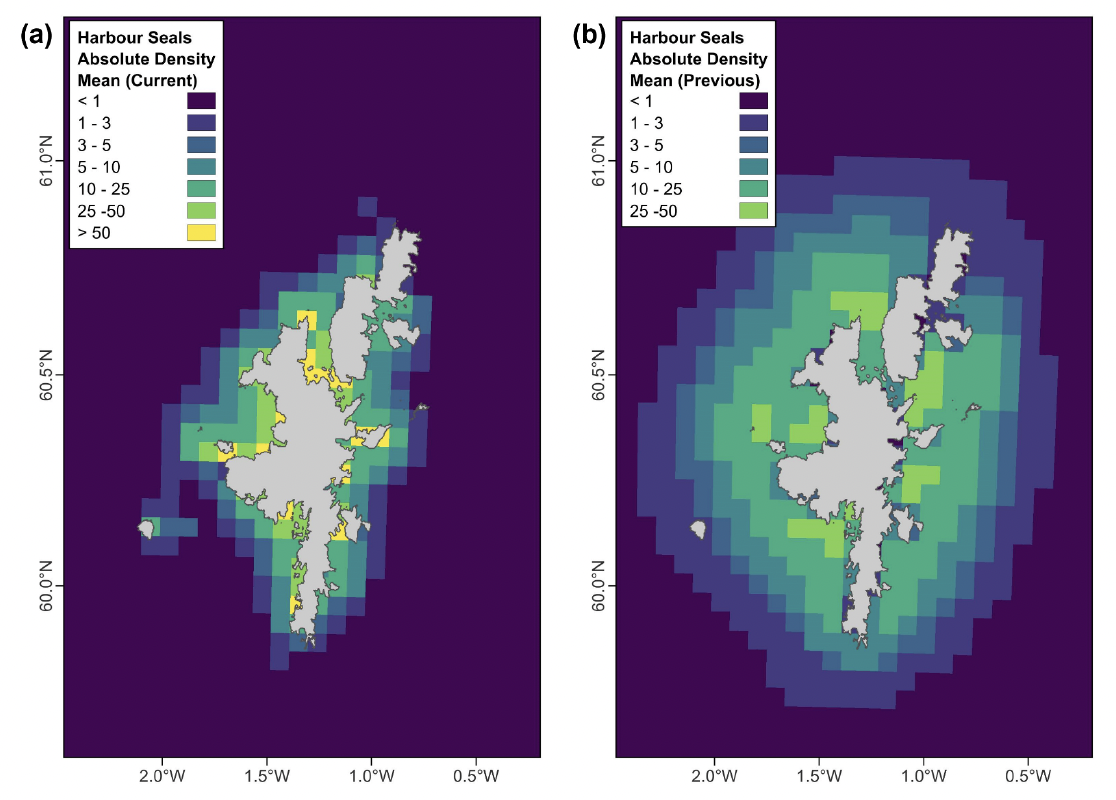
With the inclusion of tracking data from Shetland, predictions for this region are now based on modelled habitat preference relationships of seals hauling out in Shetland, and not those hauling out in Orkney and the north coast of mainland Scotland, as in Carter et al. (2022). Additionally, the latest available count data at the time of analysis for Carter et al. (2022) were from 2015. These have now been updated to counts from 2019. The current analysis has also benefitted from some improvements to the methods for habitat preference modelling (detailed in Discussion Section 4.1). The resulting distributions from the current analysis show a much more coastal distribution for harbour seals in Shetland, with higher density cells adjacent to major haulouts compared to those of previous estimates (Fig. 7). This is consistent with dominant patterns observed in the tracking data. Although a small number of foraging trips were recorded for two individuals extending beyond 20 km from shore (n = 6; 0.3% of all trips), 95% of all harbour seal location data were within 3 km of the coast (mean = 0.6 km).
Contact
Email: ScotMER@gov.scot
There is a problem
Thanks for your feedback