Vision for Justice in Scotland: measurement framework
Measurement framework to support the delivery of the Vision for Justice in Scotland.
Trend data - We have a society in which people feel, and are, safer in their communities and the victims of crime and harm are heard and supported
We experience less crime, especially violent crime

Police recorded crime is at one of the lowest levels seen since 1974 and is down 13% since 2013-14. The total number of crimes recorded by the police in Scotland in 2022-23 was 289,352. This is 2,888 crimes (or 1%) higher than the level recorded in 2021-22. Over the past ten years, total recorded crime in Scotland has decreased by 13%.
Statistics on recorded crimes and offences provide a measure of the volume of criminal activity with which the police are faced. This does not reveal the incidence of all crime committed as not all crimes are reported to the police. A crime or offence is regarded as cleared up where there exists a sufficiency of evidence under Scots law to justify consideration of criminal proceedings. In 2022-23 the clear up rate was 53.3%.
Source: Recorded Crime in Scotland, 2022-23 - gov.scot (www.gov.scot)

In 2019/20, 11.9% of adults experienced at least one SCJS (property or violent) crime.
Due to the restrictions put in place during the COVID-19 pandemic, no survey was run during the 2020/21 financial year. The 2021/22 SCJS will be published at the end of November 2023. This data is expected to be produced annually.
Source: Scottish Crime and Justice Survey 2019/20

Non-sexual crimes of violence recorded by the police decreased by 1%, from 69,286 in 2021-22 to 68,870 in 2022-23.
Statistics on recorded crimes and offences provide a measure of the volume of criminal activity with which the police are faced. This does not reveal the incidence of all crime committed as not all crimes are reported to the police. A crime or offence is regarded as cleared up where there exists a sufficiency of evidence under Scots law to justify consideration of criminal proceedings. In 2022-23 the clear up rate was 67.3%. Source: Recorded Crime in Scotland, 2022-23 - gov.scot (www.gov.scot)

There were 53 homicide victims recorded by the police in Scotland in 2021-22, a 16% decrease from 2012-13 and the lowest value since comparable records began in 1976. For all of the 53 homicide victims recorded in 2021-22, the associated case was solved.
Statistics on recorded crimes and offences provide a measure of the volume of criminal activity with which the police are faced. This does not reveal the incidence of all crime committed as not all crimes are reported to the police. Statistics on the number of homicides include all crimes of Murder and Culpable homicide (common law).
Source: Homicide in Scotland 2021-22
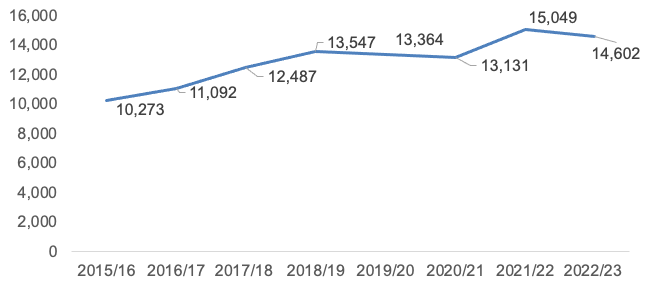
Recorded sexual crimes decreased in the most recent year. Sexual crimes decreased by 3%, from a high of 15,049 in 2021-22 to 14,602 in 2022-23. These crimes are now at the second highest level seen since 1971, the first year for which comparable groups are available.
Statistics on recorded crimes and offences provide a measure of the volume of criminal activity with which the police are faced. This does not reveal the incidence of all crime committed as not all crimes are reported to the police. A crime or offence is regarded as cleared up where there exists a sufficiency of evidence under Scots law to justify consideration of criminal proceedings. In 2022-23 the clear up rate for sexual crimes was 53.4%.
Source: Recorded Crime in Scotland, 2022-23 - gov.scot (www.gov.scot)

The SCJS asks respondents if they have experienced one or more of the following types of serious sexual assault: Serious sexual assault; Forced sexual intercourse; Attempted forced sexual intercourse; Forced other sexual activity (for example, oral sex); Attempted forced other sexual activity. In 2016/18 the figure for all adults was 0.2%, in 2018/20 it 0.3% - no significant change since 2016/18.
SCJS questions on sexual assault sit within the self-completion part of the survey. Due to the following factors the decision to publish the self-completion data from 2021/22 is still being considered:
- the suspension of fieldwork as a result of COVID-19,
- the fact that fewer respondents complete the self-completion modules compared with the main survey and,
- the requirement to have two-years’ worth of self-completion data for standard results (and due to suspension of fieldwork in 2020, we only have one).
Analysts are considering options for publishing this standalone year and will inform users through SCOTSTAT of these plans once they are finalised. The 2023/24 SCJS contains questions on sexual assault and this data is expected to be published in 2026 at the earliest and then will continue to be produced bi-annually.
Source: Scottish Crime and Justice Survey 2019/20

The police recorded 64,807 incidents of domestic abuse in 2021-22. These statistics on domestic abuse are based on details of incidents recorded by Police Scotland in 2021- 22. Domestic abuse recorded by the police does not reveal the incidence of all domestic abuse committed in Scotland, as not all incidents are reported to the police.
Source: Domestic abuse in Scotland statistics
We suffer less harm, including from emergency situations and fires

There were 27,771 fire incidents in 2021-22. This is an increase of 10.4% from last year (up from 25,153). Primary fires incident categories are close to historic averages. Secondary fires have increased from 15,130 in 2020-21 to 17,568 this year (up 16.1%),
and chimney fires which have decreased from 604 in 2020-21 to 416 this year (down 31.1%). This change also comprises of a 10.1% increase in road vehicle fires and a 0.6% decrease in dwelling fires.
Source: SFRS
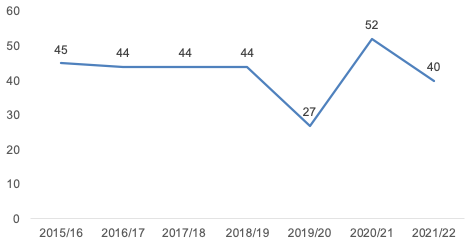
The number of fire fatalities decreased from 52 in 2020/21 to 40 in 2021/22.
Source: SFRS

The chart above shows the European Age Standardised Rate (EASR) per 100,000 for emergency hospital admissions as a result of an unintentional injury in children for years ending 31 March 2013 to 2022. The trend has been decreasing over the last 10 years for males aged under 15, and it was 805 per 100,000 population in 2021/22. For females of the same age group, the rate decreased from 598.9 in 2020/21 to 585 in 2021/22.

The chart above shows the EASR per 100,000 for emergency hospital admissions as a result of an unintentional injury in adults for years ending 31 March 2013 to 2022. The general trend for adult females over the last ten years shows a slight increase. In contrast, the rate for males shows a decrease between 2012/13 to 2015/16, followed by a slight increase over the next three years. However, between 2019/20 and 2020/21 the rate for both males and females aged 15 and over decreased sharply, Scotland’s COVID-19 pandemic response measures have likely contributed to this decrease. In 2021/22 rates have increased slightly from 1,098.5 in 2020/21 to 1123.6 in 2021/22 for males, and from 1,053.1 in 2020/21 to 1,081.1 in 2021/22 for females. The overall adult rate for 2021/22 was 1,102.
Data Source: PHS SMR01 - discharges; National Records Scotland – Population. Notes: 1.Rate per 100,000 directly standardised (age-sex) using the European standard population (2013). p.Data for 2021/22 are provisional and subject to change in future analyses.
Source: Unintentional Injuries in Scotland (publichealthscotland.scot)
We are more resilient to cyber threats and attacks

An estimated 14,890 cyber-crimes were recorded by the police in 2022-23.
From 2025, the SCJS will include an estimation of cyber crimes.
Source: Recorded Crime in Scotland, 2022-23 - gov.scot (www.gov.scot)
We must uphold children’s rights and protect children from all forms of physical or mental violence, injury or abuse, including adverse childhood experiences
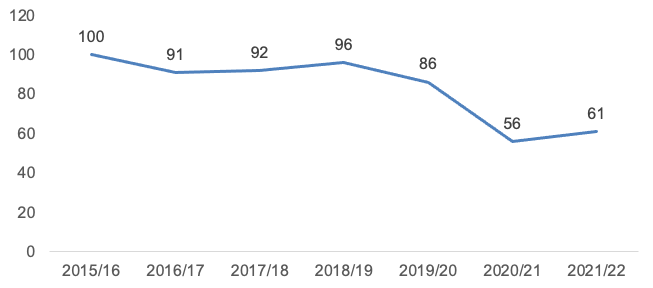
The number of emergency admissions to hospital in Scotland for those under 15 resulting from assault was 61 in 2021/22.
Of those who reported children were living in the household, % that said that the children were present (in or around the house or close by) during the most recent incident, 2016/18 and 2018/20

Of those who reported children were living in the household (32%), 71% said that the children were present (in or around the house or close by) during the most recent incident.
SCJS questions on partner abuse sit within the self-completion part of the survey. Due to the following factors the decision to publish the self-completion data from 2021/22 is still being considered:
- the suspension of fieldwork as a result of COVID-19,
- the fact that fewer respondents complete the self-completion modules compared with the main survey and,
- the requirement to have two-years’ worth of self-completion data for standard results (and due to suspension of fieldwork in 2020, we only have one).
Analysts are considering options for publishing this standalone year and will inform users through SCOTSTAT of these plans once they are finalised. In addition, the questions on the topic of partner abuse have undergone significant improvement for the 2023/24 survey to reflect the new legislative landscape around Domestic Abuse. As these findings are typically produced bi-annually, the first findings are likely to be published in 2026 at the earliest and then will continue to be produced bi-annually.
Source: Scottish Crime and Justice Survey 2019/20
We all should experience equality and mutual respect

12.5% of adults said that they had been insulted, pestered or intimidated in the previous year, unchanged since 2016/17.
Due to the restrictions put in place during the COVID-19 pandemic, no survey was run during the 2020/21 financial year. The 2021/22 SCJS will be published at the end of November 2023. This data is expected to be produced annually. In addition, the questions on this topic have undergone improvement for the 2023/24 survey and the first findings based on these new questions are will be published in 2025 at the earliest.
Source: Scottish Crime and Justice Survey 2019/20

Of respondents who had a partner or contact with an ex-partner in the 12 months prior to interview, the percentage who experienced at least one incident of partner abuse in the 12 months prior to interview was 3.2% in 2018/20, unchanged from 2016/18.
SCJS questions on partner abuse sit within the self-completion part of the survey. Due to the following factors the decision to publish the self-completion data from 2021/22 is still being considered:
- the suspension of fieldwork as a result of COVID-19,
- the fact that fewer respondents complete the self-completion modules compared with the main survey and,
- the requirement to have two-years’ worth of self-completion data for standard results (and due to suspension of fieldwork in 2020, we only have one).
Analysts are considering options for publishing this standalone year and will inform users through SCOTSTAT of these plans once they are finalised. In addition, the questions on the topic of partner abuse have undergone significant improvement for the 2023/24 survey to reflect the new legislative landscape around Domestic Abuse. As these findings are typically produced bi-annually, the first findings are likely to be published in 2026 at the earliest and then will continue to be produced bi-annually.
Source: Scottish Crime and Justice Survey 2019/20
We experience less hate crime and sectarian behaviour

Between 2015/16 & 2021/22, the number of hate crimes recorded by the police was relatively stable, at around 6,300 to 7,000. These statistics on Hate Crimes are based on details of incidents recorded by Police Scotland in 2021- 22. Hate Crimes recorded by the police does not reveal the incidence of all hate crimes committed in Scotland, as not all incidents are reported to the police.
Source: Police recorded hate crime – characteristics: updated study
We all feel safer in our communities

In 2019/20, the majority of adults in Scotland said they felt very or fairly safe walking alone in their local area after dark (77%).
The proportion feeling safe walking in their local area when alone has been stable over the last few years.
Despite perceptions improving over the last decade, feelings of safety continued to vary by factors such as gender, age, area deprivation, and rurality in 2019/20.

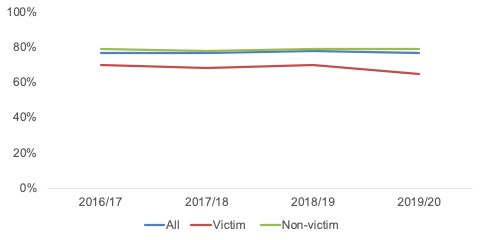

In 2019/20 there continued to be notable differences in relative feelings of safety amongst population groups as depicted. For example, women, those in the 15% most deprived areas, and victims were less likely to feel safe than men, people living in the rest of Scotland, and non-victims, respectively.
As improved perceptions have been experienced fairly equally amongst the population since 2008/09, the size of the relative gap in feelings of safety between comparator groups has typically shown little change over the past few years.
Source: Scottish Crime and Justice Survey 2019/20


Almost 85% of adults in 2019/20 agreed strongly or slightly that if their home was empty, they could count on one of their neighbours or other people in this area to keep an eye on it, unchanged since 2016/17. Over half (56%) of adults in 2019/20 agreed strongly or slightly that people in their area pull together to prevent crime, unchanged since 2016/17.
Due to the restrictions put in place during the COVID-19 pandemic, no survey was run during the 2020/21 financial year. The 2021/22 SCJS will be published at the end of November 2023. This data is expected to be produced annually.
Source: Scottish Crime and Justice Survey 2019/20

In 2019-20, 3.6% of adults experienced two or more incidents of crime, unchanged since 2016/17.
Due to the restrictions put in place during the COVID-19 pandemic, no survey was run during the 2020/21 financial year. The 2021/22 SCJS will be published at the end of November 2023. This data is expected to be produced annually.
Source: Scottish Crime and Justice Survey 2019/20
We all live in a tolerant, more inclusive society

Around three-fifths (61%) of adults did not think any of their characteristics were an influencing factor in their most recent (or only) experience of harassment, unchanged since 2016/17.
Due to the restrictions put in place during the COVID-19 pandemic, no survey was run during the 2020/21 financial year. The 2021/22 SCJS will be published at the end of November 2023. This data is expected to be produced annually. In addition, the questions on this topic have undergone improvement for the 2023/24 survey and the first findings based on these new questions are likely to be published in 2025 at the earliest.
Contact
Email: Justice_analysts@gov.scot
There is a problem
Thanks for your feedback