Vision for Justice in Scotland: measurement framework
Measurement framework to support the delivery of the Vision for Justice in Scotland.
We support rehabilitation, use custody only where there is no alternative and work to reduce reoffending and revictimization
People should only be held in custody where they present a risk of serious harm

The percentage of community disposals to custody disposals (as measured by MI at a charge level, not accused level) was 15.9% vs 10% in the most recent quarter (Q4) of 22/23.
This figure refers to disposals issued at charge level in Scottish criminal courts. It does not tell you how many people received disposals as each accused person can have multiple charges and each charge is concluded individually at court with a disposal. It only includes charges for which the accused is convicted. Disposal data is management information derived from live operational database and as such may be subject to change over time.
This indicator is from the Community Justice Performance Framework. For more information on the indicator, source, and notes on interpretation see the Community Justice Performance Framework – Guidance and Technical Notes.
Source: Scottish Government Justice Analytical Services Criminal Disposals Dashboard (shinyapps.io)

The average daily population in remand was 1,862 in 2021/22.
Source: Scottish Prison Population Statistics 2021-22 - gov.scot (www.gov.scot)

The remand population was 2,225 on 1 September 2023 (28% of the total prison population).
Source: daily management information feed (“SPSMI”) as used in the Justice Analytical Services: safer communities and justice statistics monthly reports

75% (5,438 of 7,203) custodial sentences were of 12 months or less in 2020-21, although note that this year was affected by the pandemic and subsequent court closures and may not be indicative of longer term trends.
The presumption against short sentences was introduced by the Criminal Justice and Licensing (Scotland) Act 2010 and commenced in February 2011. The legislation provided that a court must not pass a custodial sentence of 3 months or less unless it is of the opinion that no other disposal is appropriate. This was extended to sentences of 12 months or less for offences committed on or after 4 July 2019. The presumption is not a ban, and courts are still able to impose prison sentences of 12 months or less.
Changes in custodial sentence lengths pre-date the introduction of the presumption so it is not possible to attribute all the change in the data to the presumption.
Source: Criminal proceedings in Scotland: 2020-2021 - gov.scot (www.gov.scot)

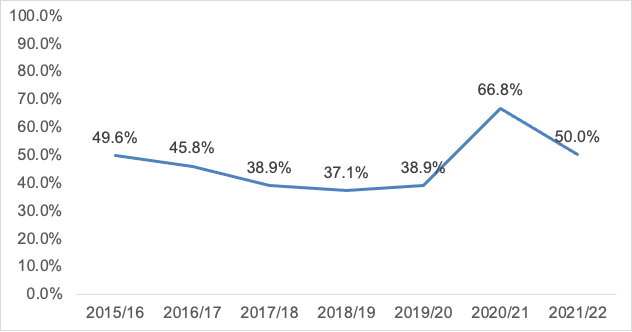
To progress to less secure conditions, an individual has to undergo case management and the level of risk for this decision must be agreed by the SPS and key partners. All convicted population can be eligible once the criteria is met. This process is managed for adult males via Castle Huntly, HMP&YOI Polmont for Young People and HMP&YOI Cornton Vale for the female estate. The population of Castle Huntly (also known as the Open Estate) increased in Q4 22/23 compared to the previous quarter. The monthly average of individuals housed in Castle Huntly was 143 in March, which comprised 50.2% of the spaces available. This is an increase of 10% compared to the 130 individuals in Castle Huntly in December.
Source: SPS Public Information Page (PIP) Quarter 4 2022/2023
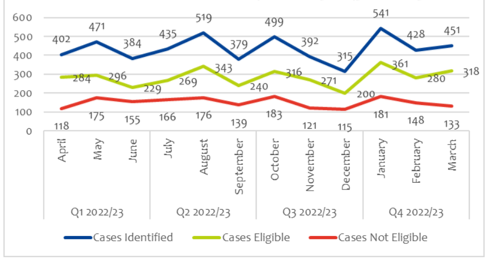
In Q4 22/23 there were a total of 1,420 cases identified which met the basic standard criteria to apply for Home Detention Curfew (HDC). After further checks on those identified 32% (462) of the cases were not eligible; 67% (959) were eligible to apply for HDC and continued through the rest of the process. The figures show that from Q3 22/23 to Q4 22/23 there was a 17.7% increase in cases identified as meeting the criteria to apply for HDC (1,206 in Q3; 1,420 in Q4). There was a 10.2% increase in the cases which were not eligible (421 in Q3; 462 in Q4) and an increase of 21.8% in cases which were eligible (787 in Q3; 959 in Q4).

The total number of individuals who were released on HDC within Q4 22/23 was 63, seven less than Q3 22/23.
Source: SPS Public Information Page (PIP) Quarter 4 2022/2023
We must have access to a range of consistent, effective interventions in our communities
The community payback order (CPO) was introduced by the Criminal Justice and Licensing (Scotland) Act 2010. The CPO replaced provisions for community service, probation and supervised attendance orders for offences committed from 1 February 2011 onward. It is available to all courts, with some restrictions applying to justice of the peace courts in relation to treatment and programme requirements.
The source of this data is justice social work. The percentage of successfully completed orders in trend data is calculated as: [(Number of orders completed successfully plus those subject to early discharge in the financial year)] DIVIDED BY [(Number of orders terminated in financial year) minus (Number of orders terminated in the financial year due to being transferred to another area)].
This trend data allows for revisions, in general they are small changes.
This indicator is from the Community Justice Performance Framework. For more information on the indicator, source, and notes on interpretation see the Community Justice Performance Framework – Guidance and Technical Notes.
Source: Scottish Government: National Statistics: Justice Social Work Statistics – additional tables
We must be supported to improve our health and wellbeing as part of rehabilitation and recovery
The drug treatment and testing order (DTTO) is a high tariff disposal for people with more serious substances use related to their offending, who might otherwise receive a custodial sentence. This order includes the need for regular reviews by the court and for the person to consent to frequent random drug tests throughout the lifetime of the order. These are available to all courts apart from justice of the peace courts. In addition, the less intensive DTTO II was introduced in the Lothian areas (apart from West Lothian) in June 2008 for people committing lower tariff offences at a relatively early stage in their lives. The DTTO II is now also available to be issued in the Highland area and is available from justice of the peace courts.
The source of this data is justice social work. The percentage of successfully completed orders in trend data is calculated as: [(Number of orders completed successfully plus those subject to early discharge in the financial year)] DIVIDED BY [(Number of orders terminated in financial year) minus (Number of orders terminated in the financial year due to being transferred to another area)].
This trend data allows for revisions, in general they are small changes.
This indicator is from the Community Justice Performance Framework. For more information on the indicator, source, and notes on interpretation see the Community Justice Performance Framework – Guidance and Technical Notes.
Source: Scottish Government: National Statistics: Justice Social Work Statistics – additional tables
To ensure greater success in reducing reoffending, we must be supported to integrate into our communities, those who have offended have access to housing which meets their needs and have positive employment prospects and fair work

Voluntary throughcare is available to those who are not subject to statutory throughcare, but who request support while in custody or within 12 months of release.
The source of this data is Justice Social Work statistics, and this indicator is on voluntary throughcare. Voluntary throughcare is available to those who are not subject to statutory throughcare, but who request support from local authorities while in custody or within 12 months of release.
This data is limited to information that is provided and collected from justice social work management systems.
There are other voluntary throughcare services that provide support in prison and after leaving prisons run by third sectors organisations. The Scottish Government wants to work with the Scottish Government funded third sector organisations in the future to increase the scope of this indicator.
This indicator is from the Community Justice Performance Framework. For more information on the indicator, source, and notes on interpretation see the Community Justice Performance Framework – Guidance and Technical Notes.
Source: Justice social work statistics: additional tables from 2004 – current - gov.scot (www.gov.scot)

The Scottish Government publishes bespoke secondary analysis for ‘prison service homelessness’ in the form of data tables, following the release of annual Homelessness statistics publications. This includes data for homelessness applications, by local authority, where the main applicant reports prison as the property type they have been made homeless/threatened with homelessness from. Prison should be recorded where an applicant has given up or lost accommodation for a stay in prison, irrespective of the length of time in prison.
Where the applicant has been staying in accommodation on a temporary basis prior to making a homelessness application, including staying with friends or relatives, for a period of less than six months because he or she had already become homeless prior to the application being made, the property type from which the person became homeless should be recorded, not the temporary accommodation.
This data does not capture individuals who have been released from prison to known accommodation for over 6 months as this ‘known’ accommodation would be recorded as the property type, and not prison.
This trend data allows for revisions, in general the changes are small.
This indicator is from the Community Justice Performance Framework. For more information on the indicator, source, and notes on interpretation see the Community Justice Performance Framework – Guidance and Technical Notes.
Source: Scottish Government: Prison Service Homelessness data tables
We experience less crime and reduced harm from re-offending in our communities

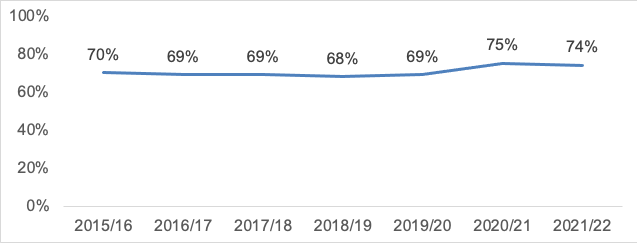
Of the 21,207 individuals convicted at least once in 2020-21 for a crime or relevant offence, 69% had at least one prior conviction in the previous ten years.
Reconvictions data is heavily impacted by the pandemic and so care must be taken in any interpretation of the results. In particular the COVID-affected data is not to be viewed as indicative of any longer term trends. The next couple of years will therefore not be comparable to the most recent years. This measure looks back over a ten year period, so arguably will be limited in reflecting the immediate effects of latest policies.
Source: Reconviction Rates in Scotland: 2019-20 Offender Cohort
People who have offended are supported to maintain and enhance their social networks and links with their families and those with a family member in prison are protected from the negative impacts

In the financial year 2022/23, 108,612 face to face visits were attended. With an average prison population of 7,409 across the year, face to face visits attended per prisoner is 14.66. Compared to last quarter, there was a decrease of 2% in booked visits from 34,261 to 33,547 and a decrease of 0.5% in attended visits from 28,104 to 27,963. The figures remain relatively stable throughout the year though with a variance increase/decrease for booked visits sitting between 0.7 to 2% and attended visits between 0.5 to 1.6%.

In the financial year 2022/23 there have been 34,840 virtual visits attended. With an average prison population of 7,409 across the year, virtual visits attended per prisoner is 4.84. Compared to last quarter, the figures show an increase of 1.6% booked visits from 11,025 to 11,202 and an increase of 2.5% attended visits from 9,038 to 9,265. The figures over the year show that there was an 11% decrease for booked visits and a 10% decrease for attended visits in Q2. However, these figures have recovered by 16.5% and 17.6% respectively in Q3 and have risen slightly in Q4.
Source: SPS Public Information Page (PIP) Quarter 4 2022/2023
Children and young people who have committed crimes are not held in young offenders institutions and have the appropriate support as they transition to adult services

In 2021/22, the average daily population of 16 and 17 year olds continued in its downward trend, falling from 22 in 2020-21 to 14. The reduction in 16 and 17 year olds is observed across the sentenced and untried populations. Between 2020-21 and 2021-22, the sentenced population reduced from seven to three, the untried population from 12 to 10. The convicted awaiting sentence (CAS) population remained stable at around two in both years.
Source: Scottish Prison Population Statistics 2021-22 - gov.scot (www.gov.scot)
Contact
Email: Justice_analysts@gov.scot
There is a problem
Thanks for your feedback