Water, wastewater and drainage: consultation analysis
Summarises the responses that we received on our consultation on the the water, wastewater and drainage principles and considerations in developing policy for the future of the water industry in Scotland in response to the climate emergency.
Annex A – Quantitative analysis data
A full breakdown of the numbers and percentage response to each closed question is detailed below. This does not include responses to free text fields. The numbering used reflects the number used for each closed question in the consultation and as free text questions have been excluded the numbering below includes omissions.
Question 1: Do you agree that Scotland needs to set out a plan to manage our water resources, for now and into the future?
There were 485 responses to this part of the question.
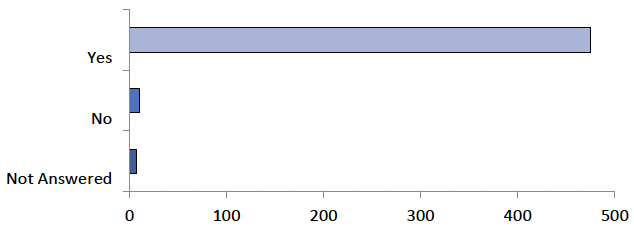
| Option | Total | Percent |
|---|---|---|
| Yes | 475 | 96.54% |
| No | 10 | 2.03% |
| Not Answered | 7 | 1.42% |
Question 2: To what extent do you agree that taking a national view of catchment risks will help better protect drinking water sources from pollutants?
There were 484 responses to this part of the question.
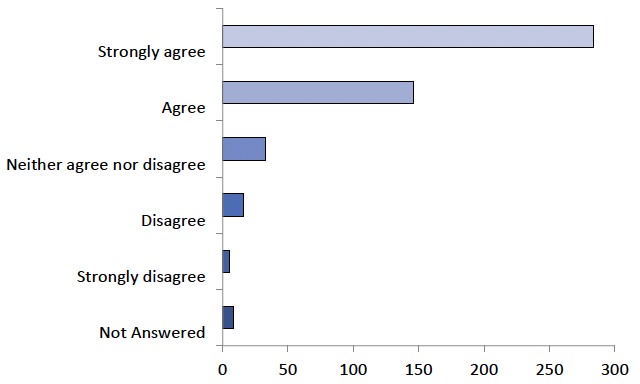
| Option | Total | Percent |
|---|---|---|
| Strongly agree | 284 | 57.72% |
| Agree | 146 | 29.67% |
| Neither agree nor disagree | 33 | 6.71% |
| Disagree | 16 | 3.25% |
| Strongly disagree | 5 | 1.02% |
| Not Answered | 8 | 1.63% |
Question 3: To what extent do you agree or disagree that everyone in Scotland needs to use less drinking water?
There were 475 responses to this part of the question.
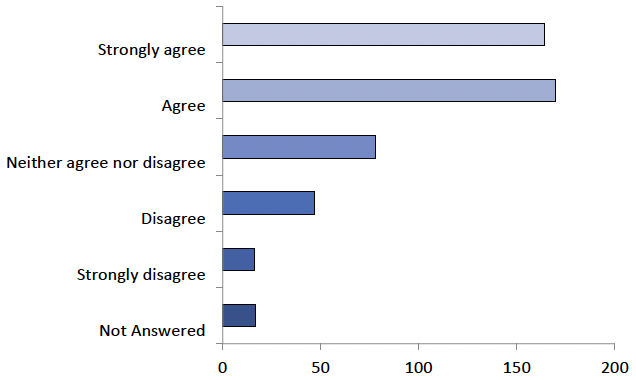
| Option | Total | Percent |
|---|---|---|
| Strongly agree | 164 | 33.33% |
| Agree | 170 | 34.55% |
| Neither agree nor disagree | 78 | 15.85% |
| Disagree | 47 | 9.55% |
| Strongly disagree | 16 | 3.25% |
| Not Answered | 17 | 3.46% |
Question 5: Would you like to know how much water you use in your home?
There were 450 responses to this part of the question.
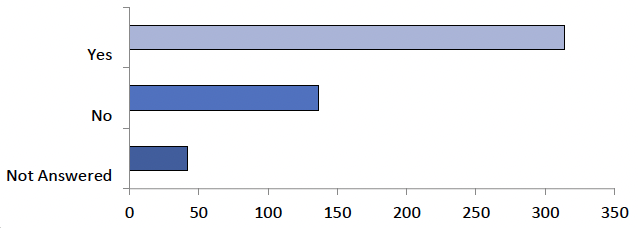
| Option | Total | Percent |
|---|---|---|
| Yes | 314 | 63.82% |
| No | 136 | 27.64% |
| Not Answered | 42 | 8.54% |
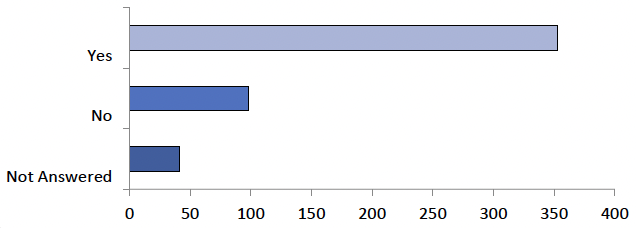
Question 6: Would you seek to reduce your water usage if this avoids building expensive new reservoirs and water treatment works?
There were 451 responses to this part of the question.
| Option | Total | Percent |
|---|---|---|
| Yes | 353 | 71.75% |
| No | 98 | 19.92% |
| Not Answered | 41 | 8.33% |
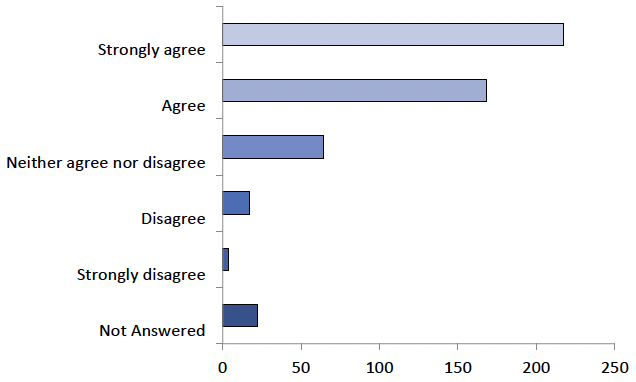
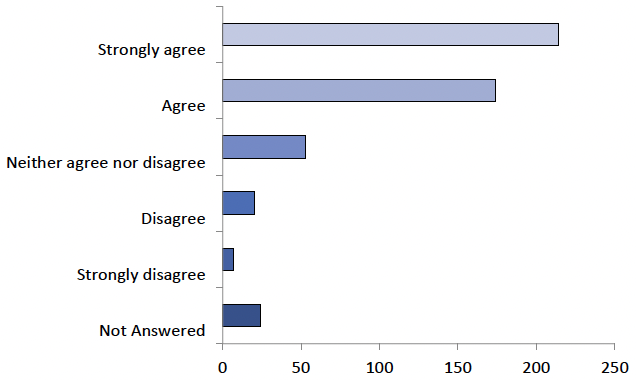
Question 8: To what extent do you agree or disagree that the process for responding to water shortages should be changed so that appropriate action can be taken as soon as it is needed?
There were 470 responses to this part of the question.
| Option | Total | Percent |
|---|---|---|
| Strongly agree | 217 | 44.11% |
| Agree | 168 | 34.15% |
| Neither agree nor disagree | 64 | 13.01% |
| Disagree | 17 | 3.46% |
| Strongly disagree | 4 | 0.81% |
| Not Answered | 22 | 4.47% |
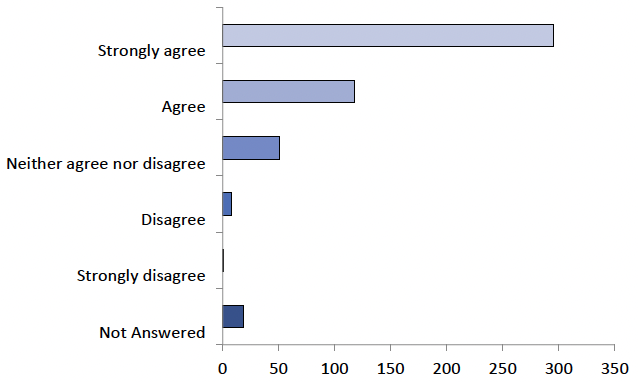
Question 9: To what extent do you agree or disagree that all of Scotland’s plumbing should be made lead-free?
There were 473 responses to this part of the question.
| Option | Total | Percent |
|---|---|---|
| Strongly agree | 295 | 59.96% |
| Agree | 118 | 23.98% |
| Neither agree nor disagree | 51 | 10.37% |
| Disagree | 8 | 1.63% |
| Strongly disagree | 1 | 0.20% |
| Not Answered | 19 | 3.86% |
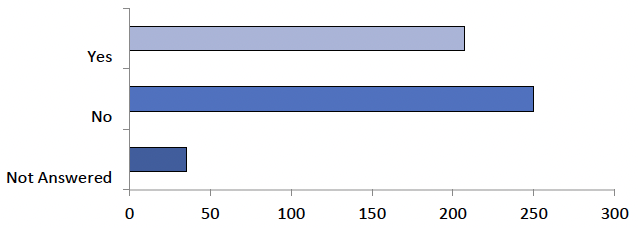
Question 10: Would you know where to get information on how to ensure that your pipes are not affecting your drinking water?
There were 457 responses to this part of the question.
| Option | Total | Percent |
|---|---|---|
| Yes | 207 | 42.07% |
| No | 250 | 50.81% |
| Not Answered | 35 | 7.11% |
Question 11: Do you agree that all drinking water supplies, regardless of size or ownership, should be tested and inspected to ensure that drinking water is safe?
There were 474 responses to this part of the question.
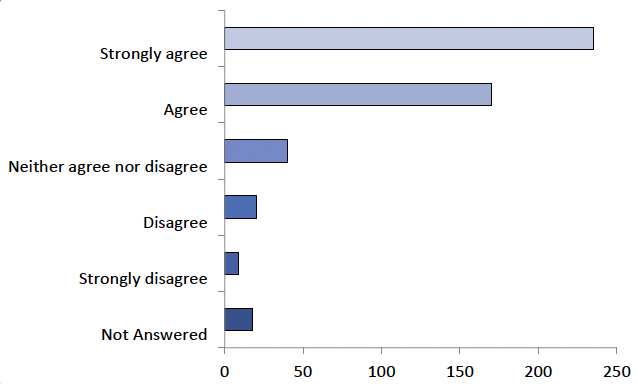
| Option | Total | Percent |
|---|---|---|
| Strongly agree | 235 | 47.76% |
| Agree | 170 | 34.55% |
| Neither agree nor disagree | 40 | 8.13% |
| Disagree | 20 | 4.07% |
| Strongly disagree | 9 | 1.83% |
| Not Answered | 18 | 3.66% |
Question 14: Who do you think has a role in changing how we manage rainwater in Scotland to adapt to the impacts of climate change? (Please select all that apply).
There were 472 responses to this part of the question.
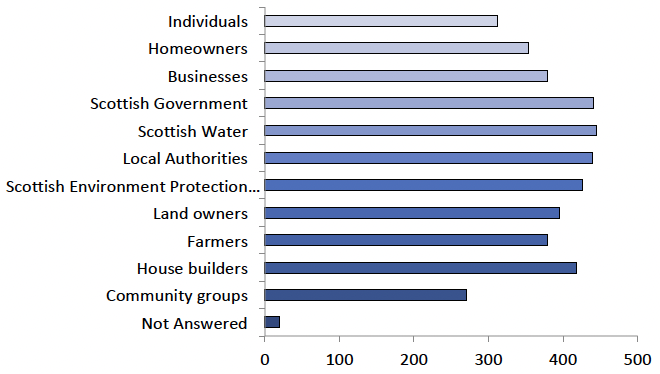
| Option | Total | Percent |
|---|---|---|
| Individuals | 312 | 63.41% |
| Homeowners | 354 | 71.95% |
| Businesses | 379 | 77.03% |
| Scottish Government | 441 | 89.63% |
| Scottish Water | 445 | 90.45% |
| Local Authorities | 440 | 89.43% |
| Scottish Environment Protection Agency (SEPA) | 426 | 86.59% |
| Land owners | 395 | 80.28% |
| Farmers | 379 | 77.03% |
| House builders | 418 | 84.96% |
| Community groups | 271 | 55.08% |
| Not Answered | 20 | 4.07% |
Question 15: To what extent do you agree that you/your organisation have/has a role in changing how we manage rainwater in communities to adapt to the impacts of climate change?
There were 474 responses to this part of the question.
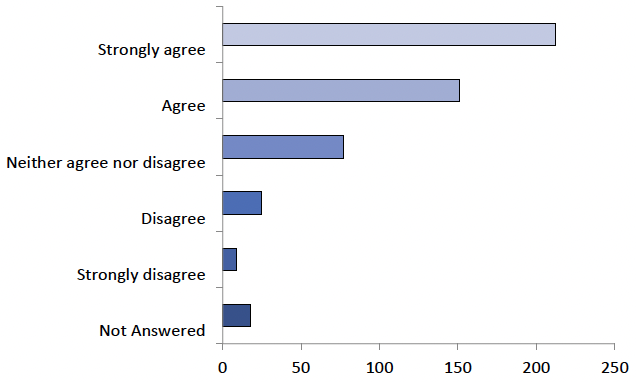
| Option | Total | Percent |
|---|---|---|
| Strongly agree | 212 | 43.09% |
| Agree | 151 | 30.69% |
| Neither agree nor disagree | 77 | 15.65% |
| Disagree | 25 | 5.08% |
| Strongly disagree | 9 | 1.83% |
| Not Answered | 18 | 3.66% |
Question 17: Would you know where to find information on how to best manage rainwater in your property?
There were 455 responses to this part of the question.
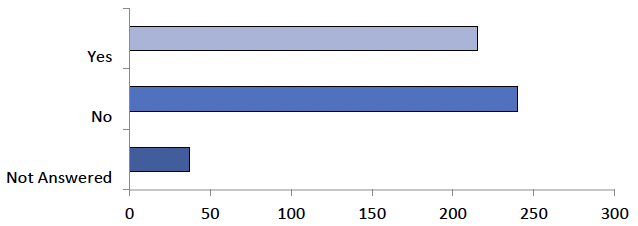
| Option | Total | Percent |
|---|---|---|
| Yes | 215 | 43.70% |
| No | 240 | 48.78% |
| Not Answered | 37 | 7.52% |
Question 18: To what extent do you agree that there is a need to plan, build, maintain and make room for drainage infrastructure to better manage rainwater in our villages, towns and cities?
There were 477 responses to this part of the question.
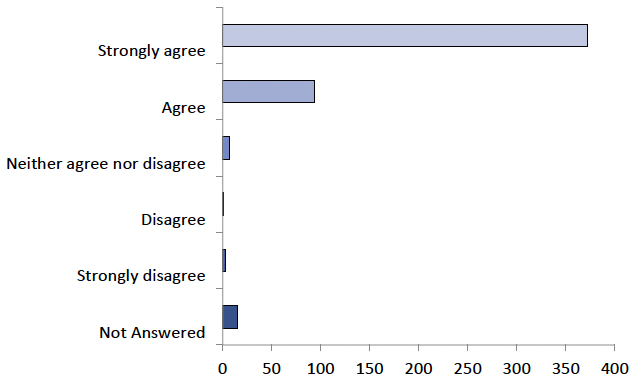
| Option | Total | Percent |
|---|---|---|
| Strongly agree | 372 | 75.61% |
| Agree | 94 | 19.11% |
| Neither agree nor disagree | 7 | 1.42% |
| Disagree | 1 | 0.20% |
| Strongly disagree | 3 | 0.61% |
| Not Answered | 15 | 3.05% |
Question 19: What should Scotland’s drainage systems look like in the future?
There were 477 responses to this part of the question.
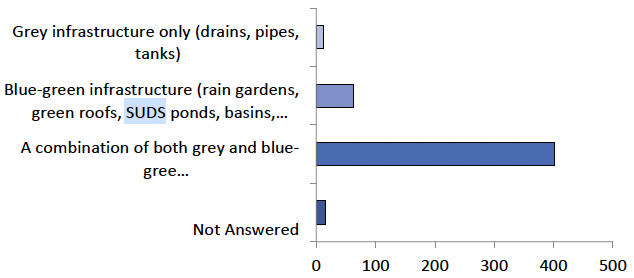
| Option | Total | Percent |
|---|---|---|
| Grey infrastructure only (drains, pipes, tanks) | 12 | 2.44% |
| Blue-green infrastructure (rain gardens, green roofs, SUDS ponds, basins, wetlands, swales, etc) | 63 | 12.80% |
| A combination of both grey and blue-green infrastructure | 402 | 81.71% |
| Not Answered | 15 | 3.05% |
Question 21: Should investment be prioritised to address overflows that have a negative impact in the environment?
There were 472 responses to this part of the question.
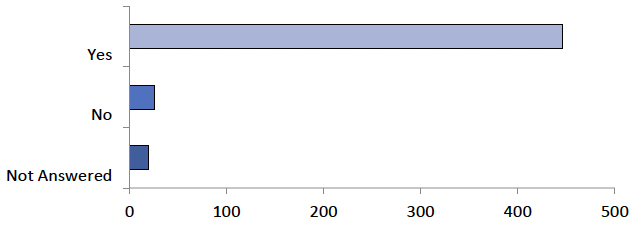
| Option | Total | Percent |
|---|---|---|
| Yes | 446 | 90.65% |
| No | 26 | 5.28% |
| Not Answered | 20 | 4.07% |
Question 22: To what extent do you agree or disagree that more should be done to stop items being disposed of down toilets or drains?
There were 474 responses to this part of the question.
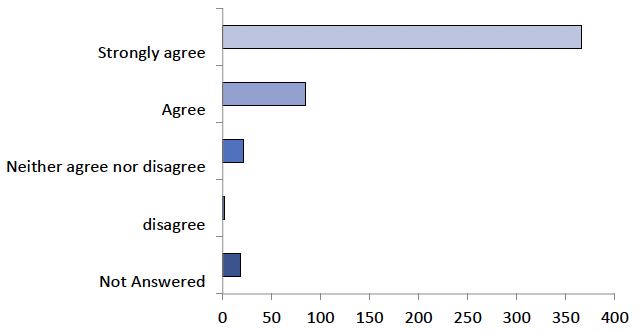
| Option | Total | Percent |
|---|---|---|
| Strongly agree | 366 | 74.39% |
| Agree | 85 | 17.28% |
| Neither agree nor disagree | 21 | 4.27% |
| disagree | 2 | 0.41% |
| Strongly disagree | 0 | 0.00% |
| Not Answered | 18 | 3.66% |
Question 24: It is already an offence for non-household properties to discharge fats, oils and greases to the sewer. Do you agree that offences should be extended to:
- include other pollutants, and specifically plastic?
There were 462 responses to this part of the question.
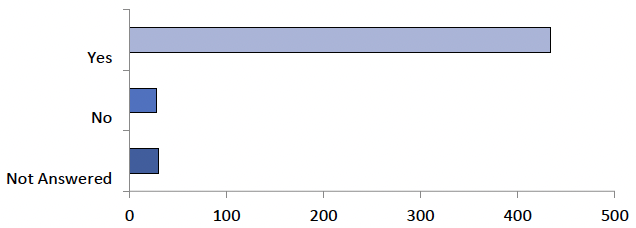
| Option | Total | Percent |
|---|---|---|
| Yes | 434 | 88.21% |
| No | 28 | 5.69% |
| Not Answered | 30 | 6.10% |
- extend the offence to household premises?
There were 447 responses to this part of the question.
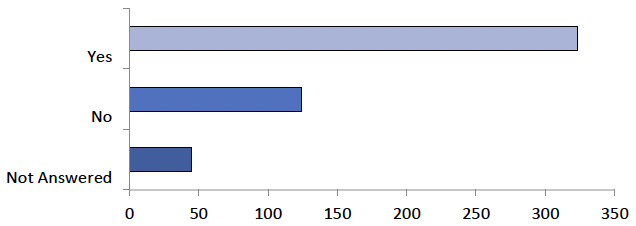
| Option | Total | Percent |
|---|---|---|
| Yes | 323 | 65.65% |
| No | 124 | 25.20% |
| Not Answered | 45 | 9.15% |
Question 25: We currently undertake some monitoring of pollutants, do you agree that we should extend our monitoring of wastewater to look for new pollutants, and monitor pathogens in the community?
There were 475 responses to this part of the question.
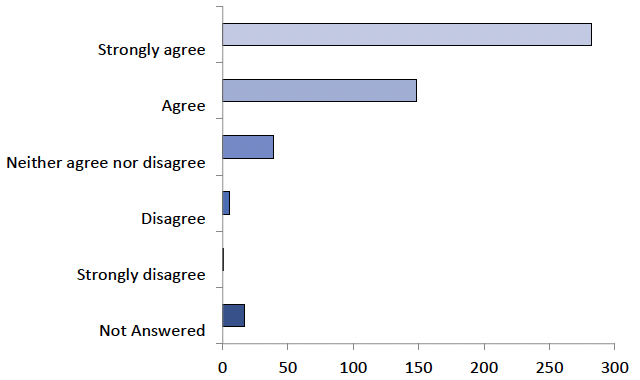
| Option | Total | Percent |
|---|---|---|
| Strongly agree | 282 | 57.32% |
| Agree | 148 | 30.08% |
| Neither agree nor disagree | 39 | 7.93% |
| Disagree | 5 | 1.02% |
| Strongly disagree | 1 | 0.20% |
| Not Answered | 17 | 3.46% |
Question 26: Do you agree that resource recovery is something that Scottish Water should be undertaking?
There were 457 responses to this part of the question.
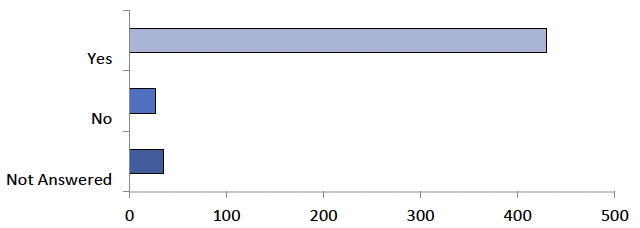
| Option | Total | Percent |
|---|---|---|
| Yes | 430 | 87.40% |
| No | 27 | 5.49% |
| Not Answered | 35 | 7.11% |
Question 27: To what extent do you agree that Scottish Water should be able to use the money it receives from customer charges to invest in resource recovery hubs?
There were 468 responses to this part of the question.
| Option | Total | Percent |
|---|---|---|
| Strongly agree | 214 | 43.50% |
| Agree | 174 | 35.37% |
| Neither agree nor disagree | 53 | 10.77% |
| Disagree | 20 | 4.07% |
| Strongly disagree | 7 | 1.42% |
| Not Answered | 24 | 4.88% |
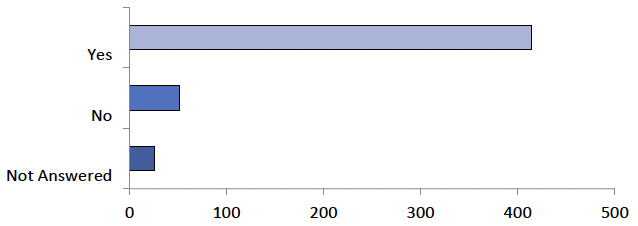
Question 28: Do you agree that all wastewater treatment systems, regardless of size or ownership, should be tested and inspected to ensure that they do not impact negatively on the environment?
There were 465 responses to this part of the question.
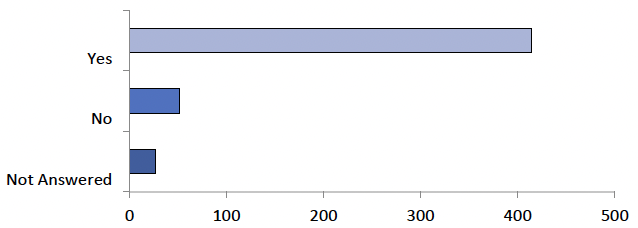
| Option | Total | Percent |
|---|---|---|
| Yes | 414 | 84.15% |
| No | 51 | 10.37% |
| Not Answered | 27 | 5.49% |
Question 30: Do you think that owners of existing private wastewater systems should be required to connect to the public system where connection is possible, beneficial and not expensive?
There were 468 responses to this part of the question.
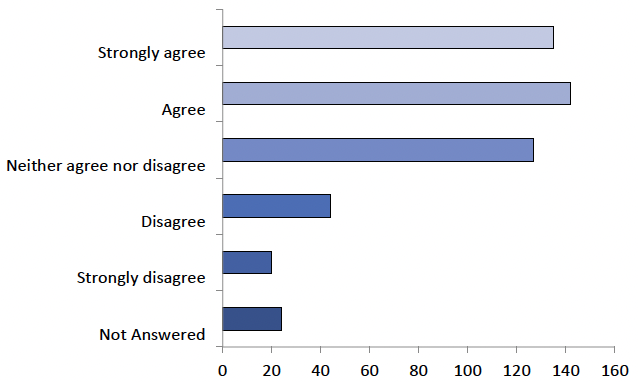
| Option | Total | Percent |
|---|---|---|
| Strongly agree | 135 | 27.44% |
| Agree | 142 | 28.86% |
| Neither agree nor disagree | 127 | 25.81% |
| Disagree | 44 | 8.94% |
| Strongly disagree | 20 | 4.07% |
| Not Answered | 24 | 4.88% |
Question 32: To what extent do you agree that changing our behaviours is essential to limit charge rises?
There were 473 responses to this part of the question.
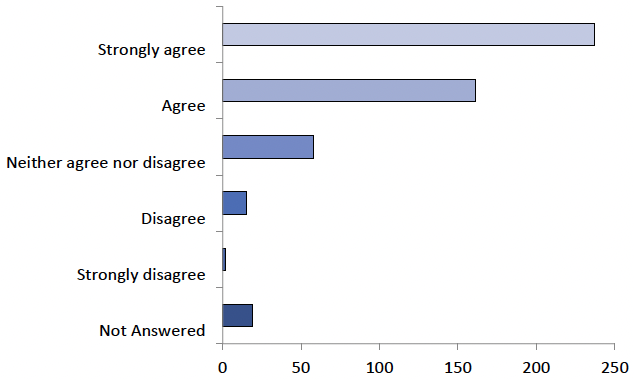
| Option | Total | Percent |
|---|---|---|
| Strongly agree | 237 | 48.17% |
| Agree | 161 | 32.72% |
| Neither agree nor disagree | 58 | 11.79% |
| Disagree | 15 | 3.05% |
| Strongly disagree | 2 | 0.41% |
| Not Answered | 19 | 3.86% |
Question 33: Do you agree that we should recognise that there are three services (water, wastewater and drainage)?
There were 466 responses to this part of the question.
| Option | Total | Percent |
|---|---|---|
| Yes | 414 | 84.15% |
| No | 52 | 10.57% |
| Not Answered | 26 | 5.28% |
Question 34: Do you agree that using Council Tax Bands is the fairest way to charge for services used by households?
There were 431 responses to this part of the question.
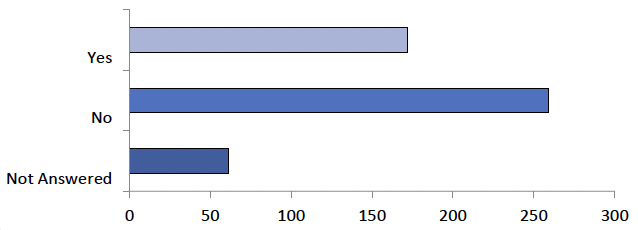
| Option | Total | Percent |
|---|---|---|
| Yes | 172 | 34.96% |
| No | 259 | 52.64% |
| Not Answered | 61 | 12.40% |
Question 37: To what extent do you agree that all households and businesses should pay for roads to be drained?
There were 463 responses to this part of the question.
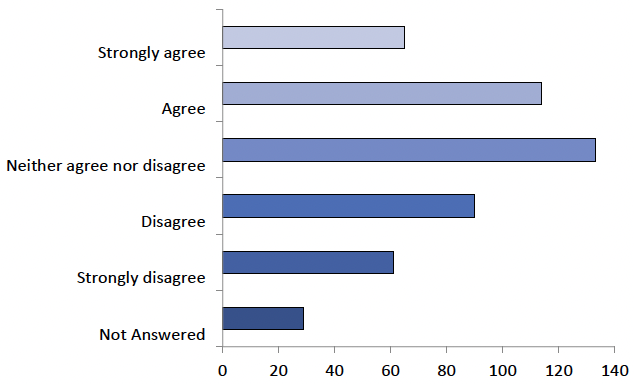
| Option | Total | Percent |
|---|---|---|
| Strongly agree | 65 | 13.21% |
| Agree | 114 | 23.17% |
| Neither agree nor disagree | 133 | 27.03% |
| Disagree | 90 | 18.29% |
| Strongly disagree | 61 | 12.40% |
| Not Answered | 29 | 5.89% |
Contact
Email: waterindustry@gov.scot
There is a problem
Thanks for your feedback