Welfare outcomes for livestock transported on Northern Isles ferry routes
This report from Scotland's Rural College (SRUC) explores the welfare outcomes for livestock transported on the Northern Isles ferry routes and aims to provide objective evidence on the behavioural responses of cattle and sheep to ferry transport from the Northern Isles to Aberdeen.
Objective 3: Welfare outcomes attributable to the sea crossing
Three journeys focusing on store cattle from Orkney and three journeys focusing on store lambs from Shetland were accompanied and the animals’ behaviour and welfare assessed. These stock types were chosen as they represent the major types shipped from the Northern Isles. Lambs varied in weight from store Shetland breed animals of around 25kg to prime lambs (e.g. of Suffolk/Texel cross) of around 40kg. These weights were estimated by eye.
Accompanied journeys in the context of seasonal variation in sea conditions
Two methods were used to place the accompanied journeys into the wider context of the sea conditions which occurred during the late summer to early winter period of 2023: (1) daily records of sea condition; (2) vessel motion recorded on samples of journeys throughout the season.
(1) Sea conditions
Significant wave height (Hs: min, max; m), period (min, max; seconds) and predominant wave direction together with the same attributes for swell were recorded daily from 27th August to 10th December 2023, encompassing the main livestock movement period, using the Windy App (a tool recommended by two of the ships’ masters interviewed). Conditions were recorded at a time of day when vessels would be approximately at the mid-point of their journey. Data from dates when accompanied journeys were made were compared to the seasonal distribution. The accompanied journeys sampled a representative range of sea conditions recorded across the season (Figures 3 and 4). The vessel masters exercised their discretion in restricting the types of livestock transported and in delaying or cancelling journeys according to sea conditions. Therefore, Figures 3 and 4 include days when livestock were not accepted, when restrictions were placed on the class of livestock moved or the journey was delayed or cancelled (see below for a quantification of these events). All four masters interviewed independently gave the same wave height limits as the maximum for accepting cattle (3m) and sheep (4m). These limits are highlighted on Figures 3 and 4. As the sea state data were only recorded as a snap-shot approximately when the vessel would be mid-journey, it is not possible to determine with accuracy exactly what maximum sea state a vessel actually experienced on a given journey. However, matching the available sea state data to the ship movement logs (which include cancellations, delays and limits on animal carriage) gives no reason to doubt that these limits were adhered to. It should be noted that, within the course of a single journey, the wave and swell height, direction and period can fluctuate greatly, and this within-journey complexity is not captured in Figures 3 and 4.
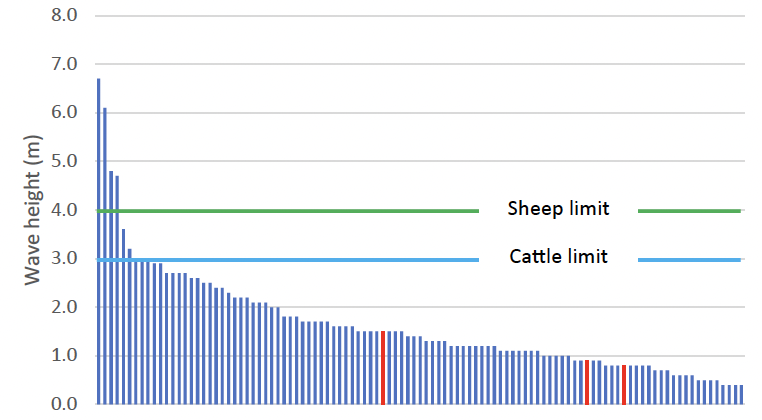
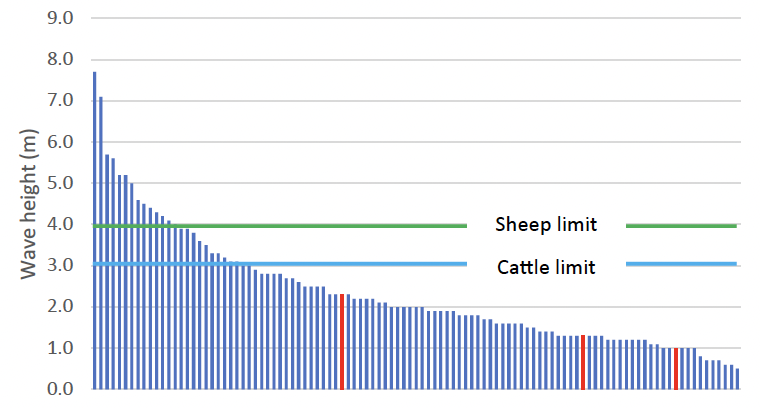
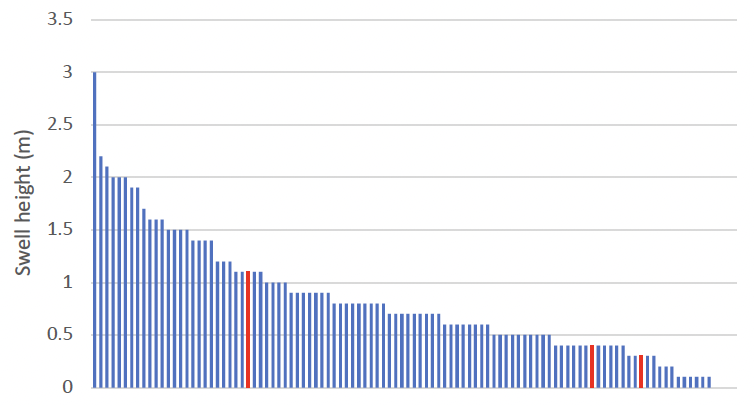
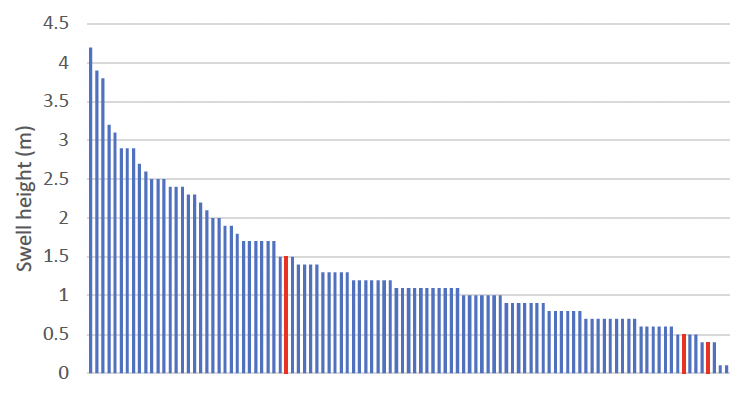
Figure 3 a-d: (a) Minimum significant wave height (Hs); (b) maximum significant wave hight; (c) minimum swell height; (d) maximum swell height in the route between Kirkwall and Aberdeen. Each bar represents a single day. Days are organised from the roughest on the left to calmest on the right. Accompanied journeys are highlighted in red. Sailings were cancelled on the roughest days on the Master’s judgement, and therefore the vessel did not sail on all of the days depicted. On figures a and b ‘Sheep limit’ and ‘cattle limit’ refer to the thresholds indicated independently by four vessel masters as being the maximum wave height beyond which these livestock would denied boarding.
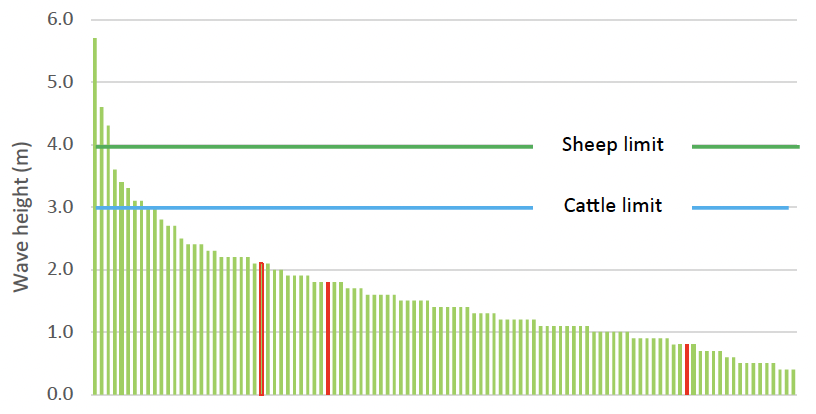
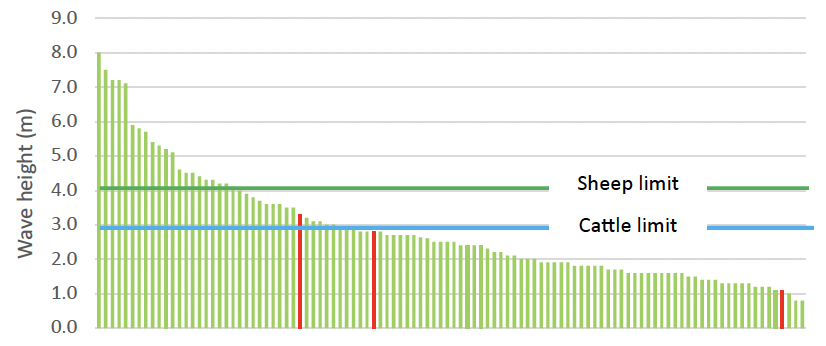
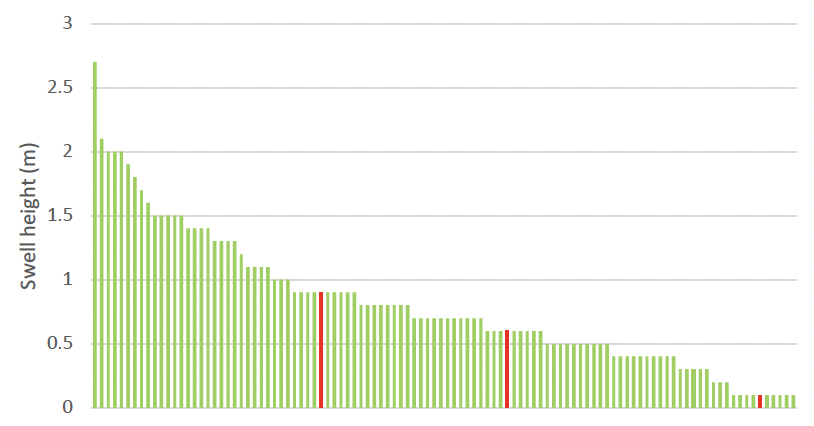
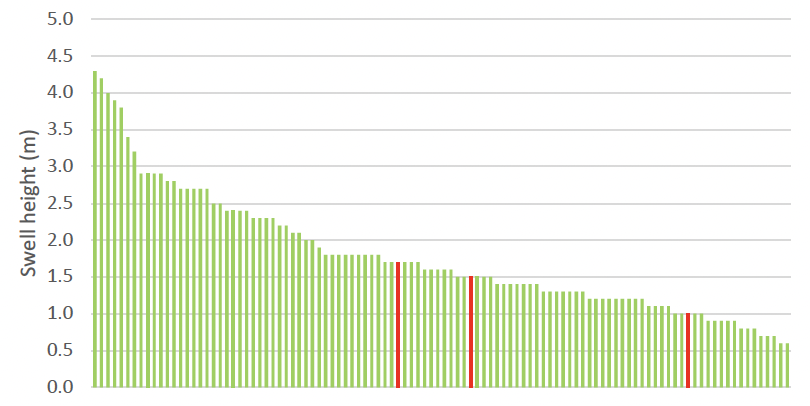
Figure 4 a-d: (a) Minimum significant wave height (Hs); (b) maximum significant wave hight; (c) minimum swell height; (d) maximum swell height in the route between Lerwick and Aberdeen. Each bar represents a single day. Days are organised from the roughest on the left to calmest on the right. Accompanied journeys are highlighted in red. Sailings were cancelled on the roughest days on the Master’s judgement, and therefore the vessel did not sail on all of the days depicted. On figures a and b ‘Sheep limit’ and ‘cattle limit’ refer to the thresholds indicated independently by four vessel masters as being the maximum wave height beyond which these livestock would denied boarding.
Wave and swell direction impact vessel movement. For both the routes from Orkney and Shetland, the wave direction was from east to west and swell direction from east or west or north to south on a disproportionate number of days (Figures 5 and 6). The normally prevailing south-westerly wind direction occurred on relatively few days in the 2023 season and hence days in which waves or swell were from this direction were few. The routes are exposed to rougher conditions for a greater portion of their length when the sea motion is from the east or north as the Scottish mainland offers no protection. Therefore, the 2023 season can be regarded as unusually rough with a greater number of timetable changes than normal. Nine sailings to/from Aberdeen and the Northern Isles were cancelled during the period from the beginning of August to the end of November 2023 (plus an additional three sailings between Orkney and Shetland). Additionally, sheep but no other livestock were accepted on 5 further journeys and no livestock were accepted on three further journeys. The large majority of animals experience a southbound sailing, and all accompanied journeys in this study were southbound. Four of the southbound sailings were cancelled or the master accepted no livestock onboard, and a further two sailings accepted sheep but no other classes of livestock.
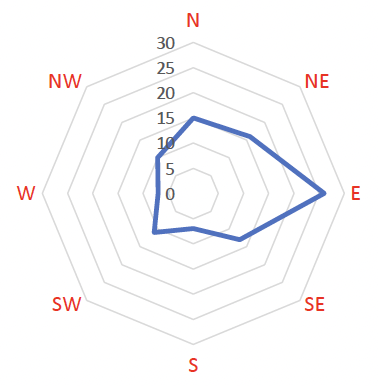
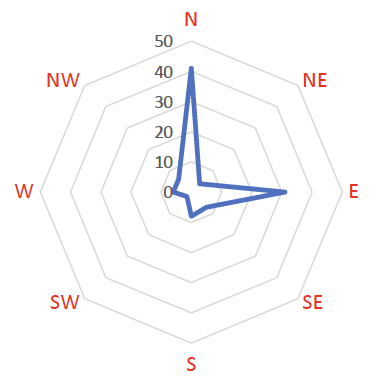
Figure 5 a, b: Predominant wave (a) and swell (b) direction recorded daily for the route between Kirkwall and Aberdeen. Numbers refer to number of days. The blue trace indicates the frequency of days in which the wave or swell direction was from each point of the compass.
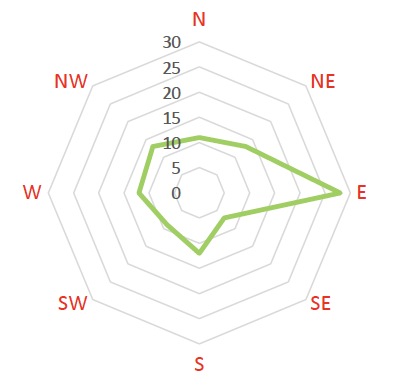
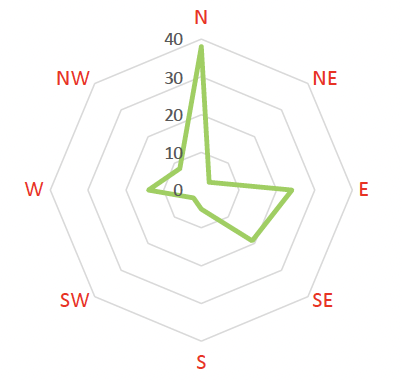
Figure 6 a, b: Predominant wave (a) and swell (b) direction recorded daily for the route between Lerwick and Aberdeen. Numbers refer to number of days. The green trace indicates the frequency of days in which the wave or swell direction was from each point of the compass.
(2) Vessel motion
Lateral and vertical motion both contribute to motion sickness and instability in humans. Roll (tilting motion from side to side), pitch (the vertical movement of the bow and stern around a point of rotation in the centre of the vessel) and heave (linear vertical movement of the vessel; represented by acceleration in the vertical z plane here) movements independently influence motion sickness in humans but a combination of these movements is most problematic. A Lowell Mat1B motion sensor measuring roll and pitch in degrees (as these are rotational axes) and acceleration in g in the x, y and z plane was installed on the vessel during each accompanied journey in which animal behaviour was observed (described below). Blocks of additional motion data (when animals were not accompanied by project staff) with the sensor located at the same point in the ship were accumulated for three periods of approximately two weeks duration each at the beginning, middle and end of the peak livestock transport season. These blocks of data were trimmed to focus on only periods when the vessel was in motion southbound from Orkney (9 unaccompanied journeys) or Shetland (7 unaccompanied journeys). Motion during the accompanied journeys was compared to the distribution from these unaccompanied journeys to place the accompanied journeys into the context of the seasonal variation.
Figure 7 illustrates the pitch and roll motion (in degrees) during accompanied (bold coloured data points) and unaccompanied (lighter coloured data points) from Orkney and Shetland. In both cases the Y axis shows the inter-quartile range representing the degrees of rotation around the resting point. In the case of roll for example, quartile 1 reflects the amount of movement to port where the 25% of records closest to the resting point were found, and quartile 3 reflects the amount of movement to starboard where the 25% of records closest to the resting point were found. An inter-quartile range of 1 degree means that 50% of the records were within plus or minus 0.5 degrees of the resting point, and 50% of the records were at a roll value greater than this. This approach was taken to account for the skewed distribution of the data and to discount erroneous data points caused by short-lived sensor error. The data logger sampled the vessel rotation every tenth of a second and then averaged these observations to give a value per second. In interpreting the small inter-quartile range in roll or pitch, it should be noted that most records made by the logger will have occurred part-way through a roll or pitch cycle and not at the moments of maximum rotation. Furthermore, the effects of a small rotational movement in terms of metres of vertical or horizontal displacement will be amplified as distance increases from the centre of gravity of the vessel. Data are only available for the three accompanied journeys from Shetland and two of the accompanied journeys from Orkney. As Figure 7 indicates, the accompanied journeys were reasonably representative of the variation present in motion recorded during the larger number of unaccompanied journeys.
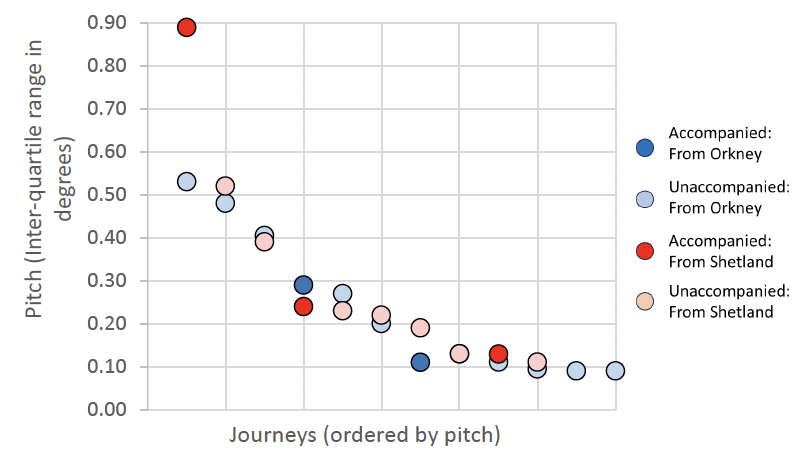
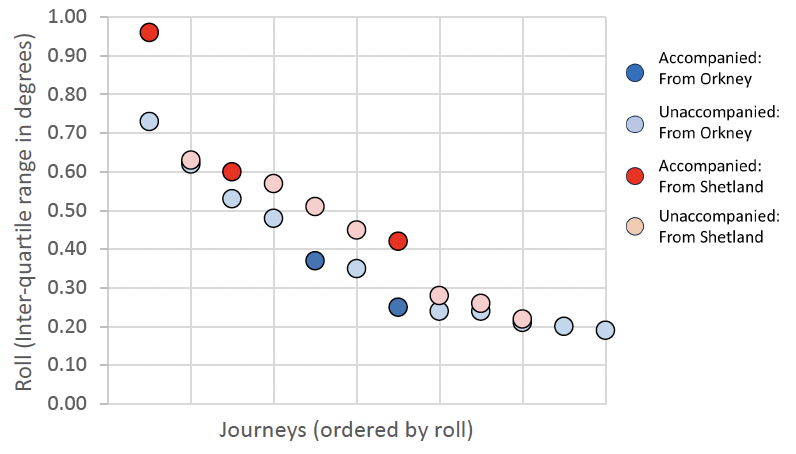
Figure 7 a, b: Vessel motion recorded as pitch (a) and roll (b) for two accompanied journeys from Orkney (motion data was not available for one journey) and three accompanied journeys from Shetland. Motion during a random sample of unaccompanied journeys is provided as a comparison. Measurements were angular motion recorded in degrees at 10th of a second frequency and then averaged per second by the sensor. In a pitch or roll cycle, only a minority of sampling points will have been timed to coincide with the inflexion point of the movement (e.g. maximum roll to starboard/port). Additionally, the metres of vertical or horizontal movement created per degree of roll or pitch will vary according to distance from the centre of gravity of the vessel. Therefore, these values indicate the pitch and roll recorded by the sensor rather than the overall maximum movement in degrees that occurred nor the amount of vertical or horizontal movement in metres experienced. Please see the text for an explanation on how to interpret the inter-quartile range values.
Animal behavioural responses to the ferry journey
Data collection
Data were collected from six livestock cassettes (LCs) during each journey. Cattle were only located on the lower floor of the LCs and two compartments (middle compartment plus one end compartment) were sampled from each of 6 LCs for two journeys and one end compartment was sampled from a final journey. Sheep were located on both the lower and upper floor of the LCs and the central compartment on both the upper and lower floor of each LC was sampled. In total, 30 compartments containing 192 cattle were observed and 36 compartments containing approximately 1236 lambs were observed (mean animals per compartment = 6.4 (cattle) and 34.3 (lambs)). Video equipment failed in one compartment of sheep and two compartments of cattle.
Data collection before the ferry journey: Cattle and sheep were inspected immediately before loading into LCs. Evidence of existing injuries and lameness was recorded to ensure that these were not erroneously attributed to the subsequent journey. Few cattle (n=4) showed signs of injury, and these were minor. Other minor pre-existing injuries may have been masked by coat soiling. Sheep showed no visible signs of injury apart from lameness which did not prevent them walking unassisted into the LCs (n=28).
Data collection during the ferry journey: The following environmental measurements were made: LC location on the vessel; vessel motion using the Lowell Mat1B sensor described above (continuously throughout the journey at a frequency of 10 Hz); acceleration of the sampled LCs (g in the x, y and z planes) using Omni MSR sensors (continuously throughout the journey; 4 times per second); temperature and humidity within the lower compartment of five LCs per journey (continuously; every 5 minutes); temperature and humidity on the exterior of one LC per journey (continuously, every 5 minutes); sound (for the first 9 hours of 4 journeys, every second). Attempts were made to sample ammonia at the end of journeys immediately before docking but repeated equipment failure prevented collection of meaningful data. Other gases (e.g. carbon dioxide, carbon monoxide, hydrogen sulphide) were deemed unlikely to be significantly elevated based on previous transport research and were not sampled.
Observations of animals from video images: Animal behaviour was recorded from video images of 1 minute duration sampled every 20 minutes from the time that the vessel departed until unloading in Aberdeen (a mean of 32 sample points per LC for journeys from Orkney and 46 from Shetland). The behaviours listed in Table 1 below were recorded by scan sampling from these segments of video, and involuntary movements caused by vessel motion (described in Table 2 below) were recorded by continuous observation of the same video segments. Analysis of video clips was performed by a single observer. It should be noted that the low roof height in the lower compartments of the LCs prevented a comprehensive view of the cattle. Most significantly, this prevented a view of the drinkers. Live observations by frequent visits to the cargo decks at sea was not feasible or allowable for safety reasons.
Data collection after the ferry journey: Animals were observed for obvious signs of injury when unloaded. In reality this was challenging as the stocking density in the lairage pens was high. Many cattle and most lambs were unloaded from the LC and immediately moved onto waiting livestock vehicles within 1 to 5 minutes of unloading. Observations were not made from these animals. Those animals from the focal LCs which remained in the lairage for more than 5 minutes were observed by scan sampling every 5 minutes for two hours (or until onward travel if this occurred within 2 hours of entering the lairage) for the following behaviours: drinking, lying, ruminating (recorded as a proportion of those animals whose mouth could be readily seen). Food was not provided and therefore feeding was not recorded. Vocalisations could not be reliably attributed to specific pens of animals and were not recorded.
Statistical analysis approach: The proportion of visible animals exhibiting each behaviour from the videos recorded during the ferry journey was quantified at each observation time (i.e. every 20 minutes). From this, the average proportion was calculated for each LC for the journey. The data did not meet the assumptions of parametric analysis and Kruskal Wallis tests were used to estimate the effect on animal behaviour of (a) journey conditions and (b) location of the LC in the vessel. Kruskal Wallis tests are analogous to analyses of variance on ranked data. To account for the risk of type I errors (i.e. false positive significant effects) resulting from performing multiple statistical tests, Bonferroni corrections were applied to increase the stringency of the p value accepted as statistically significant. It should be noted that each journey was unique (e.g. a unique combination of temperature, duration waiting before boarding the vessel, sea conditions etc). The sample size did not allow the relative contributions of each of these environmental determinants of animal behaviour to be disentangled. Additionally, Spearman rank correlations explored the relationship between the proportion of animals standing or lying and acceleration (g) of the LC recorded in the x, y and z planes.
Contact
There is a problem
Thanks for your feedback