Welfare outcomes for livestock transported on Northern Isles ferry routes
This report from Scotland's Rural College (SRUC) explores the welfare outcomes for livestock transported on the Northern Isles ferry routes and aims to provide objective evidence on the behavioural responses of cattle and sheep to ferry transport from the Northern Isles to Aberdeen.
Results
Ambient conditions: During the period that the vessel was at sea, the ambient temperature in the LCs was higher than that immediately outside of the LCs. The temperature recorded immediately outside of one sentinel LC varied substantially according to the journey (gold symbols in Figure 8 below). The temperature recorded at this location was a median or 23.8, 20.1 and 13.8°C for the August, September and November cattle journeys and 17.4, 15.9 and 13.8°C for the August, September and October lamb journeys. Temperature was also recorded by the Mat1 motion sensor located approximately 10m from the closest LC and this showed similar deck temperature variation by journey, although 1-2°C cooler than the sensor attached to the exterior of the sentinel LCs.
Only two LCs were located in the lower hold of the vessel (one on each of two journeys from Orkney). The average temperature recorded within these two LCs was within 0.5°C of the temperature of other LCs on the same journey located on the main deck. Five LCs with available temperature data were located on the main deck surrounded by LCs on all sides, distributed between two journeys from Orkney and two from Shetland. Contrary to what was expected, the temperature within these centrally located LCs was, on average, 0.6°C cooler than within other LCs.
Temperature within the LCs was affected by the month in which the journey took place (Figure 8). For half of the cattle LCs, the median temperature was 25°C or above which approximately corresponds to the upper limit of the thermoneutral zone for cattle of this weight and is the limit recommended by EFSA for cattle during transport. For lambs, temperature was only recorded inside the lower deck of the LC and not on the top deck, but in most LCs the median was below 20°C.
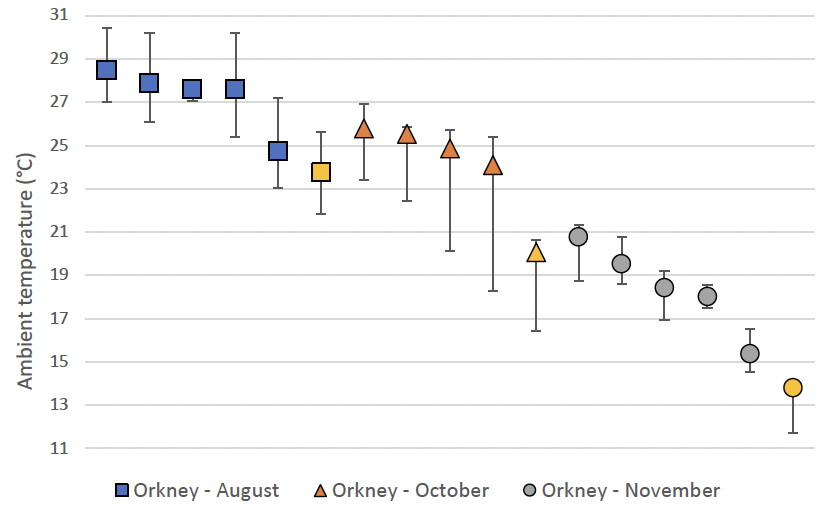
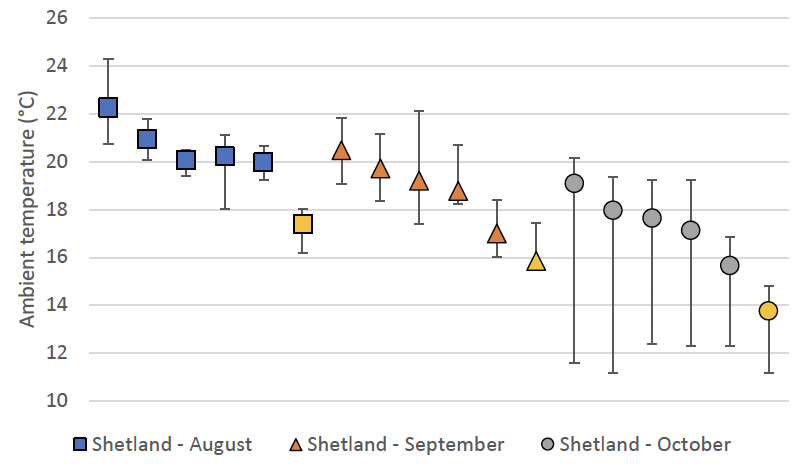
Figure 8 a, b: Median (symbol), minimum and maximum (whiskers) ambient temperature inside LCs during three journeys from (a) Orkney and (b) Shetland between the ship departing and docking. Each data point is a separate LC. Gold symbols represent temperature recorded outside of the LC as a measure of deck temperature. All other symbols represent temperature recorded within the LC. For LCs with lambs, temperature was only recorded on the lower deck of the LC.
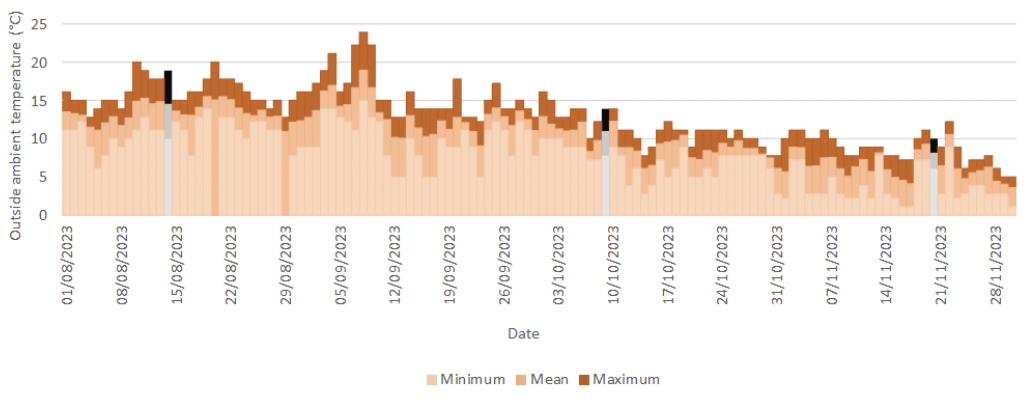
To give context to the temperatures recorded during the three cattle journeys from Orkney, the minimum, mean and maximum daily outdoor ambient temperatures on the journey dates were compared with the broader period from the start of August to the end of November 2023 (Figure 9). Data were extracted from an independent weather station in Kirkwall as Met Office data for 2023 were not available in the MIDAS database at the time of writing. The available data agree closely with ambient temperatures recorded by the temperature logger fitted to the exterior of one sentinel LC per journey before cattle entered the LC. The journey with the warmest average temperature recorded within the LCs and during which the majority of rapid breathing was observed occurred in August. The specific date was amongst the warmest of the period considered, although six days had greater maxima.
Humidity is defined as the mass of water vapour per unit of air volume. Conventionally, humidity is quantified by the relative humidity which is a relative quantity.
Relative Humidity is defined by the ratio:
RH = (Water Vapour Pressure / Saturation Water Vapour Pressure) x 100%
The relative humidity is a consistent measurement of the humidity only if combined with the corresponding temperature. This quantity represents the relative amount of moisture that can be held by a sample of air at a specific temperature.
In animal environments, such as during transportation, as air dry bulb temperature increases there is an increased demand for heat loss from the animals in order to avoid increases in deep body temperature. This is often achieved by increasing evaporative heat loss, e.g. panting, or sweating which adds water vapour to the local air. So, in such situations the local absolute humidity increases but RH potentially increases as well dependent upon the balance between increased addition of water and the rise in temperature. Thus, whilst caution must be exercised in the interpretation of RH values in the absence of the accompanying dry bulb temperature, RH can still be a useful indicator of the local humidity load.
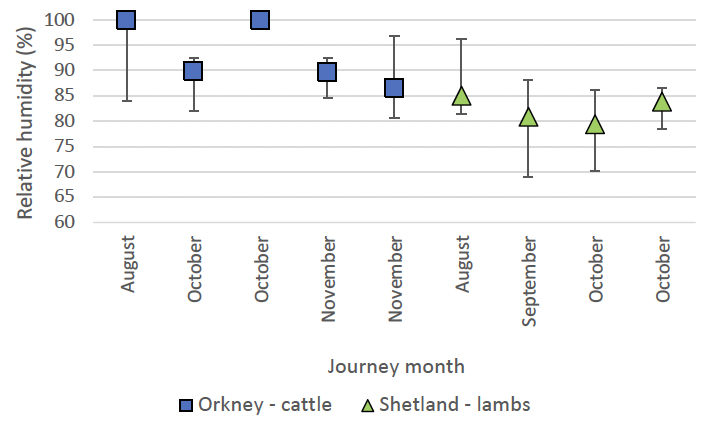
Relative humidity was consistently high (Figure 10), particularly within LCs containing cattle, which will have increased the heat load associated with the ambient temperature.
The ambient temperature and relative humidity inside LCs were fairly stable during the period that the LCs were on the vessel, but showed a marked increase at the point of boarding and a decrease at disembarkation (Figures 11 and 12).
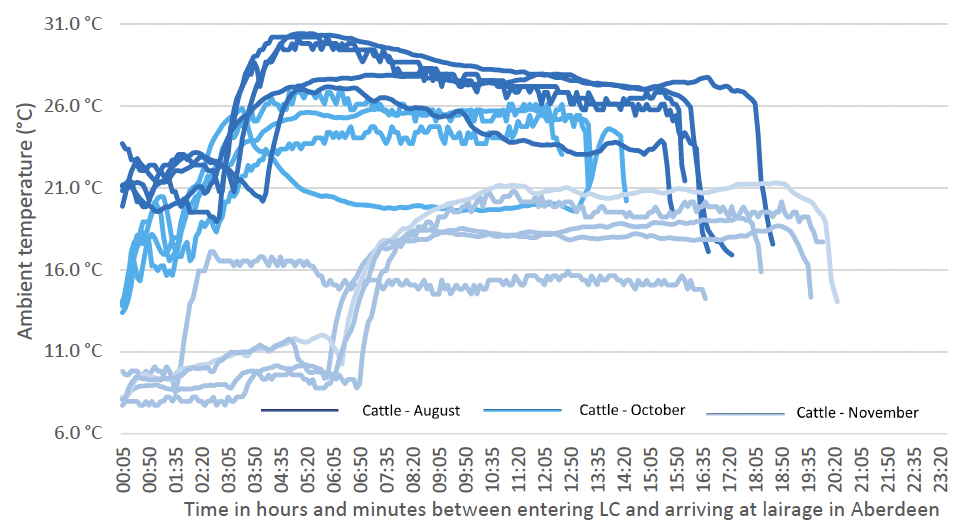
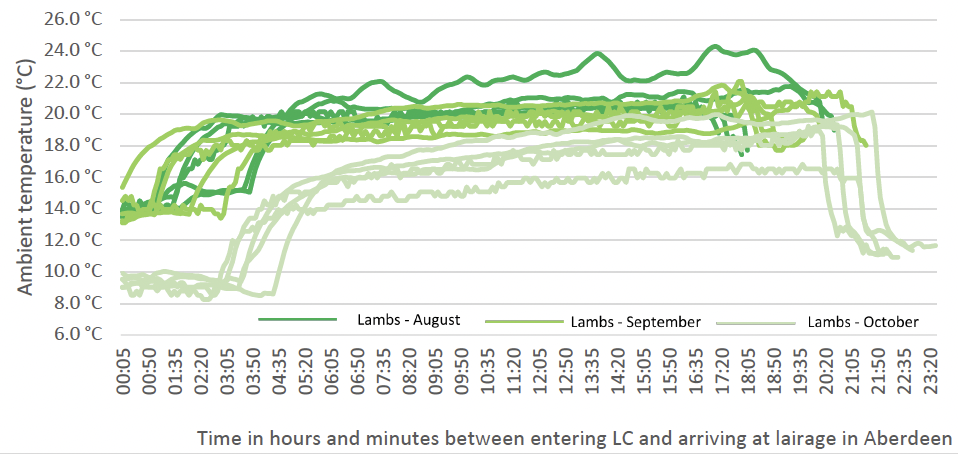
Figure 11: Ambient temperature profiles inside LCs with (a) cattle and (b) lambs recorded at 5 minute resolution from entry to the LC to arrival at the lairage in Aberdeen, including time in LC before boarding.
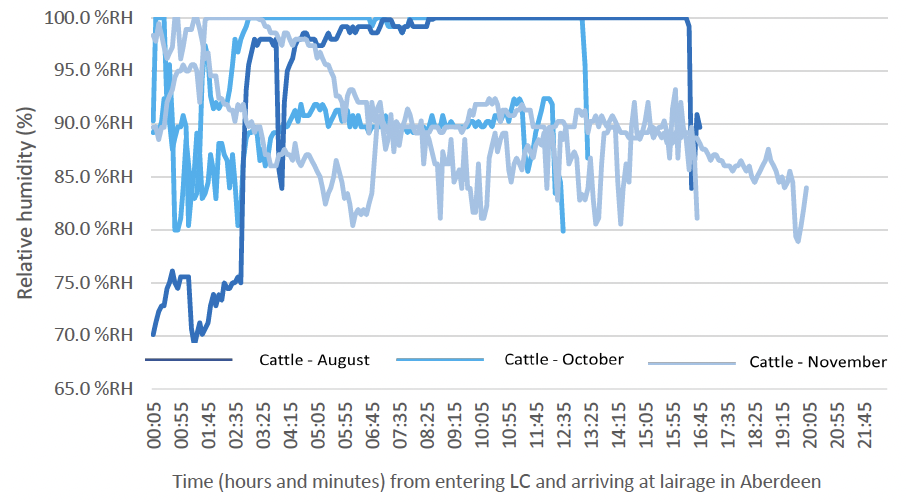
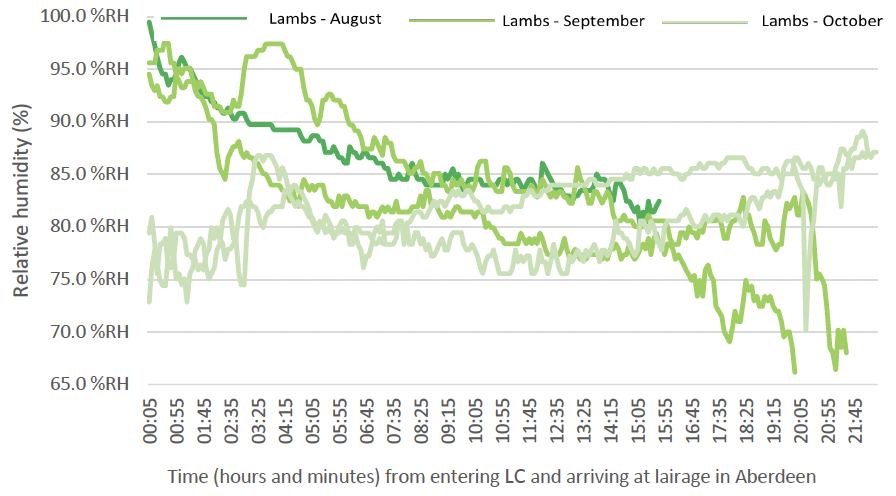
Figure 12: Relative humidity profiles in LCs with (a) cattle and (b) lambs recorded at 5 minute resolution from entry to the LC to arrival at the lairage in Aberdeen, including time in LC before boarding.
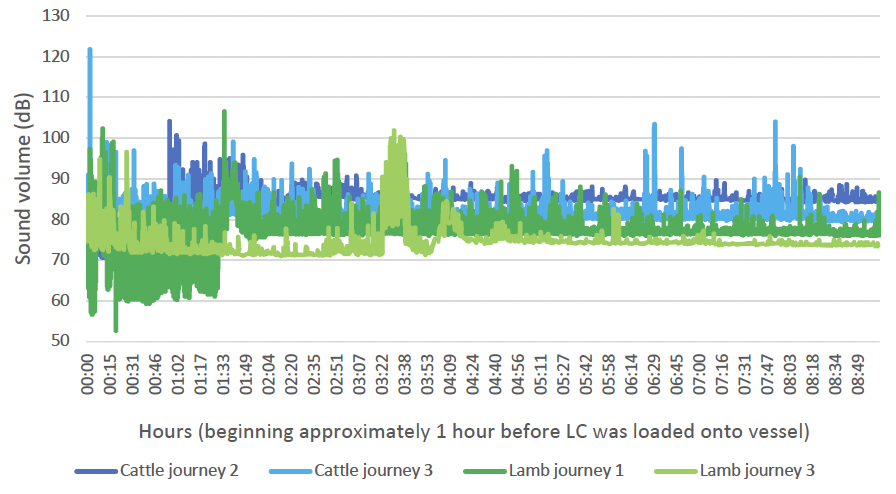
Sound recordings were made at 1 second frequency from approximately 1 hour before the LC was loaded onto the vessel until the logger’s storage capacity was reached (just under 9 hours). The logger was positioned near a ventilation opening on one LC on each of four journeys (two with cattle; two with lambs). All four LCs were located on the main deck of the vessel. The mean sound volume was 81 and 84dB on the two cattle journeys and 74 and 76dB on the two lamb journeys (Figure 13). To place these values in context, The Control of Noise at Work Regulations (2005) require employers to perform risk assessment when employees are exposed daily or weekly average sounds >80dB and to provide hearing protection at >85dB. In the cattle LCs, the peak noise level was possibly created by animals kicking the metal sides of the cassette.
Journey duration and food and water availability: Animals were typically sold at the Kirkwall or Lerwick mart in the morning or early afternoon and loaded into LCs during the afternoon or evening before the vessel sailed in the evening or night. Cattle spent a mean of 4 hours 46 minutes between arriving at the port lairage and boarding the vessel. No cattle were observed to use the nipple drinkers in the lairage. The exact time of arrival of lambs at the lairage is unknown but many were seen to arrive in the morning prior to boarding the vessel in the evening, during which time water was unavailable.
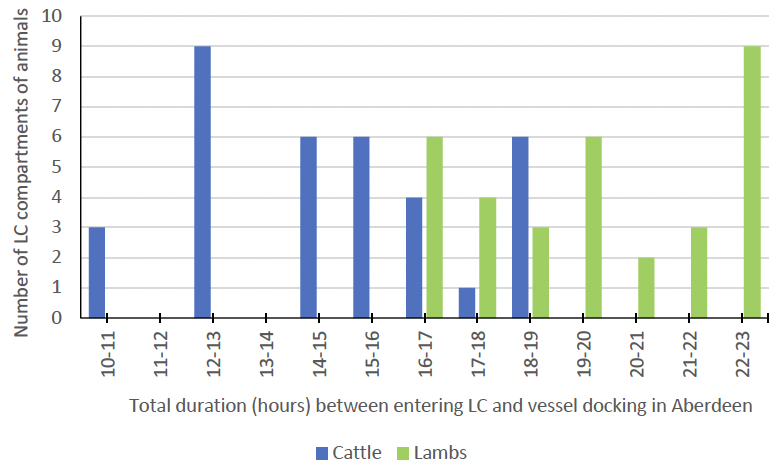
Cattle spent a mean of 14 hours and 54 minutes between entering the LC and the vessel docking in Aberdeen, whilst lambs spent a mean of 19 hours and 40 minutes (an additional period, typically of between 10 minutes and 2 hours was required between the vessel docking and the animals being unloaded from the LC). There was considerable variation around these means as shown in Figure 14. The mean duration between the animals entering the LC and the LC being loaded onto the vessel was 3 hours and 0 minutes for cattle and 4 hours and 54 minutes for lambs.
Hay in all studied lamb LCs was consumed before docking in Aberdeen. Hay was available for a mean of 3 hours and 4 minutes from entry to the LC, leaving a mean of 16 hours and 36 minutes between it being consumed and docking in Aberdeen. The lairage in Aberdeen does not provide food. For cattle, 25 of the 35 studied LC compartments had hay remaining when the vessel docked in Aberdeen. Of the remaining 10 compartments, the hay was fully consumed within a mean of 5 hours and 47 minutes after entering the LC, and 10 hours and 21 minutes before docking in Aberdeen. A long period without food for a grazing ruminant is unnatural and would reasonably be expected to induce some degree of hunger. It is acknowledged that withdrawal of food before transport, usually to slaughter, is sometimes practiced. As most of the animals transported from the Northern Isles were destined for onward travel to farms rather than slaughter, provision of additional hay is likely to be preferable unless future research indicates that it contributes to motion sickness or other negative animal welfare outcomes.
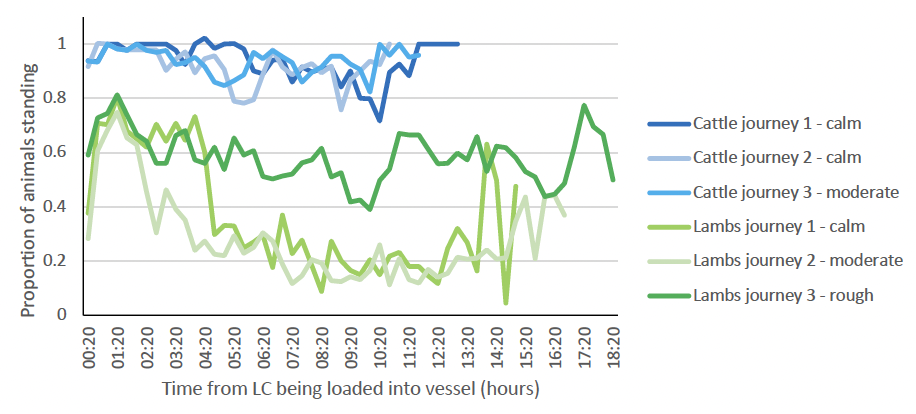
Animal behaviour: On average, around 95% of cattle were observed to be standing at any moment in time (Table 1 and Figure 15) which is unusual behaviour for a species which shows high motivation to lie after a period of standing. This is a substantially greater proportion of time spent standing than observed when cattle are at pasture or housed indoors in a building when around a quarter to a third of daylight time is spent lying. It is also higher than the amount of standing seen in other transported animals (e.g. beef cattle of a mean 269 kg weight were observed to lie for 63.5% of the time when transported for 23 hours by sea from Ireland within livestock road vehicles at 8-11°C). Observations of eating and ruminating were uncommon. A lack of rumination may have resulted from a reduced food intake, but rumination has also been reduced in previous studies that imposed movement in different planes and has been suggested to indicate motion sickness.
Rapid breathing was observed in the cattle, but disproportionately so in one journey (see below). Open-mouthed panting, however, was not observed. The drinkers were only visible in around 40% of the 1 minute video segments for the cattle as the animals blocked the line-of-sight of the camera. However, drinking was not observed when the drinkers were visible. Eating was uncommon in all three cattle journeys and largely absent in two journeys, although, as noted above, hay was fully consumed in some LCs. Some of the hay consumption may have occurred before the LC was loaded onto the vessel.
Lambs lay considerably more often than cattle, and with the exception of one journey (see below), lay for the majority of the journey. As described above, available hay was consumed by the lambs whilst waiting for the LC to board the vessel or during the early hours of the sailing. The drinker was visible to the camera, but drinking and ruminating were largely absent. Signs of rapid breathing were less common in lambs.
The effects of vessel motion on involuntary movements of cattle and lambs are described below.
| Cattle | Lambs | |||
|---|---|---|---|---|
| Median | Inter-quartile range | Median | Inter-quartile range | |
| All standing behaviours | 0.95 | 0.85-0.99 | 0.39 | 0.32-0.56 |
| Stand idle | 0.76 | 0.61-0.81 | 0.33 | 0.24-0.51 |
| Stand rapid breathing | 0.08 | 0.01-0.25 | 0.04 | 0.01-0.06 |
| Stand ruminating | 0.06 | 0.05-0.11 | 0.01 | 0.01-0.02 |
| Stand eating | 0.00 | 0.00-0.01 | 0.00 | 0.00-0.01 |
| Stand drinking | 0.00 | 0.00-0.00 | 0.00 | 0.00-0.00 |
| All lying behaviours | 0.05 | 0.00-0.13 | 0.61 | 0.39-0.67 |
| Lying idle | 0.04 | 0.04-0.11 | 0.53 | 0.38-0.60 |
| Lying ruminating | 0.00 | 0.00-0.01 | 0.06 | 0.01-0.07 |
| Lying rapid breathing | 0.00 | 0.00-0.00 | 0.01 | 0.00-0.02 |
| Vocalising | 0.00 | 0.00-0.06 | 0.00 | 0.00-0.00 |
Effect of journey conditions on animal behaviour: Only one animal was observed to fall. Other involuntary responses to motion occurred rarely considering the quantity of video footage analysed combined with the number of animals viewed. Involuntary adjustment of position and involuntary contact with walls or other animals were absent on calm journeys and, as expected, most common on the roughest journey (from Shetland; Table 2).
Around a quarter of cattle had rapid breathing during one journey (the warmest; Table 2). Around two-thirds of lambs were observed to be lying during the calm and moderate journeys but this dropped to around a third during the rough journey. Lambs were observed to use the drinker infrequently and meaningful statistical analysis was not possible.
| Cattle from Orkney | Lambs from Shetland | |||||||
|---|---|---|---|---|---|---|---|---|
| Journey | p | Journey | p | |||||
| 1 | 2 | 3 | 1 | 2 | 3 | |||
| Sea conditions: | Calm | Calm | Moderate | Calm | Moderate | Rough | ||
| Median ambient temperature within LC (°C): | 27.3 | 25.1 | 18.4 | 20.7 | 19.0 | 17.5 | ||
| Median relative humidity (%) | 100 | 95.0 | 88.1 | 85.0 | 80.9 | 81.7 | ||
| Involuntary response to motion (counts) | ||||||||
| Involuntary adjustment of position | 0 | 0 | 2.8/hr (n=16) | 0 | 9.1/hr (n=87) | 13.9/hr (n=126) | ||
| Involuntary contact with walls or other animals | 0 | 0 | 2.8/hr (n=16) | 0 | 5.5/hr (n=53) | 6.2/hr (n=56) | ||
| Falls | 0 | 0 | 0 | 0 | 0.1/hr (n=1) | 0 | ||
| All standing behaviours | 0.97 | 0.94 | 0.95 | 0.694 | 0.38 | 0.31 | 0.62 | 0.000 |
| Stand idle | 0.62 | 0.76 | 0.80 | 0.001 | 0.30 | 0.23 | 0.60 | 0.001 |
| Stand rapid breathing | 0.24 | 0.07 | 0.01 | 0.000 | 0.05 | 0.04 | 0.02 | 0.103 |
| Stand ruminating | 0.08 | 0.06 | 0.06 | 0.286 | 0.016 | 0.008 | 0.009 | 0.004 |
| Stand eating | 0.000 | 0.006 | 0.000 | 0.079 | Not analysable | |||
| Stand drinking | Not analysable | Not analysable | ||||||
| All lying behaviours | 0.03 | 0.06 | 0.05 | 0.898 | 0.62 | 0.68 | 0.38 | 0.000 |
| Lying idle | 0.03 | 0.06 | 0.03 | 0.915 | 0.55 | 0.60 | 0.36 | 0.000 |
| Lying ruminating | 0.00 | 0.00 | 0.00 | 0.987 | 0.07 | 0.06 | 0.009 | 0.000 |
| Lying rapid breathing | Not analysable | 0.01 | 0.03 | 0.00 | 0.000 | |||
| Vocalising | Not analysable | Not analysable | ||||||
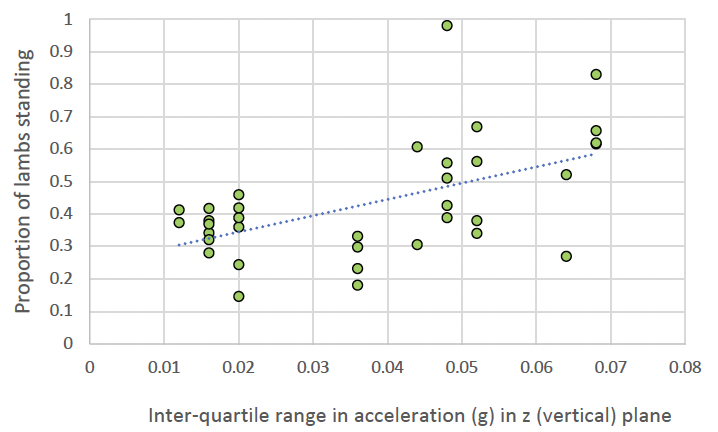
The linear acceleration in the x, y and z plane, measured in g, was slight. This reflects that motion on the sea is typically gradual, unless heading into oncoming waves/swell. The maximum acceleration was measured in the z (vertical) plane corresponding to heave of the vessel together with the vertical movement associated with pitch and roll. Even in this plane the median was close to 1g (reflecting a resting body on the earth’s surface) and the inter-quartile range was only 0.07g for journeys from Orkney and 0.04g for journeys from Shetland. As the median was close to zero motion, the inter-quartile range was used for analysis of the association between x, y and z plane acceleration and animal behaviour. For cattle, no significant correlation was found between the proportion of animals standing and acceleration in the x, y or z plane (Spearman’s rho ranging from r=0.18-0.30; p=0.194-0.428). For lambs, a larger inter-quartile range in acceleration in the vertical plane (indicating greater deviation from 1g and greater heave) was associated with a greater proportion of animals standing (Spearman’s rho r=0.49, p=0.003; Figure 16). Acceleration in the x and y planes was not correlated with standing behaviour in lambs.
Effect of deck location on animal behaviour: Deck location was firstly categorised as being on the main deck or lower hold (the lowest cargo deck) and, in the case of the main deck towards the bow, amidships or stern. All LCs from Shetland were located on the main deck and only two LCs were located towards the stern. Therefore, the effect of deck location on animal behaviour was only statistically analysed for amidships versus bow on the main deck. Behaviour of animals in the two LCs located towards the stern was quantitatively similar to that of other animals on the same journey.
Only two LCs from Orkney were located in the lower hold (one LC during each of two journeys). Of the remaining LCs, only one was towards the stern on the main deck and all others were either amidships or towards the bow. Again therefore, only the effect on animal behaviour of LCs being towards the bow versus amidships was statistically analysed. The behaviour of animals in the two LCs in the lower hold and one LC towards the stern of the main deck were quantitatively similar to other animals on the respective journeys.
The location of the LC (near the bow or amidships) did not affect acceleration in g in the x, y or z planes (Mann Whitney W=159-223; p=0.221-0.805). LCs located towards the stern or in the lower hold experienced quantitatively similar acceleration to those elsewhere on the main deck.
No statistically significant differences were found in the behaviour of either cattle or sheep when located towards the bow as compared to towards the centre of the vessel (Table 3).
| Cattle from Orkney | Lambs from Shetland | |||||
|---|---|---|---|---|---|---|
| Main deck location | p | Main deck location | p | |||
| Bow | Amidships | Bow | Amidships | |||
| All standing behaviours | 0.95 | 0.97 | 0.322 | 0.38 | 0.38 | 0.554 |
| Stand idle | 0.63 | 0.80 | 0.066 | 0.30 | 0.31 | 0.371 |
| Stand rapid breathing | 0.10 | 0.02 | 0.059 | 0.04 | 0.04 | 0.866 |
| Stand ruminating | 0.07 | 0.06 | 0.254 | 0.01 | 0.01 | 0.719 |
| Stand eating | 0.00 | 0.01 | 0.039ɫ | Not analysable | ||
| Stand drinking | Not analysable | Not analysable | ||||
| All lying behaviours | 0.05 | 0.04 | 0.184 | 0.62 | 0.62 | 0.473 |
| Lying idle | 0.05 | 0.03 | 0.184 | 0.55 | 0.53 | 0.220 |
| Lying ruminating | 0.00 | 0.00 | 0.920 | 0.05 | 0.06 | 0.499 |
| Lying rapid breathing | 0.00 | 0.00 | 0.194 | 0.02 | 0.01 | 0.397 |
| Vocalising | Not analysable | Not analysable | ||||
LCs were usually orientated in three rows on the main deck, with their long axis parallel to that of the vessel. LCs were categorised as being located in the centre row (i.e. above the keel) or in one of the outer rows (i.e. towards port or starboard). Only three LCs for cattle (one on each journey) were located in the central row. Four LCs for lambs were located in the central row (two on one journey and one each on the other journeys). The behaviour of animals in the central LCs was quantitatively similar to that of animals in the other rows.
Observation of animals on arrival at Aberdeen: Observations at Aberdeen port lairage were challenging. Many groups of animals moved directly from LCs to a waiting road vehicle, or did so after less than 30 minutes in lairage. Other groups were moved between pens and/or mixed with neighbouring groups of animals which disturbed their behaviour. Furthermore, group sizes were large for the lambs and expressing behavioural occurrences per individual rather than per group was difficult.
Meaningful data were collected for nine LCs of cattle (two from journey 1, five from journey 2 and two from journey 3) and nine LCs of lambs (four from journey 1, three from journey 2 and two from journey 3). For the purposes of summarising the data, the behaviour of cattle during the first two hours in lairage was included and the behaviour of lambs for the first 1 hour was included (the large majority of lambs left the lairage within 2 hours). Group sizes and stocking densities were higher for the lambs and the duration in the lairage was shorter, therefore it should not be attempted to compare behaviour between the species. Given the small number of LCs sampled per journey and variation in factors such as location in the lairage and movement of animals in/out of neighbouring pens, it would also be unwise to draw conclusions about the impact of specific journeys on animal behaviour.
Broad trends can be highlighted from Table 4 below. The drinker was used during the first scan sample point in most lairage pens for both species. The first scan sample was at 5 minutes after the animals entered the pen, therefore the minimum latency for animals to drink or lie in Table 4 was 5 minutes. It is possible that animals drank within the first 5 minutes of entering the pen, but this was not captured by the scan sampling. For cattle it took over an hour for the first animal to lie down and over 1.5 hours for five animals to lie simultaneously. As few cattle lay down in the lairage pens in Kirkwall or during the sailing, this was surprising. It also varies from earlier work which shows that cattle spend around 40 mins of the first 60 minutes lying after a 20 hour road journey, although the conditions in the present study are not directly comparable (being on store cattle transported by sea rather than recently weaned calves transported by road). However, it is likely that this long latency to lie after disembarking results from the novel environment and stimuli of the busy lairage in Aberdeen and may not indicate a lack of fatigue. In both species, rumination was shown by only a small proportion of animals during each scan.
Observation of injuries was also difficult both before loading into the LCs and on arrival in Aberdeen due to the lairage pens being highly stocked and the period moving to/from pens providing a very short period of time to observe individual animals. No significant new injuries were present in Aberdeen that could be confidently ascribed to the journey which likely reflects the calm handling observed at all lairages and the scarcity of slips or falls during the sailings.
| Journey | Mean latency to first animal drinking (mins) | Mean latency to first animal lying (mins) | Mean latency to 5 animals lying simultaneously | Mean number of animals drinking per scan | Mean number of animals lying per scan | Mean proportion of visible animals ruminating per scan | |
|---|---|---|---|---|---|---|---|
| Cattle | 1 | 5 | 67 | 92 | 0.13 | 1.77 | 0.07 |
| 2 | 6 | 69 | 102 | 0.43 | 1.07 | 0.08 | |
| 3 | 15 | 87 | 90 | 0.30 | 1.38 | - | |
| Lambs | 1 | 6 | 36 | 47 | 1.44 | 5.91 | 0.09 |
| 2 | 5 | 31 | 55 | 1.39 | 0.94 | 0.04 | |
| 3 | 17 | 50 | 60 (maximum) | 0.15 | 0.21 | 0.02 |
Contact
There is a problem
Thanks for your feedback